TRADERS’ TIPS
August 2020

For this month’s Traders’ Tips, the focus is Vitali Apirine’s article in this issue, “The Compare Price Momentum Oscillator (CPMO).” Here, we present the August 2020 Traders’ Tips code with possible implementations in various software.
New contributor this month: Optuma
You can right-click on any chart to open it in a new tab or window and view it at it’s originally supplied size, often much larger than the version printed in the magazine.
The Traders’ Tips section is provided to help the reader implement a selected technique from an article in this issue or another recent issue. The entries here are contributed by software developers or programmers for software that is capable of customization.

TRADESTATION: AUGUST 2020
In his article in this issue, “The Compare Price Momentum Oscillator (CPMO),” author Vitali Apirine reintroduces us to the DecisionPoint PMO originally developed by Carl Swenlin and presents a new way to use it to compare the relative momentum of two different securities. Trading signals can be derived in a number of ways including momentum, signal line, and zero-line crossovers.
When using the CPMO indicator in a TradeStation chart, configure two data streams, Data1 being the security of interest and Data2 being the compare or reference symbol.
Here, we are providing the TradeStation EasyLanguage code for both an indicator and strategy based on the author’s work as well as a PMO function to make it easier for you to explore using this calculation in your own work.
Indicator: CPMO

// TASC AUG 2020
// Vitali Apirine
// CPMO

inputs:
	Length1( 35 ),
	Length2( 20 ),
	Price1( Close of Data1 ),
	Price2( Close of Data2 ) ;

variables:
	PMO1( 0, Data1 ),
	PMO2( 0, Data2 ) ;


PMO1 = PMO( Price1, Length1, Length2 ) of Data1 ;
PMO2 = PMO( Price2, Length1, Length2 ) of Data2 ;


Plot1( PMO1, "PMO1" ) ;
Plot2( PMO2, "PMO2" ) ;
Plot3( 0, "ZL" )


Indicator: PMO

// TASC AUG 2020
// Vitali Apirine
// PMO

inputs:
	Period1( 35 ),
	Period2( 20 ),
	SignalLineLength( 10 ),
	Price( Close ) ;

variables:
	PMOOsc( 0 ),
	PMOSignalLine( 0 ) ;

PMOOsc = PMO( Price, Period1, Period2 ) ;
PMOSignalLine = XAverage( PMOOsc,
	SignalLineLength ) ;

Plot1( PMOOsc, "PMO" ) ;
Plot2( PMOSignalLine, "PMO Signal Line" ) ;
Plot3( 0, "ZL" ) ;


Strategy: PMO

// TASC AUG 2020
// Vitali Apirine
// PMO

inputs:
	Period1( 35 ),
	Period2( 20 ),
	SignalLineLength( 10 ),
	Price( Close ) ;

variables:
	PMOOsc( 0 ),
	PMOSignalLine( 0 ) ;

PMOOsc = PMO( Price, Period1, Period2 ) ;
PMOSignalLine = XAverage( PMOOsc,
	SignalLineLength ) ;

if PMOOsc crosses over PMOSignalLine then
	Buy next bar at Market
else if PMOOsc crosses under PMOSignalLine then
	SellShort next bar at Market ;


Function: PMO

// TASC AUG 2020
// Vitali Apirine
// PMO

inputs:
	Price( numericseries ),
	Period1( numericsimple ),
	Period2( numericsimple ) ;

variables:
	ROC( 0 ),
	Smoothing1( 2 / Period1 ),
	Smoothing2( 2 / Period2 ),
	EMAofROC( 0 ),
	PMOOsc( 0 ) ;

ROC = RateOfChange( Price, 1 ) ;
EMAofROC =	EMAofROC[1] * ( 1 - Smoothing1 )
	+ ROC * Smoothing1 ;
PMOOsc = PMOOsc[1] * ( 1 - Smoothing2 )
	+ EMAofROC * 10 * Smoothing2 ;
PMO = PMOOsc ;
To download the EasyLanguage code, please visit our TradeStation and EasyLanguage support forum. The files for this article can be found here: https://community.tradestation.com/Discussions/Topic.aspx?Topic_ID=168100. The filename is “TASC_AUG2020.ZIP.” For more information about EasyLanguage in general please see: https://www.tradestation.com/EL-FAQ.
A sample chart is shown in Figure 1.
FIGURE 1: TRADESTATION. Here is an example of evaluating the XLE Select Energy Sector SPDR ETF using the CPMO and PMO indicators.
This article is for informational purposes. No type of trading or investment recommendation, advice, or strategy is being made, given, or in any manner provided by TradeStation Securities or its affiliates.
—Doug McCrary
TradeStation Securities, Inc.
www.TradeStation.com
BACK TO LIST

WEALTH-LAB: AUGUST 2020
The compare price momentum oscillator (CPMO) described in Vitali Apirine’s article in this issue is not really a new indicator. It’s rather an approach to put the DecisionPoint price momentum oscillator (PMO) in an intermarket context.
Specifically, the author uses the CPMO to compare the momentum of different indexes. For example, it’s believed that the S&P 500 rises when consumer discretionary (IXY) outperforms consumer staples (IXR) and vice versa.
As a reference, we are including a simplistic strategy that produces buy signals when the PMO of IXY crosses above the PMO of IXR. The opposite event (a crossunder) generates a sell signal. Wealth-Lab users can find the PMO in the Community Indicators library.
FIGURE 2: WEALTH-LAB. On the daily chart, consumer discretionary (IXY) and consumer staples (IXR) are plotted along with the S&P 500 ETF (SPY).
On a closing note, users can simply download public strategies from Wealth-Lab (hit Ctrl-O and choose download) to get the trading system code shown here:
using System;
using System.Collections.Generic;
using System.Text;
using System.Drawing;
using WealthLab;
using WealthLab.Indicators;
using Community.Indicators;

namespace WealthLab.Strategies
{
	public class TASCAug2020 : WealthScript
	{
		private StrategyParameter slider1;
		private StrategyParameter slider2;

		public TASCAug2020()
		{
			slider1 = CreateParameter("PMO period 1",35,2,300,20);
			slider2 = CreateParameter("PMO period 2",20,2,300,20);
		}

		protected override void Execute()
		{
			var ls = LineStyle.Solid;
			var ixy = GetExternalSymbol("IXY", true).Close;
			var ixr = GetExternalSymbol("IXR", true).Close;
			var pmo_ixy = PMO.Series(ixy, slider1.ValueInt, slider2.ValueInt);
			var pmo_ixr = PMO.Series(ixr, slider1.ValueInt, slider2.ValueInt);
			int xoBar = -1, xuBar = -1;

			ChartPane panePMO = CreatePane( 40, true, true); HideVolume();
			PlotSeries( panePMO, pmo_ixy, Color.Green, ls, 1);
			PlotSeries( panePMO, pmo_ixr, Color.Red, ls, 1);

			for(int bar = GetTradingLoopStartBar( Math.Max(pmo_ixy.FirstValidValue, pmo_ixr.FirstValidValue)); bar < Bars.Count; bar++)
			{
				bool xo = CrossOver( bar, pmo_ixy, pmo_ixr);
				bool xu = CrossUnder( bar, pmo_ixy, pmo_ixr);

				if (xo) {
					xoBar = bar;
					DrawCircle( panePMO, 15, bar, pmo_ixy[bar], Color.Green, LineStyle.Solid, 1, true);
				}

				if (xu) {
					xuBar = bar;
					DrawCircle( panePMO, 15, bar, pmo_ixy[bar], Color.Red, LineStyle.Solid, 1, true);
				}

				SetBackgroundColor( bar, (xoBar > xuBar) ? Color.FromArgb(20, Color.Green) : Color.FromArgb(20, Color.Red));
				if (xoBar == xuBar)
					SetBackgroundColor( bar, Color.Transparent);
				if (xoBar == xuBar) continue;

				if (IsLastPositionActive)
				{
					Position p = LastPosition;
					if (xu) SellAtMarket( bar + 1, p, "Trend change");
				}
				else
				{
					if (xoBar > xuBar)
						BuyAtMarket( bar + 1);
				}
			}
		}
	}
}
—Gene Geren (Eugene)
Wealth-Lab team
www.wealth-lab.com
BACK TO LIST

THINKORSWIM: AUGUST 2020
We have put together a pair of studies based on the article by Vitali Apirine in this issue, “The Compare Price Momentum Oscillator (CPMO).” We built the studies referenced by using our proprietary scripting language, thinkscript. To ease the loading process, simply click on https://tos.mx/wt3uvnf or enter it into setup → open shared item from within thinkorswim then choose view thinkScript study and name it “CPMO.” Do the same with https://tos.mx/bLZ6T2E and name it “PMO.” These can then be added to your chart from the edit study and strategies menu within thinkorswim charts.
The example chart shown in Figure 3 shows the CPMO on a chart of IXY compared to IXR for a time period of May 1, 2018 through May 30, 2019 in one-day candles. We do not have PMO displayed in the screenshot as it is a function of CPMO. See Vitali Aprinie’s article for more information on how to read and utilize these studies.
FIGURE 3: THINKORSWIM. The example chart shows the CPMO on a chart of IXY compared to IXR for a time period of May 1, 2018 through May 30, 2019 in one-day candles.
—thinkorswim
A division of TD Ameritrade, Inc.
www.thinkorswim.com
BACK TO LIST

NINJATRADER: AUGUST 2020
The PMO (CPMO) indicator, as discussed in Vitali Apirine’s article in this issue, “The Compare Price Momentum Oscillator (CPMO),” is available for download at the following links for NinjaTrader 8 and NinjaTrader 7:
Once the file is downloaded, you can import the strategy into NinjaTader 8 from within the Control Center by selecting Tools → Import → NinjaScript Add-On and then selecting the downloaded file for NinjaTrader 8. To import in NinjaTrader 7 from within the Control Center window, select the menu File → Utilities → Import NinjaScript and select the downloaded file.
You can review the indicator source code in NinjaTrader 8 by selecting the menu New → NinjaScript Editor → Indicators from within the Control Center window and selecting the PMO file. You can review the indicator source code in NinjaTrader 7 by selecting the menu Tools → Edit NinjaScript → Indicator from within the Control Center window and selecting the PMO file.
A sample chart displaying the indicator is shown in Figure 4.
FIGURE 4: NINJATRADER. Two PMO indicators added to ^SP500 weekly and ^TICK weekly charts. The ^TICK PMO plot is overlaid on the ^SP500 PMO plot for comparison.
NinjaScript uses compiled DLLs that run native, not interpreted, to provide you with the highest performance possible.
—Jim Dooms
NinjaTrader, LLC
www.ninjatrader.com
BACK TO LIST

THE ZORRO PROJECT: AUGUST 2020
The compare price momentum oscillator (CPMO) presented in this issue in the article by Vitali Apirine is based on the price momentum oscillator (PMO), which was developed by Carl Swenlin. The PMO is a mixture of classical indicators: the EMA of the EMA of the rate-of-change (ROC), multiplied by 10. For some reason, Swenlin used a nonstandard EMA formula to the effect that the two EMA time periods, supposed to be 35 and 20, are in fact 34 and 19. The purpose of multiplying by 10 is unknown.
The PMO code in C for Zorro fits in one line:
var PMO(vars Data)
{
   return 10*EMA(EMA(ROC(Data,1),34),19);
}
CPMO is not a new indicator but rather a comparison of two index PMOs in hopes of deriving useful information from their divergences or crossing points. The author provides several examples in his article. We’re replicating one of them here, the PMOs of the Consumer Discretionary Select Sector (IXY) and the Consumer Staples Select Sector (IXR) compared with the trend of the S&P 500 index (SPX). Shown here is the code. It retrieves the historical data from Stooq and Yahoo.
function run()
{
   BarPeriod = 1440;

   assetAdd("SPX","STOOQ:^SPX");
   asset("SPX");
   assetAdd("IXY","YAHOO:IXY");
   asset("IXY");
   vars PricesIXY = series(priceClose());
   assetAdd("IXR","YAHOO:IXR");
   asset("IXR");
   vars PricesIXR = series(priceClose());

   plot("IXY",PMO(PricesIXY),NEW|LINE,GREEN);
   plot("IXR",PMO(PricesIXR),LINE,RED);
}
The script produces the chart shown in Figure 5.
FIGURE 5: THE ZORRO PROJECT. Here is an example chart produced by the Zorro script presented here.
According to the author, the IXR-IXY PMO crossings identify changes in investor sentiment and therefore SPX trend. Indeed, they do in the selected chart, although with some delay and only three out of five times. So it’s hard to judge the CPMO’s usefulness in that context. But as the author writes: “CPMO [...] should be used in conjunction with other indicators like moving averages, chart patterns, or other forms of technical analysis.” Add enough other indicators, and you will succeed. Maybe.
The indicator and script can be downloaded from the 2020 script repository on https://financial-hacker.com. The Zorro platform can be downloaded from https://zorro-project.com.
—Petra Volkova
The Zorro Project by oP group Germany
www.zorro-project.com
BACK TO LIST

NEUROSHELL TRADER: AUGUST 2020
The compare price momentum oscillator (CPMO) described by Vitali Apirine in his article in this issue can be easily implemented in NeuroShell Trader by combining a few of NeuroShell Trader’s 800+ indicators. To implement the PMO and PMO signal indicators, select new indicator from the insert menu and use the indicator wizard to create the following indicators:
PMO	ExpAvg( Mul2( 10, ExpAvg( %Change(Close,1), 34) ), 19 )
PMO Signal	ExpAvg( PMO, 10 )
To compare multiple symbols on one chart (Figure 6), simply add multiple PMO indicators that use other instrument data for each of the other symbols. Note also that because the custom smoothing is the same as exponential smoothing of one less period, the indicators above use EMA smoothing of 34 and 19 in place of the mathematically equivalent custom smoothing of 35 and 20.
FIGURE 6: NEUROSHELL TRADER. This NeuroShell Trader chart shows the CPMO for the Energy Sector (IXE) and S&P 500 (SPX).
NeuroShell Trader users can go to the Stocks & Commodities section of the NeuroShell Trader free technical support website to download a copy of this or any previous Traders’ Tips.
—Marge Sherald, Ward Systems Group, Inc.
301 662-7950, sales@wardsystems.com
www.neuroshell.com
BACK TO LIST

TRADE NAVIGATOR: AUGUST 2020
We have created a special file to make it easy to download the library in Trade Navigator that is based on the article in this issue, “The Compare Price Momentum Oscillator (CPMO).” The file name is “SC202008.”
To install this new library into Trade Navigator, click on the blue telephone button, select download special file, then erase the word “upgrade” and type in “SC202008” (without the quotes), and click on the start button. When prompted to upgrade, click the yes button. If prompted to close all software, click on the continue button. Your library will now download. This library contains two indicators named “PMO” and “PMO Signal Line,” as well as a template named “S&C Aug2020.”
You can insert these indicators onto your chart by opening the charting dropdown menu, selecting the add to chart command, then on the indicators tab, finding your named indicators, selecting them, then clicking on the add button. Repeat this procedure for additional indicators as well if you wish.
This library also contains a template named “S&C Aug2020.” This template can be inserted onto your chart by opening the charting dropdown menu, then selecting the templates command, then selecting the “S&C Aug2020” template.
FIGURE 7: TRADE NAVIGATOR. Here, the “S&C Aug2020” template is shown applied to the chart.
If you need assistance with creating or using the indicators and/or template, our friendly technical support staff will be happy to help via phone or via live chat through our website.
—Genesis Financial Data
Tech support 719 884-0245
www.TradeNavigator.com
BACK TO LIST

OPTUMA: AUGUST 2020
In Optuma there’s no need to have a second PMO formula for the comparison PMO: you can apply the main PMO to each of the charts on the screen and then click and drag one over the other, so you can have more than two.
FIGURE 8: OPTUMA. This sample chart displays three PMOs on one chart.
Here is the main PMO formula:
// Get the Rate of Change
    Rate1 = ROC(BARS=1);

// Calculate the Smoothing Factors
    RT1 = 2 / 35;
    RT2 = 2 / 20;

// Calculate the Main PMO
    TMP1 = (TMP1[1] * (1-RT1)) + (Rate1 * RT1);
    TMP2 = TMP1 * 10;
    Plot1 = (Plot1[1] * (1-RT2)) + (TMP2*RT2);
—support@optuma.com
BACK TO LIST

TRADERSSTUDIO: AUGUST 2020
The importable TradersStudio files based on Vitali Aprine’s article in this issue can be obtained on request via email to info@TradersEdgeSystems.com. The code is also available here:
'The Compare Price Momentum Oscillator (CPMO)
'Author: Vitali Aprine, TASC August 2020
'Coded by: Richard Denning, 6/20/20
'www.TradersEdgeSystems.com

'Custom smoothing multiplier: 2 / time period
'PMO line: 20-period custom EMA of (10  35-period
'custom EMA of ((Todays price / Yesterdays price)
'Yesterdays price  100))

'FUNCTION TO COMPUTE PMO:
Function PMO(len1,len2,Price As BarArray)
'len1 = 20
'len2 = 40
'LenIdx = 300
'Ticker1 = "NAS100"
'Ticker2 = "SPY"

Dim RC1 As BarArray
Dim custSmoLen1, custSmoLen2
Dim custEma As BarArray

RC1 = (Price/Price[1]*100)-100
custSmoLen1 = len1 - 1
custSmoLen2 = len2 - 1
custEma = 10*XAverage(RC1,custSmoLen2)
PMO = XAverage(custEma,custSmoLen1)

End Function
'-----------------------------------------------
'INDICATOR PLOT:
Sub PMO_IND(len1,len2)
Dim PMO_indep1 As BarArray
Dim PMO_indep2 As BarArray
Dim price1 As BarArray
Dim price2 As BarArray

price1 = C Of independent1
price2 = C Of independent2

PMO_indep1 = PMO(len1,len2,price1)
PMO_indep2 = PMO(len1,len2,price2)

plot1(PMO_indep1)
plot2(PMO_indep2)

End Sub
'--------------------------------------------
'TRADING SYSTEM THAT USES CPMO INDICATOR:
Sub CPMO_SYS(len1,len2,lenIdx)
'len1=20, len2=40,LenIdx=300

Dim PMO_indep1 As BarArray
Dim PMO_indep2 As BarArray
Dim price1 As BarArray
Dim price2 As BarArray

price1 = C Of independent1  'QQQ
price2 = C Of independent2  'SPY

PMO_indep1 = PMO(len1,len2,price1)
PMO_indep2 = PMO(len1,len2,price2)

If PMO_indep1 - PMO_indep2 > 0 Then
  If C > Average(C,lenIdx) And price2 > Average(price2,lenIdx) Then
     Buy("LE",1,0,Market,Day)
  End If
End If
If PMO_indep1 - PMO_indep2 <= 0 Then ExitLong("LX","",1,0,Market,Day)

End Sub
'--------------------------------------------------------------------
Code for the PMO oscillator is included in the PMO function file. The indicator plot for the CPMO is coded in the PMO_IND file which displays the PMO for two tickers that are set up as independent1 and independent2 in TradersStudio.
I also coded a system that uses the CPMO oscillator. I set up the NDX as independent1 and the SPX as independent2 and then use the cross up of the PMO as a buy signal to go long on the main series to be traded. There is also a trend filter that requires both the tradable and the NDX to be above a moving average. The equity curve for trading this system on QQQ and IWM is shown in Figure 9.
FIGURE 9: TRADERSSTUDIO. Shown here is an example equity curve for a trading system that uses the CPMO and trades QQQ and IWM.
—Richard Denning
info@TradersEdgeSystems.com
for TradersStudio
BACK TO LIST

AIQ: AUGUST 2020
The importable AIQ EDS file based on Vitali Apirine’s article in this issue, “The Compare Price Momentum Oscillator (CPMO),” can be obtained on request via email to info@TradersEdgeSystems.com. The code is also available here:
!The Compare Price Momentum Oscillator (CPMO)
!Author: Vitali Aprine, TASC August 2020
!Coded by: Richard Denning, 6/20/20
!www.TradersEdgeSystems.com

!Custom smoothing multiplier: 2 / time period
!PMO line: 20-period custom EMA of (10 × 35-period
!custom EMA of ((Today’s price – Yesterday’s price) /
!Yesterday’s price × 100))
!PMO signal line: 10-period EMA of the PMO line

Len1 is 20.
Len2 is 35.
Len3 is 10.
Ticker1 is "QQQ".
Ticker2 is "SPY".

C is [close].
C1 is valresult(C,1).
RC1 is (C/C1*100)-100.

custSmoLen1 is Len1 - 1.
custSmoLen2 is Len2 - 1.

CustEma is 10*expavg(RC1,custSmoLen2).
PMO is expavg(CustEma,custSmoLen1).
PMOsig is expavg(PMO,Len3).

Ticker1C is tickerUDF(Ticker1,C).
RC1ticker1 is (Ticker1C/valresult(Ticker1C,1)*100)-100.
CustEmaTicker1 is 10*expavg(RC1ticker1,custSmoLen2).
PMOticker1 is expavg(CustEmaTicker1,custSmoLen1).

Ticker2C is tickerUDF(Ticker2,C).
RC1ticker2 is (Ticker2C/valresult(Ticker2C,1)*100)-100.
CustEmaTicker2 is 10*expavg(RC1ticker2,custSmoLen2).
PMOticker2 is expavg(CustEmaTicker2,custSmoLen1).

CPMO is PMOTicker1 - PMOTicker2.

List if hasdatafor(1000) >= 900.
I coded the indicator described by the author. Figure 10 shows the indicator (QQQ,SPY,20,35) on chart of IWM. When the white line is above the red line on the CPMO indicator, this indicates that the QQQ is stronger than the SPY. Generally, it is considered bullish when the QQQ is leading in strength.
FIGURE 10: AIQ. The CPMO indicator is shown on a chart of IWM with parameters (QQQ,SPY,20,35).
—Richard Denning
info@TradersEdgeSystems.com
for AIQ Systems
BACK TO LIST
MICROSOFT EXCEL: AUGUST 2020
In his article in this issue, Vitali Apirine demonstrates using the PMO oscillator as a tool to compare index funds or other securities.
Please note the symbol XLE.
As I have noted for earlier T-Tips, your data may not match my data. Different software platforms and their data vendors can have a slightly different viewpoint as to the prices for a bar when compared to what my spreadsheets download from Yahoo Finance.
This extends into the land of symbols for indexes. Yahoo Finance does not recognize nor produce data for either “IXE” nor “SPX.” But it is quite happy to produce data for XLE and SPY. The SPY equivalence I already knew. But it took a bit of searching to arrive at XLE.
So, if you choose to try replicating the other charts in the article, you will need to be prepared to search out Yahoo Finance-acceptable equivalents for the symbols used in the other examples in the article.
PMO is an interesting tool for comparisons and an easy calculation for Excel.
The only slow point in spreadsheet processing happens when you change symbols for the comparison and then initiate a history download. To keep both symbols in sync, I am forcing a fresh download of both symbols before displaying the charts. Even if only one has changed from the previous comparison.
Since PMO is applicable to securities, I have chosen to use it here to compare three chip stocks that have been prominent in recent market news: NVIDIA (NVDA), Advanced Micro Devices (AMD), and Texas Instruments (TXN).
Most recent bar available PMO comparisons would seem to rank the three as NVIDIA, then Texas Instruments, followed by Advanced Micro Devices.
FIGURE 11: EXCEL. A comparison of the PMO indicators for XLE and SPY indexes, similar to Figure 1 in Vitali Apirine’s article.
FIGURE 12: EXCEL. NVIDIA (NVDA) vs. Advanced Micro Devices (AMD).
FIGURE 13: EXCEL. NVIDIA (NVDA) vs. Texas Instruments (TXN).
FIGURE 14: EXCEL. Advanced Micro Devices (AMD) vs. Texas Instruments (TXN).
A note about the clutter controls: You can set up to look at the PMO (and signal line) of either security alone or both securities at the same time as I have done in these examples. But you cannot turn them both off. If one of the security buttons is already off, code behind the buttons will force the other button to “on” when you turn the remaining button off.
To download this spreadsheet: The spreadsheet file for this Traders’ Tip can be downloaded here. To successfully download it, follow these steps:
- Right-click on the Excel file link, then
- Select “save as” (or “save target as”) to place a copy of the spreadsheet file on your hard drive.
—Ron McAllister
Excel and VBA programmer
rpmac_xltt@sprynet.com
BACK TO LIST

eSIGNAL: AUGUST 2020
For this month’s Traders’ Tip, we’ve provided the Compare Price Momentum.efs study based on the article by Vitali Apirine, “The Compare Price Momentum Oscillator (CPMO).”
The studies contain formula parameters which may be configured through the Edit Chart window (right-click on the chart and select “Edit Chart”). A sample chart is shown in Figure 15.
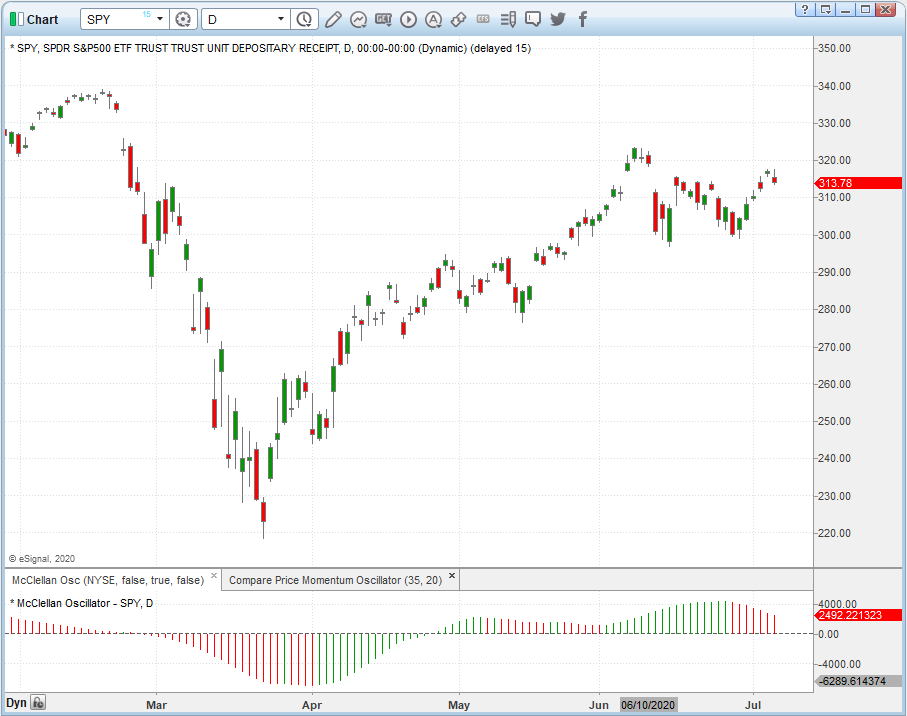
FIGURE 15: eSIGNAL. Here is an example of the studies plotted on a daily chart of the SPY.
To discuss this study or download a complete copy of the formula code, please visit the EFS Library Discussion Board forum under the forums link from the support menu at www.esignal.com or visit our EFS KnowledgeBase at https://www.esignal.com/support/kb/efs/. The eSignal formula script (EFS) is also available for copying & pasting below.
/**********************************
Provided By:
Copyright 2019 Intercontinental Exchange, Inc. All Rights Reserved.
eSignal is a service mark and/or a registered service mark of Intercontinental Exchange, Inc.
in the United States and/or other countries. This sample eSignal Formula Script (EFS)
is for educational purposes only.
Intercontinental Exchange, Inc. reserves the right to modify and overwrite this EFS file with each new release.

Description:
   The Compare Price Momentum Oscillator (CPMO)
   by Vitali Apirine


Version:            1.00  06/29/2020

Formula Parameters:                     Default:
Periods1                                35
Periods2                                20

Notes:
The related article is copyrighted material. If you are not a subscriber
of Stocks & Commodities, please visit www.traders.com.

**********************************/
var fpArray = new Array();
var bInit = false;

function preMain() {
    setStudyTitle("Compare Price Momentum Oscillator");
    setCursorLabelName("CPMO", 0);
    setPriceStudy(false);
    setDefaultBarFgColor(Color.RGB(0x00,0x94,0xFF), 0);
    setPlotType( PLOTTYPE_LINE , 0 );
    addBand( 0, PLOTTYPE_DOT, 1, Color.grey);


    var x=0;
    fpArray[x] = new FunctionParameter("Periods1", FunctionParameter.NUMBER);
	with(fpArray[x++]){
        setLowerLimit(1);
        setDefault(35);
    }
    fpArray[x] = new FunctionParameter("Periods2", FunctionParameter.NUMBER);
	with(fpArray[x++]){
        setLowerLimit(1);
        setDefault(20);
    }

}

var bVersion = null;
var xClose = null;
var PMO = null;
var PMO_1 = null;
var vPMO = [];
var RT1 = null;
var RT2 = null;
var xRate = null;
var Tmp = null;
var Tmp_1 = null;
var Tm = null;
var vTM = [];
var CPMO = null;


function main(Periods1,Periods2) {
    if (bVersion == null) bVersion = verify();
    if (bVersion == false) return;

    if ( bInit == false ) {
        xClose = close();
        RT1 = 2 / Periods1;
        RT2 = 2 / Periods2;
        xRate = efsInternal("Calc_RATE", xClose)
        Tmp = 0;
        Tmp_1 = 0;
        if (Periods2 < Periods1) {
            for (var i = 0; i < Periods1 - Periods2; i++) {
                vTM.unshift(0);
            }
        }
        if (Periods2 > Periods1) {
            for (var i = 0; i < Periods2 - Periods1; i++) {
                vTM.unshift(0);
            }
        }

        bInit = true;
    }

    if (getCurrentBarCount() < 2 ) return;
    if (getBarState() == BARSTATE_NEWBAR) {
        Tmp_1 = Tmp;
        PMO_1 = PMO;
    }

    if (getCurrentBarCount() <= Periods1) Tmp = sma(getCurrentBarCount(), xRate, 0);
    else Tmp = Tmp_1 * (1 - RT1) + xRate.getValue(0) * RT1;
    Tm = Tmp * 10;

    if (getBarState() != BARSTATE_NEWBAR) {
        vTM.shift();
        vPMO.shift();
    }
    vTM.unshift(Tm);

    if (getCurrentBarCount() <= Periods2) PMO = SMACalc(getCurrentBarCount(), vTM);
    else PMO = PMO_1 * (1 - RT2) + vTM[0] * RT2;

    vPMO.unshift(PMO);
    СPMO = EMACalc(10, vPMO);

    if (getCurrentBarCount() < Periods1 || getCurrentBarCount() < Periods2) return;
    return [СPMO]
}

function SMACalc(Periods,Array) {
    sma_ = 0;
    for (var i = 0; i < Periods; i++) {
      sma_ = sma_ + Array[i]
    }
    return sma_/Periods;
}

function EMACalc(Periods,mArray) {
    var k = 2/(Periods + 1);
    // first item is just the same as the first item in the input
    emaArray = [mArray[0]];
    // for the rest of the items, they are computed with the previous one
    for (var i = 1; i < mArray.length; i++) {
      emaArray.unshift(mArray[i] * k + emaArray[i - 1] * (1 - k));
    }
    return emaArray[0];
}

function Calc_RATE(xClose) {
    var ret = 0;
    if (xClose.getValue(-1) == undefined || xClose.getValue(-1) == 0) return;
    ret = (xClose.getValue(0) - xClose.getValue(-1)) / xClose.getValue(-1) * 100;
    if (!ret) {
        ret = 0;
    }
    return ret;
}

function verify(){
    var b = false;
    if (getBuildNumber() < 779){

        drawTextAbsolute(5, 35, "This study requires version 10.6 or later.",
            Color.white, Color.blue, Text.RELATIVETOBOTTOM|Text.RELATIVETOLEFT|Text.BOLD|Text.LEFT,
            null, 13, "error");
        drawTextAbsolute(5, 20, "Click HERE to upgrade.@URL=https://www.esignal.com/download/default.asp",
            Color.white, Color.blue, Text.RELATIVETOBOTTOM|Text.RELATIVETOLEFT|Text.BOLD|Text.LEFT,
            null, 13, "upgrade");
        return b;
    }
    else
        b = true;

    return b;
}
—Eric Lippert
eSignal, an Interactive Data company
800 779-6555, www.eSignal.com
BACK TO LIST
Originally published in the August 2020 issue of
Technical Analysis of STOCKS & COMMODITIES magazine.
All rights reserved. © Copyright 2020, Technical Analysis, Inc.