TRADERS’ TIPS
February 2011
Here is this month’s selection of Traders’ Tips, contributed by various developers of technical analysis software to help readers more easily implement some of the strategies presented in this and other issues.
Other code appearing in articles in this issue is posted in the Subscriber Area of our website at https://technical.traders.com/sub/sublogin.asp. Login requires your last name and subscription number (from mailing label). Once logged in, scroll down to beneath the “Optimized trading systems” area until you see “Code from articles.” From there, code can be copied and pasted into the appropriate technical analysis program so that no retyping of code is required for subscribers.
You can copy these formulas and programs for easy use in your spreadsheet or analysis software. Simply “select” the desired text by highlighting as you would in any word processing program, then use your standard key command for copy or choose “copy” from the browser menu. The copied text can then be “pasted” into any open spreadsheet or other software by selecting an insertion point and executing a paste command. By toggling back and forth between an application window and the open web page, data can be transferred with ease.
This month’s tips include formulas and programs for:
- TRADESTATION: SPEARMAN INDICATOR
- BLOOMBERG: SPEARMAN INDICATOR
- eSIGNAL: SPEARMAN INDICATOR
- WEALTH-LAB: SPEARMAN INDICATOR
- WORDEN BROTHERS STOCKFINDER: SPEARMAN INDICATOR
- NEUROSHELL TRADER: SPEARMAN INDICATOR
- AIQ: SPEARMAN INDICATOR
- TRADERSSTUDIO: SPEARMAN INDICATOR
- NINJATRADER: SPEARMAN INDICATOR
- WAVE59: SPEARMAN INDICATOR
- UPDATA: SPEARMAN INDICATOR
- CHARTSY: SPEARMAN INDICATOR
- TRADESIGNAL: SPEARMAN INDICATOR
- SHARESCOPE: SPEARMAN INDICATOR
- TRADECISION: SPEARMAN INDICATOR
- MICROSOFT EXCEL: SPEARMAN INDICATOR
- AMIBROKER: SPEARMAN INDICATOR — VALCU ARTICLE CODE

![]() TRADESTATION: SPEARMAN INDICATOR
TRADESTATION: SPEARMAN INDICATOR
In “The Spearman Indicator For Technical Analysis” in this issue, author Dan Valcu describes the use of Spearman’s rank correlation coefficient to aid in identifying trend intensity and turning points. Valcu identifies overbought and oversold levels of 80 and -80, respectively, and states that these levels may signal a potential reversal of the trend.
Valcu also describes potential entry points when the coefficient crosses over or under its three-bar simple moving average or when the coefficient crosses over or under zero. For this Traders’ Tip, we’ll provide the EasyLanguage code for a Spearman coefficient indicator (“_Spearman Indicator”) and a strategy (“_Spearman Strategy”). Entry conditions for the strategy are a crossing of the coefficient with its average in overbought or oversold territory (see strategy code).
To download the EasyLanguage code for the indicator and strategy, go to the TradeStation and EasyLanguage Support Forum (https://www.tradestation.com/Discussions/forum.aspx?Forum_ID=213) and search for the file “SpearmanCoefficient.Eld.”
_Spearman Indicator

inputs:
	N( 10 ), { number of bars }
	AvgLen( 3 ), { length for simple mov avg }
	PlotZeroLine( true ),
	OverBoughtLevel( 80 ),
	OverSoldLevel( -80 ),
	PlotOBOS( true ) ;

variables:
	MinIndex( 0 ),
	TestValue( 0 ),
	x( 0 ),
	y( 0 ),
	ab( 0 ),
	ab2( 0 ),
	absum( 0 ),
	coefcorr( 0 ),
	sc( 0 ) ;

arrays:
	CloseArray[2,21]( 0 ) ;

if N > 20 then
	RaiseRuntimeError(
		"The maximum value of N is 20." ) ;

if BarStatus( 1 ) = 2 then {only load data and perform
 calculations at the end of the bar }
	begin

	{ load data into array }
	for x = 1 to N
		begin
		CloseArray[1,x] = x ;
		CloseArray[2,x] = Close[N-x] ;
		end ;

	{ sort array ascending by price (Close) }
	for x = 1 to N - 1
		begin
		TestValue = CloseArray[2,x] ;
		MinIndex = x ;
		for y = x + 1 to N
			begin
			if TestValue > CloseArray[2,y] then
				begin
				MinIndex = y ;
				TestValue = CloseArray[2,y] ;
				end ;
			end ;

		if MinIndex <> x then
			begin
			Value97 = CloseArray[1,x] ;
			Value98 = CloseArray[2,x] ;
			CloseArray[1,x] = CloseArray[1,MinIndex] ;
			CloseArray[2,x] = CloseArray[2,MinIndex] ;
			CloseArray[1,MinIndex] = Value97 ;
			CloseArray[2,MinIndex] = Value98 ;
			end ;

		end ;

	{ compute Spearman's rank correlation for N bars }
	absum = 0 ;
	for x = 1 to N
		begin
		ab = x - CloseArray[1,x] ;
		ab2 = ab * ab ;
		absum = absum + ab2 ;
		end ;

	coefcorr = ( 1 - ( 6 * absum ) /
	 ( N * ( N * N - 1 ) ) ) ;
	sc = 100 * coefcorr ;

	end ;

{ plots }
Plot1( sc, "SpearmanInd", Cyan ) ;
Plot2( Average( sc, AvgLen), "SMA", Red ) ;
if PlotZeroLine then
	Plot3( 0, "Zero", White ) ;
if PlotOBOS then
	begin
	Plot4( OverBoughtLevel, "OB", DarkBrown ) ;
	Plot5( OverSoldLevel, "OS", DarkGreen ) ;
	end ;

_Spearman Strategy

[IntrabarOrderGeneration = false]

inputs:
	N( 10 ),
	AvgLen( 3 ),
	OverBoughtLevel( 80 ),
	OverSoldLevel( -80 ) ;

variables:
	MinIndex( 0 ),
	TestValue( 0 ),
	x( 0 ),
	y( 0 ),
	ab( 0 ),
	ab2( 0 ),
	absum( 0 ),
	coefcorr( 0 ),
	sc( 0 ),
	scavg( 0 ) ;

arrays:
	CloseArray[2,21]( 0 ) ;

if N > 20 then
	RaiseRuntimeError(
	 "The maximum value of N is 20." ) ;

{ load data into array }
for x = 1 to N
	begin
	CloseArray[1,x] = x ;
	CloseArray[2,x] = Close[N-x] ;
	end ;

{ sort array ascending by price (Close) }
for x = 1 to N - 1
	begin
	TestValue = CloseArray[2,x] ;
	MinIndex = x ;
	for y = x + 1 to N
		begin
		if TestValue > CloseArray[2,y] then
			begin
			MinIndex = y ;
			TestValue = CloseArray[2,y] ;
			end ;
		end ;

	if MinIndex <> x then
		begin
		Value97 = CloseArray[1,x] ;
		Value98 = CloseArray[2,x] ;
		CloseArray[1,x] = CloseArray[1,MinIndex] ;
		CloseArray[2,x] = CloseArray[2,MinIndex] ;
		CloseArray[1,MinIndex] = Value97 ;
		CloseArray[2,MinIndex] = Value98 ;
		end ;

	end ;

{ compute Spearman's rank correlation for N bars }
absum = 0 ;
for x = 1 to N
	begin
	ab = x - CloseArray[1,x] ;
	ab2 = ab * ab ;
	absum = absum + ab2 ;
	end ;

coefcorr = ( 1 - ( 6 * absum ) /
 ( N * ( N * N - 1 ) ) ) ;
sc = 100 * coefcorr ;
scavg = Average( sc, AvgLen ) ;

if sc crosses over scavg and sc <= OverSoldLevel then
	Buy ( "Spearman LE" ) next bar market ;

if sc crosses below scavg and
 sc >= OverBoughtLevel then
	Sellshort ( "Spearman SE" ) next bar market ;
A sample chart is shown in Figure 1.
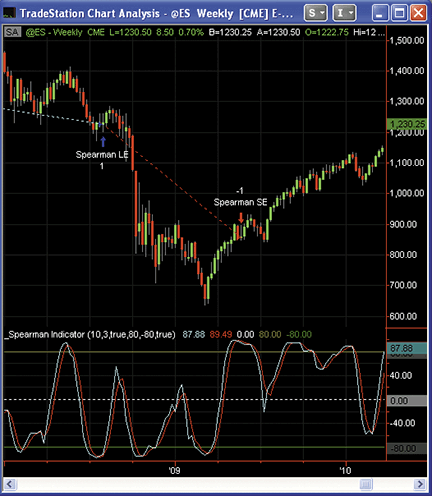
Figure 1: TRADESTATION, SPEARMAN INDICATOR. Here is a sample weekly chart of the S&P 500 emini continuous contract displaying the _Spearman Indicator and the _Spearman Strategy. The cyan plot is the Spearman rank correlation coefficient times 100, and the red plot is the three-bar average of the coefficient.
This article is for informational purposes. No type of trading or investment recommendation, advice, or strategy is being made, given, or in any manner provided by TradeStation Securities or its affiliates.

![]() BLOOMBERG: SPEARMAN INDICATOR
BLOOMBERG: SPEARMAN INDICATOR
We have coded the Spearman indicator for Bloomberg based on the article “The Spearman Indicator For Technical Analysis” by Dan Valcu in this issue.
This indicator uses price ranking as the basis for the indicator to help determine trend intensity and turning points. We have coded the indicator in C# within the new Custom Studies framework, “CS.Net,” which was recently made available to Bloomberg clients. To be able to create custom studies that may be applied to any Bloomberg “G” charts, Bloomberg clients can request permission to access Stdy<GO> by hitting the Help key twice. Stdy<GO> provides access to two types of study-building environments: CS.Lite and CS.Net. CS.Lite presents a proprietary scripting environment for most simple custom studies, while CS.Net creates a template within MS Visual Studio for more advanced programming in C# or Visual Basic.
This code can be used in the CS.Net C# custom study template provided by Bloomberg. Bloomberg code contributions to Traders’ Tips can also be found in the samples file provided with the regular Sdk releases.
SPEARMAN INDICATOR (C#):

using System;
using System.Collections.Generic;
using System.Text;
using System.Drawing;
using Bloomberg.Study.API;
using Bloomberg.Study.CoreAPI;o
using Bloomberg.Study.Util;
using Bloomberg.Study.TA;
using Bloomberg.Math;

namespace SpearmanIndicator
{
    // Spearman Indicator
    //
    //r1 - time series order
    //r11 - price(close)
    //r21 - internal sort table
    //r22 - order of prices (close)
    //This code has been written only to support findings described in this article.
    //It can be modified for improved efficiency.


    public partial class SpearmanIndicator
    {
        //Define user changeable property "Periods"
        public StudyIntegerProperty Periods = new StudyIntegerProperty(10, 5, 200);

        private void Initialize()
        {
            Panels.Add("SpearmanIndicatorPanel", new StudyPanel()); /*Create output panel*/

            //Create indicator output lines and direct their placement to the newly created panel

            Output.Add("SpearmanData", new TimeSeries());
            StudyLine spearmanIndicator = new StudyLine("SpearmanData", Color.DarkCyan);
            spearmanIndicator.Style = LineStyle.Solid;
            spearmanIndicator.Width = 1;
            Panels["SpearmanIndicatorPanel"].Visuals.Add("SpearmanIndicator", spearmanIndicator);

            Output.Add("MovingAverageData", new TimeSeries());
            StudyLine Mavg = new StudyLine("MovingAverageData", Color.Red);
            Mavg.Style = LineStyle.Solid;
            Mavg.Width = 1;
            Panels["SpearmanIndicatorPanel"].Visuals.Add("MovingAverage", Mavg);

        }


        public override void Calculate()
        {
            TimeSeries data = new TimeSeries(Input.Close);
            int count = data.Count;
            int n = Periods.Value;

            // Create an empty TimeSeries for each of our internal tables
            TimeSeries r1 = new TimeSeries(count); //time series order
            TimeSeries r11 = new TimeSeries(count); //price (close)
            TimeSeries r21 = new TimeSeries(count); //internal sort table
            TimeSeries r22 = new TimeSeries(count); //order of prices (close)
            TimeSeries coefcorr = new TimeSeries(count); //Spearman's rank correlation corefficient
            TimeSeries sc = new TimeSeries(count); //correlation coefficient * 100
            TimeSeries avg = new TimeSeries(count); //moving average of correlation coefficient

            //Populate internal tables for n elements
            for (int k = n; k <= count - 1; k++)
            {
                for (int i = n; i >= 1; i--)
                {
                    r1[i] = i;
                    r22[i] = i;

                    r11[i] = data[k - n + i];
                    r21[i] = data[k - n + i];
                } //for

                //Sort internal table r21 descending
                bool changed = true; //this line converted reads as boolean as opposed to 1:0 format
                while (changed)
                {
                    changed = false;
                    for (int i = 1; i <= (n - 1); i++)
                    {
                        if (r21[i + 1] < r21[i])
                        {
                            double temp = r21[i];
                            r21[i] = r21[i + 1];
                            r21[i + 1] = temp;
                            changed = true;
                        }
                    } //for
                } //while

                for (int i = 1; i <= n; i++)
                {
                    bool found = false; //this line converted reads as boolean as opposed to 1:0 format
                    while (!found)
                    {
                        for (int j = 1; j <= n; j++)
                        {
                            if (r21[j] == r11[i])
                            {
                                r22[i] = j;
                                found = true;
                            }
                        } //for
                    } //while
                } //for


                //Compute Spearman's rank correlation coeficient for n bars
                double absum = 0;
                for (int i = 1; i <= n; i++)
                {
                    double ab = r1[i] - r22[i];
                    double ab2 = ab * ab;
                    absum = absum + ab2;
                } //for

                //coefcorr[k]:Spearman's rank correlation coefficient for current bar k
                coefcorr[k] = (1 - (6 * absum) / (n * (n * n-1)));

                // Spearman's rank correlation coefficient multiplied by 100
                sc[k] = 100 * coefcorr[k];

            } //for k

            //compute 3 bar simple moving average
            avg = Indicator.SMAvg(sc, 3);

            //plot indicator lines in bottom panel
            Output.Update("SpearmanData", sc);
            Output.Update("MovingAverageData", avg);
        }
    }

}
A sample chart is shown in Figure 2.
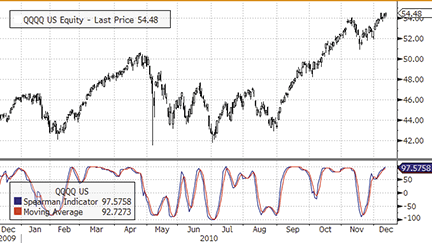
Figure 2: BLOOMBERG, SPEARMAN INDICATOR. Here is a one-year daily QQQQ chart with the Spearman indicator shown in the bottom panel.

![]() eSIGNAL: SPEARMAN INDICATOR
eSIGNAL: SPEARMAN INDICATOR
For this month’s Traders’ Tip, we’ve provided the formula “SpearmanIndicator.efs” based on the code given in Dan Valcu’s article in this issue, “The Spearman Indicator For Technical Analysis.”
The study contains one formula parameter to set the value for the period, which may be configured through the Edit Studies window (Advanced Chart menu→Edit Studies).
To discuss this study or download complete copies of the formula code, please visit the Efs Library Discussion Board forum under the Forums link at www.esignalcentral.com or visit our Efs KnowledgeBase at www.esignalcentral.com/support/kb/efs/. The eSignal formula scripts (Efs) are also available for copying and pasting from the Stocks & Commodities website at Traders.com, or download the Efs here.
/*********************************
Provided By:
    Interactive Data Corporation (Copyright ¬(c) 2010)
    All rights reserved. This sample eSignal Formula Script (EFS)
    is for educational purposes only. Interactive Data Corporation
    reserves the right to modify and overwrite this EFS file with
    each new release.

Description:
    The Spearman Indicator For Technical Analysis

Version:            1.0  10/12/2010

Formula Parameters:                     Default:
    Period                                10


Notes:

    The related article is copyrighted material. If you are not
    a subscriber of Stocks & Commodities, please visit www.traders.com.

**********************************/


var fpArray = new Array();

var bVersion = null;

function preMain()

{

    setStudyTitle("Spearman Indicator");

    setCursorLabelName("Spearman Indicator",0);

    setCursorLabelName("EMA(3)",1);


    setDefaultBarFgColor(Color.RGB(0,148,255),0);

    setDefaultBarFgColor(Color.red,1);


    var x=0;
    fpArray[x] = new FunctionParameter("gPeriod", FunctionParameter.NUMBER);
    with(fpArray[x++])
    {
	setName("Period");
	setLowerLimit(1);
        setDefault(10);
    }

}


var vSC2 = null;

var vSC1 = null;

var vSC = null;

function main(gPeriod)

{

    if ( getCurrentBarCount() - gPeriod < 0 ) return;

    if (getBarState() == BARSTATE_NEWBAR)

    {

        vSC2 = vSC1;

        vSC1 = vSC;

    }


    var r1 = new Array ();

    var r22 = new Array ();

    var r11 = new Array ();

    var r21 = new Array ();

    for ( i=0; i<gPeriod; i++ )

    {

            r1[i] = gPeriod - i;

            r22[i] = gPeriod - i;

            r11[i] = close(i - gPeriod + 1);

            r21[i] = close(i - gPeriod + 1);


            var j = i;

            while (j>0 && j<gPeriod)

            {

                if (r21[j]>r21[j-1])

                {

                    var cBoard = r21[j];

                    r21[j] = r21[j-1];

                    r21[j-1] = cBoard;

                }

                else break;

                j--;

            }

    }


    for( i=0; i<gPeriod; i++)

    {

        var found = 0;

        while ( found < 1 )

        {

            for (j=0; j<gPeriod; j++)

            {

                if (r21[j]==r11[i])

                {

                    r22[i]=j;

                    found=1;

                }

            }

        }

    }


    var absum = 0;

    for ( i=0; i<gPeriod; i++ )

    {

        var ab = r1[i] - r22[i];

        var ab2 = ab*ab;

        absum = absum + ab2;

    }


    var vCoefCorr = (1-(6*absum)/(gPeriod*(gPeriod*gPeriod-1)));

    vSC = vCoefCorr*100;


    if (vSC2 ==null) return new Array(vSC,vSC);


    var vSMA3SC = (vSC+vSC1+vSC2)/3;

    return new Array(vSC, vSMA3SC);


}
A sample chart is shown in Figure 3.
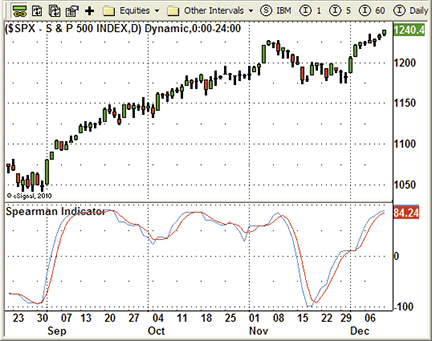
Figure 3: eSIGNAL, SPEARMAN INDICATOR. Here, the Spearman indicator is shown in the bottom panel of a chart of the S&P 500 index.

![]() WEALTH-LAB: SPEARMAN INDICATOR
WEALTH-LAB: SPEARMAN INDICATOR
Wealth-Lab 6 users looking for a way to quickly plot the Spearman indicator on a chart or utilize it in their strategies — either code-based or built interactively with our rule wizard tool — will find the oscillator in the TascIndicator library. To update it to its most recent version, visit our site at www.wealth-lab.com, click “Extensions,” and install the library, or simply get it from the built-in Extension Manager tool. A sample chart is shown in Figure 4.
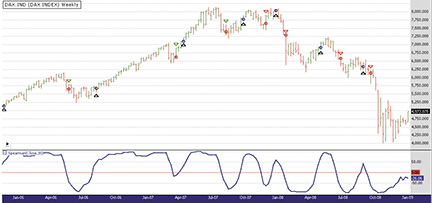
Figure 4: WEALTH-LAB, SPEARMAN INDICATOR. Here is a sample Wealth-Lab Developer 6.1 chart showing the Spearman-based system applied to the DAX 30 index (weekly).
It seems that on daily charts, the Spearman indicator doesn’t appear to be as productive as it could be on higher bar scales (such as weekly), where daily price wiggle is eliminated. The following long-only system illustrates one out of many possible ways to use the indicator: Buy when it crosses zero coming from below, and sell when it crosses zero from above. In our limited testing, zero crossovers outperformed the crossings of the indicator with its short moving average.
C# Code:

using System;
using System.Collections.Generic;
using System.Text;
using System.Drawing;
using WealthLab;
using WealthLab.Indicators;
using TASCIndicators;

namespace WealthLab.Strategies
{
	public class SpearmanDemo : WealthScript
	{
		protected override void Execute()
		{
			Spearman sc = Spearman.Series(Close,10);

			HideVolume();
			ChartPane pane1 = CreatePane(30,false,true);
			PlotSeries(pane1,sc,Color.Blue,LineStyle.Solid,2);
			DrawHorzLine(pane1,0,Color.Red,LineStyle.Dashed,1);

			for(int bar = GetTradingLoopStartBar(10); bar < Bars.Count; bar++)
			{
				// Detect crossover/crossunder and store state in a variable
				bool xover = CrossOver(bar, sc, 0);
				bool xunder = CrossUnder(bar, sc, 0);

				if (IsLastPositionActive)
				{
					if( xunder )
						SellAtMarket(bar + 1, LastPosition);
				}
				else
				{
					if( xover )
						BuyAtMarket(bar + 1);
				}
			}
		}
	}
}

![]() WORDEN BROTHERS STOCKFINDER: SPEARMAN INDICATOR
WORDEN BROTHERS STOCKFINDER: SPEARMAN INDICATOR
The Spearman indicator described in Dan Valcu’s article in this issue (“The Spearman Indicator For Technical Analysis”) is available in the StockFinder v5 indicator library.
You can add the indicator to your chart (Figure 5) by clicking the “Add Indicator/Condition” button or by simply typing “/Spearman” and choosing it from the list of available indicators.
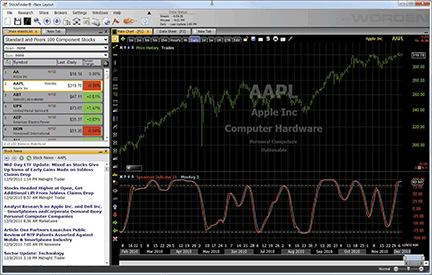
Figure 5: STOCKFINDER, SPEARMAN INDICATOR. Here is a sample implementation of the Spearman indicator with overbought (above 80) and oversold (below -80) levels.
To download the StockFinder software and start a free trial, please visit www.StockFinder.com.

![]() NEUROSHELL TRADER: SPEARMAN INDICATOR
NEUROSHELL TRADER: SPEARMAN INDICATOR
The Spearman indicator described by Dan Valcu in his article in this issue (“The Spearman Indicator For Technical Analysis”) can be easily implemented in NeuroShell Trader using NeuroShell Trader’s ability to call external programs. The programs may be written in C, C++, Power Basic, or Delphi.
After moving the AmiBroker code given in Valcu’s article to your preferred compiler and creating a Dll, you can insert the resulting Spearman indicator as follows:
- Select “New Indicator…” from the Insert menu.
- Choose the External Program & Library Calls category.
- Select the appropriate External Dll Call indicator.
- Setup the parameters to match your Dll.
- Select the Finished button.
Users of NeuroShell Trader can go to the Stocks & Commodities section of the NeuroShell Trader free technical support website to download a copy of this or any previous Traders’ Tips.
A sample chart is shown in Figure 6.
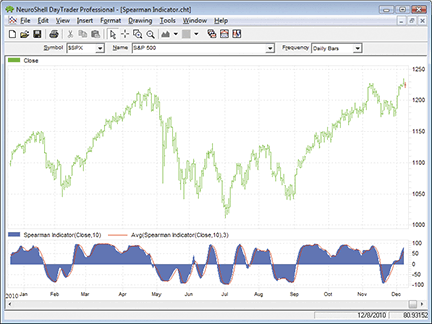
Figure 6: NEUROSHELL TRADER, SPEARMAN INDICATOR. Here is a sample NeuroShell Trader chart displaying the Spearman indicator.

![]() AIQ: SPEARMAN INDICATOR
AIQ: SPEARMAN INDICATOR
Aiq code is provided for two of the indicators discussed in Dan Valcu’s article in this issue, “The Spearman Indicator For Technical Analysis.” Code is provided for the Qstick indicator and the psychological indicators. Aiq code for the Spearman indicator is not provided.
In Figure 7, I show both the Qstick and the psychological indicators on a chart of the S&P 500 Etf (Spy). The code and Eds file can be downloaded from www.TradersEdgeSystems.com/traderstips.htm.
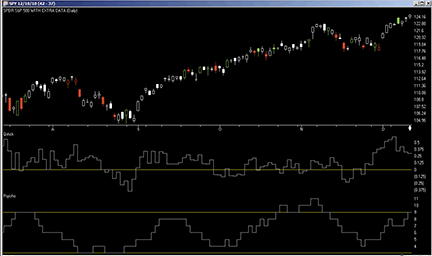
FIGURE 7: AIQ SYSTEMS, QSTICK AND PSYCHOLOGICAL INDICATORS. This sample AIQ chart shows the Qstick and psychological indicators on a chart of the S&P 500 ETF (SPY).
! QSTICK INDICATOR
! PSYCHOLOGICAL LINE INDICATOR
! Article: THE SPEARMAN INDICATOR FOR TECHNICAL ANALYSIS
! Author: Dan Valcu, TASC February 2010
! Coded by: Richard Denning 12/12/2010

!INPUT:
QstickBars is 8.
PsychoBars is 12.

C is [close].
C1 is valresult(C,1).
O is [open].

Qstick is simpleavg(C - O,QstickBars). !Plot

Psycho is countof(C > C1,PsychoBars). !Plot

![]() TRADERSSTUDIO: SPEARMAN INDICATOR
TRADERSSTUDIO: SPEARMAN INDICATOR
The TradersStudio code this month is based on Dan Valcu’s article in this issue, “The Spearman Indicator For Technical Analysis.” I devised a trading system for the S&P 500 futures contract based on the author’s suggestions; however, the author did not provide a system for the Spearman indicator.
The trading rules for this system are as follows:
Enter a long position when:
- The long-term Spearman indicator is greater than zero indicating an uptrend, and
- The short-term Spearman indicator has been greater than the oversold level within the number of bars used to compute the short-term Spearman indicator, and
- The short-term Spearman indicator crosses over a three-bar moving average of itself.
Exit a long position when:
- The long-term Spearman indicator drops below zero, or
- Both the long-term and short-term Spearman indicators are below their three-bar moving average of themselves.
For entry and exits on short positions, use the reverse logic of the long positions.
In Figure 8, I show the resulting equity curve. In Figure 9, I show the resulting underwater equity curve. In Figure 10, I show the year-by-year returns for the system. The return percentages are based on trading one S&P 500 contract with a deposit equal to five times the minimum margin requirement. The total net profit for the period was $296,550 with a maximum drawdown of $68,200.
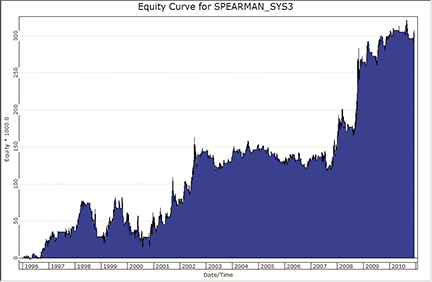
Figure 8: TRADERSSTUDIO, SPEARMAN TRADING SYSTEM. Here is the equity curve for the period 1/1/1996 to 12/10/2010 trading one S&P 500 futures contract.
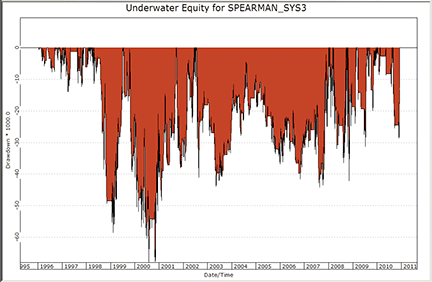
Figure 9: TRADERSSTUDIO, SPEARMAN TRADING SYSTEM DRAWDOWN. Here is the underwater equity curve for the period 1/1/1996 to 12/10/2010 trading one S&P 500 futures contract.
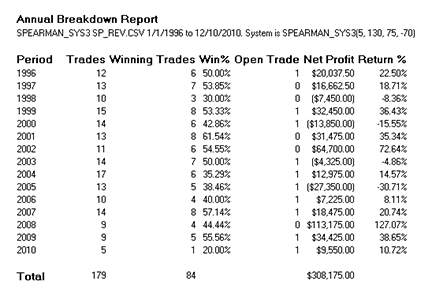
Figure 10: TRADERSSTUDIO, SPEARMAN TRADING SYSTEM. Here is a table showing the yearly returns trading one S&P 500 contract with a deposit of five times the minimum margin.
The code can be downloaded from the TradersStudio website at www.TradersStudio.com→Traders Resources→Traders Tips or www.TradersEdgeSystems.com/traderstips.htm.

![]() NINJATRADER: SPEARMAN INDICATOR
NINJATRADER: SPEARMAN INDICATOR
The Spearman indicator, as discussed in “The Spearman Indicator For Technical Analysis” by Dan Valcu in this issue, has now been implemented as an indicator available for download at www.ninjatrader.com/SC/February2011SC.zip.
Once it has been downloaded, from within the NinjaTrader Control Center window, select the menu File→Utilities→Import NinjaScript and select the downloaded file. This indicator is for NinjaTrader version 7 or greater.
You can review the indicator’s source code by selecting the menu Tools→Edit NinjaScript→Indicator from within the NinjaTrader Control Center window and selecting “Spearman.”
NinjaScript uses compiled Dlls that run native, not interpreted, which provides you with the highest possible performance.
A sample chart implementing the strategy is shown in Figure 11.
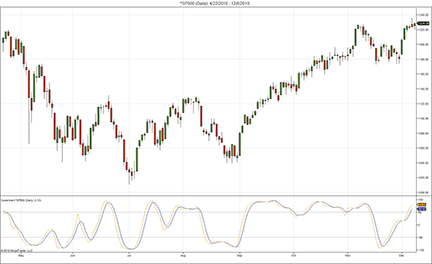
Figure 11: NINJATRADER, SPEARMAN INDICATOR. This screenshot shows the Spearman indicator applied to a daily chart of the S&P 500 index (∧SP500).

![]() WAVE59: SPEARMAN INDICATOR
WAVE59: SPEARMAN INDICATOR
In “The Spearman Indicator For Technical Analysis” in this issue, author Dan Valcu describes the very old statistical tool for measuring trend strength and catching turning points.
The Spearman indicator can be found in our script library at https://www.wave59.com/library. Figure 12 shows the indicator on the emini.
Indicator:  SC_Spearman
input:n(10),upperthresh(80),lowerthresh(-80);
define array r1[];
define array r22[];
define array r11[];
define array r21[];

#load up data arrays
for (i=0 to n by 1)
{
    r1[i]=i;
    r22[i]=i;
    r11[i]=close[n-i];
    r21[i]=close[n-i];
}

#sort
changed=1;
while (changed>0) {
    changed=0;
    for (i=1 to n-1 by 1) {
        if  (r21[i+1]<r21[i]) {
            temp=r21[i];
            r21[i]=r21[i+1];
            r21[i+1]=temp;
            changed=1;
        }
    }
}
for (i=1 to n by 1) {
    found=0;
    while (found<1) {
        for (j=1 to n by 1) {
            if (r21[j] == r11[i]) {
                r22[i]=j;
                found=1;
            }
        }
    }
}


#compute spearman
absum=0;
for (i=1 to n by 1) {
    ab=r1[i]-r22[i];
    ab2=ab*ab;
    absum=absum+ab2;
}
coefcorr=(1-(6*absum)/(n*(n*n-1)));
sc=100*coefcorr;
avg=average(sc,3);

#plot
plot1=sc;
plot2=avg;
color1=blue;
color2=red;
plot3=upperthresh;
plot4=lowerthresh;
plot5=0;
color3,color4,color5=green;
style3,style4,style5=ps_dot;
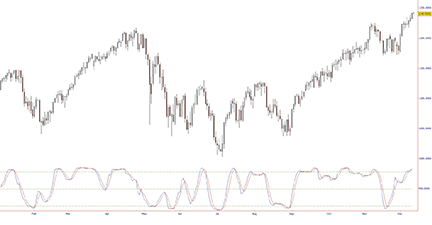
FIGURE 12: WAVE59, SPEARMAN INDICATOR. The Spearman indicator is applied to the emini.

![]() UPDATA: SPEARMAN INDICATOR
UPDATA: SPEARMAN INDICATOR
The Traders’ Tip for this month is based on Dan Valcu’s article in this issue, “The Spearman Indicator For Technical Analysis.”
Valcu creates a simple indicator based on correlation to determine trend strength and potential turning points according to the degree of reordering the printed price sequence arranged in order of size.
The new Updata Professional Version 7 accepts code written in VB.Net and C# in addition to our user-friendly custom code. Versions of this indicator and system in any of these languages may be downloaded by clicking the Custom menu and then System or Indicator Library. Those who cannot access the library due to a firewall may paste the code below into the Updata Custom editor and save it.
int iPeriod = 10;
int iField = 0;
if (dSrc[0].Length>3)
{
iField=3;
}

double[] price = new double[iPeriod];
int[] priceorder = new int[iPeriod];
int[] seriesorder = new int[iPeriod];
double[] sort = new double[iPeriod];
double temp;
int j;
int jj;
int k;

for (int i=iPeriod;i<dRet[0].Length;i++)
{
//Indexes price & position sequence
for (j=0;j<iPeriod;j++)
{
   seriesorder[j]=j;
   priceorder[j] =j;
   price[j]=dSrc[i-iPeriod+j][iField];
   sort[j]=dSrc[i-iPeriod+j][iField];
}

//Sorting Algorithm: Swaps the larger of two values sequentially
//so that largest indexed to end
for (jj=iPeriod-1;jj>0;jj--)
{
for (j=1;j<jj;j++)
{
   if (sort[j+1]<sort[j])
      {
      temp=sort[j];
      sort[j]=sort[j+1];
      sort[j+1]=temp;
      }
}
}

//Replicates indexing
for (j=0;j<iPeriod;j++)
{
   for (k=0;k<iPeriod;k++)
       {
         if (sort[k]==price[j])
            {
             priceorder[j]=k;
            }
       }
}

//Spearman Calculation
int ab;
double absum=0;
for (j=0;j<iPeriod;j++)
{
   ab = priceorder[j]-seriesorder[j];
   absum = absum + (ab*ab);
}

double[] corrcoeff = new double[dRet[0].Length];
double[] spearmancorrel = new double[dRet[0].Length];

corrcoeff[i]=(1-(6*absum)/(iPeriod*((iPeriod*iPeriod)-1)));
spearmancorrel[i]=100*corrcoeff[i];

for (k=0;k<dRet[0][i].Length;k++)
{
dRet[0][i][k]=spearmancorrel[i]; ;
}

}
A sample chart is shown in Figure 13.
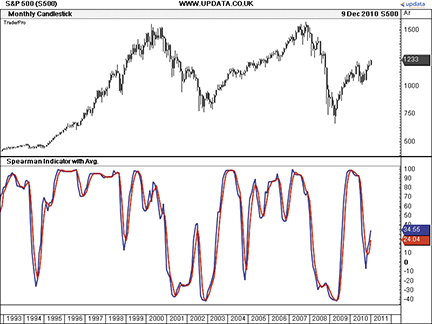
FIGURE 13: UPDATA, SPEARMAN INDICATOR. The chart shows the Spearman indicator with a three-period average overlaid on the S&P 500 index. A clear turning point in 2009 was correctly identified, followed by a year-long trend.

![]() CHARTSY: SPEARMAN INDICATOR
CHARTSY: SPEARMAN INDICATOR
For Windows + Mac + Linux
The Spearman indicator discussed in Dan Valcu’s article in this issue (“The Spearman Indicator For Technical Analysis”) is available in Chartsy in the “Spearman indicator” plugin. To install this plugin, please go to Tools→Plugins→Available Plugins. This plugin is preinstalled in Chartsy v1.4.
You can find the Java source code for the Spearman indicator here.
The indicator properties window for the Spearman indicator is shown in Figure 14a. A sample chart is shown in Figure 14b. To download Chartsy, discuss these tools, and help us develop other tools, please visit our forum at www.chartsy.org. Our development staff will be happy to assist and you can become a Chartsy contributor yourself.
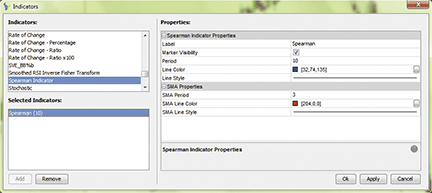
FIGURE 14a: CHARTSY, SPEARMAN INDICATOR. Indicator properties window.
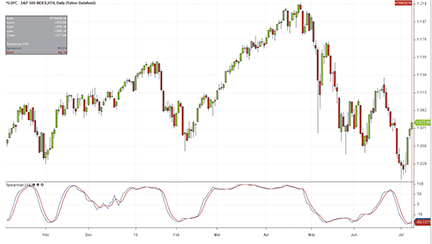
FIGURE 14b: CHARTSY, SPEARMAN INDICATOR. Here is a sample chart of the Spearman indicator.

![]() TRADESIGNAL: SPEARMAN INDICATOR
TRADESIGNAL: SPEARMAN INDICATOR
The Spearman indicator discussed by Dan Valcu in his article in this issue, “The Spearman Indicator For Technical Analysis,” is a prepackaged indicator in TradeSignal known as the rank correlation index (Rci). For this Traders’ Tip, we’ve enhanced the indicator a little with flexible levels and the moving average on top of the normal indicator.
The Spearman indicator can be implemented using TradeSignal’s free interactive online charting tool found at www.TradesignalOnline.com. In the tool, select “New indicator,” enter the code in the online code editor, and save it. The indicator can now be added to any chart with a simple drag & drop (Figure 15). The indicator is also available in the Lexicon section of the website www.TradesignalOnline.com, where it can be imported with a single click.
Meta:
       Synopsis( "The Spearman Indicator calculates the Correlation between
        sorted and unsorted prices of a given time period. The output oscillatoes
         between 100 and -100.
       Extreme Values over 80 or under -80 are warning signals." ),
       ShortCode( "SPI" ),
       Subchart( True ),
       WebLink( "https://www.tradesignalonline.com/lexicon/edit.aspx?id=16177" );

Inputs:
       Price( close ),
       Period( 6, 1, 50 ),
       Trigger( 3 , 1 ),
       Upper_Zone( 80 ),
       Lower_Zone( -80 );


Vars:
       spIndex, triggerIndex;

spIndex = RankCorrelationIndex(Price,Period);
triggerIndex = AverageFC( spIndex, Trigger );

DrawLine( spIndex, "Sp Index" );
DrawLine( triggerIndex, "Trigger", StyleDash );
DrawLine( 0, "Zero", StyleDot );
DrawLine( Upper_Zone, "Upper Zone", StyleDash, 1, Red );
DrawLine( Lower_Zone, "Lower Zone", StyleDash, 1, DarkGreen );

// *** Copyright tradesignal GmbH ***
// *** www.tradesignal.com ***
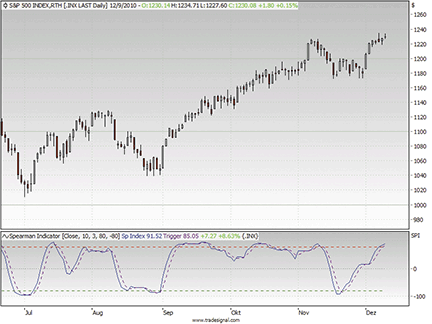
FIGURE 15: TRADESIGNAL ONLINE, SPEARMAN INDICATOR. Here is the Spearman indicator on a daily chart of the S&P 500.

![]() SHARESCOPE: SPEARMAN INDICATOR
SHARESCOPE: SPEARMAN INDICATOR
For the Spearman indicator, the psychological line, and the QStick indicator discussed in Dan Valcu’s article in this issue, “The Spearman Indicator For Technical Analysis,” we’ve provided three individual scripts.
Readers can access these scripts at www.sharescript.co.uk or download them here.
//@Name:Spearman Indicator
//@Description:As described on Stocks & Commodities magazine, February 2011 edition.

var period = 10;
var signal = 3;
function init()
{
	setSeriesColour(0, Colour.Red);
	setSeriesColour(1, Colour.Red);
	setSeriesLineStyle(1, Pen.Dot);
	setTitle("Spearman ("+period+", "+signal+" SMA)");
	setHorizontalLine(-80);
	setHorizontalLine(80);
}

function getGraph(share, data)
{
	var output = [];
	var sma = [];
	var ma1 = new MA(signal);
	var sequence;
	var sum;
	for (var i=period; i<data.length; i++)
	{
		sequence = [];
		sum = 0;
		for (var j=period-1;j>=0;j--)
		{
			sequence[j] = {value:data[i-j].close,rank:period-j};
		}
		sequence.sort(function (a,b){return a.value-b.value});
		for (j=0;j<sequence.length;j++)
		{
			sum += Math.pow(sequence[j].rank-(j+1),2);
		}
		output[i] = (1 - (6 * sum / (period * (Math.pow(period,2)-1)))) * 100;
		sma[i] = ma1.getNext(output[i]);
	}

	return [output,sma];
}


//@Name:Psychological Line
//@Description:As described on Stocks & Commodities magazine, February 2011 edition.

var period = 12;
function init()
{
	setSeriesColour(0, Colour.Red);
	setTitle("Psychological Line ("+period+")");
	setHorizontalLine(9);
	setHorizontalLine(6);
	setHorizontalLine(3);
}
function getGraph(share, data)
{
	var output = [];
	for (var i=0; i<data.length; i++)
	{
		if (i>period)
		{
			output[i] = 0;
			for (var j=0;j<period;j++)
				if (data[i-j].close>data[i-j-1].close) output[i]++;
		}
	}
	return output;
}


//@Name:Qstick
//@Description:Tushar Chande's Qstick. As described on Stocks & Commodities magazine, February 2011 edition.

var period = 8;
function init()
{
	setSeriesColour(0, Colour.Red);
	setTitle("Qstick ("+period+")");
	setHorizontalLine(0);
}
function getGraph(share, data)
{
	var output = [];
	var ma1 = new MA(period, MA.Exponential);
	for (var i=0; i<data.length; i++)
	{
		output[i] = ma1.getNext(data[i].close-data[i].open);
	}
	return output;
}
A sample chart of the Spearman indicator, the psychological line, and the QStick is shown in Figure 16.
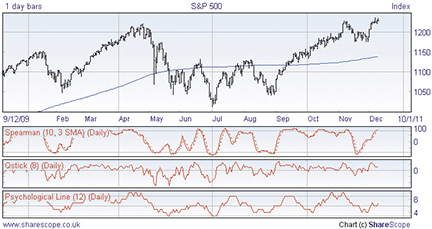
FIGURE 16: SHARESCOPE. The Spearman indicator, psychological line, and QStick indicator are plotted on the S&P 500.

![]() TRADECISION: SPEARMAN INDICATOR
TRADECISION: SPEARMAN INDICATOR
The article by Dan Valcu in this issue, “The Spearman Indicator For Technical Analysis,” demonstrates a statistical tool that helps determine trend strength and turning points, as well as how it can be applied to trading.
Using Tradecision’s Indicator Builder, you can recreate the Spearman indicator using the code we’ve prepared. To import the strategy into Tradecision, visit the area “Traders’ Tips from Tasc Magazine” at www.tradecision.com/support/tasc_tips/tasc_traders_tips.htm or copy the code from below.
Tradecision code:
input
n:"Enter Number of periods:", 10;
price:"Enter the Price:", close;
end_input

var
i:=0;
j:=0;
tmp:=0;
absum:=0;
sqrVal:=0;
dif:=0;
Array:ranks[1000]:=0;
Array:valuesTmp[1000]:=0;
end_var

if HISTORYSIZE < n then return 0;

{Fill Values}
for i:= 1 to n do
begin
     valuesTmp[i]:= price\n-i\;
end;

{Sort Values Descerding}
for i:= 1 to n - 1 do
begin
     for j:= 1 to n - 1 do
     begin
          if valuesTmp[j+1] < valuesTmp[j] then
          begin
               tmp:=valuesTmp[j];
               valuesTmp[j]:=valuesTmp[j+1];
               valuesTmp[j+1]:=tmp;
          end;
     end;
end;

{Sort Ranks using Values}
for i:= 1 to n do
begin
     for j:= 1 to n do
     begin
          if valuesTmp[j] = price\n-i\ then
          begin
               ranks[i] := j;
               j := n + 1;
          end;
     end;
end;

for i:= 1 to n do
begin
    dif := ( n - i + 1 ) - ranks[i];
    sqrVal := dif*dif;
    absum := absum + sqrVal;
end;

return (1 - (6*absum)/ (n*(n*n-1)))*100;
A sample chart of the Spearman indicator is shown in Figure 17.
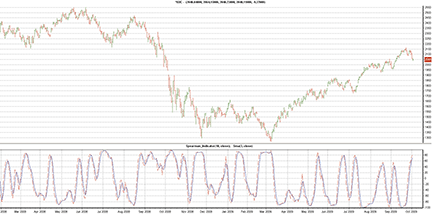
FIGURE 17: TRADECISION, ∧IXIC DAILY CHART WITH THE SPEARMAN INDICATOR. The Spearman indicator and a simple moving average built on the Spearman indicator was calculated from daily NASDAQ composite data.
![]() MICROSOFT EXCEL: SPEARMAN INDICATOR
MICROSOFT EXCEL: SPEARMAN INDICATOR
Microsoft’s Excel spreadsheet application provides many popular statistical functions as part of its built-in list, but the Spearman correlation coefficient and the related Pearson correlation coefficient are not part of this list.
The direct solution is to use the Microsoft Office Visual Basic for Applications (Vba) editor to create a user-defined function (Udf) to perform calculations similar to those defined in the AmiBroker example code provided in Valcu’s article.
In all cases, you will need to allow Excel macros to function, which may also require that you reset the “macro security” settings in your Excel options menu. I suggest using the “notify me” setting, which means that you will be prompted for permission each time you open a spreadsheet that contains macros.
See the notes page of the spreadsheet and the comments section of the Udf for additional details.
The Excel spreadsheet is available here.
If you are not familiar with the Vba editor, open the spreadsheet, then press the Alt and the F11 keys at the same time (Alt-F11) to open the Vba editor.
A sample Excel chart with the Spearman indicator is shown in Figure 18.
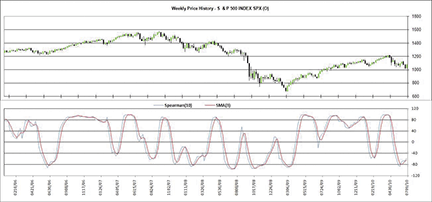
Figure 18: MICROSOFT EXCEL, SPEARMAN INDICATOR. Here is a daily chart of the S&P 500 with a 10-bar Spearman indicator of the close.

![]() AMIBROKER: SPEARMAN INDICATOR — VALCU ARTICLE CODE
AMIBROKER: SPEARMAN INDICATOR — VALCU ARTICLE CODE
It may be possible to use the Spearman coefficient to determine trend intensity and turning points. I wrote a program using AmiBroker to calculate this indicator (see below).
// Spearman indicator:
//
// r1  - time series order
// r11 - price (close)
// r21 - internal sort table
// r22 - order of prices (close)
// This code has been written only to support findings
// described in this article. It can be modified for
// improved efficency.
//
/* Number of periods */
n = Param("Periods: ", 10, 5, 200, 1 );

/* Start loop and computations based on Close */

for( k = n; k <= BarCount-1; k++ )

/* Populate internal tables for n elements */

	{
		r1=0; r11 = 0; r2=0; r21=0; r22=0;
///////////////////////////////////////////////////////////////
  		for(i=n; i>=1; i--)

		{
			r1[i]  = i;
			r22[i] = i;

			r11[i] = Close[k-n+i];
			r21[i] = Close[k-n+i];
		}  // for ...
///////////////////////////////////////////////////////////////
/* Sort internal table r21 descending */

		changed = 1;
		while(changed > 0)
		{
			changed = 0;
      		for(i=1; i<=(n-1); i++)
			{
				if(r21[i+1]<r21[i])
				{
					temp = r21[i];
					r21[i] = r21[i+1];
					r21[i+1] = temp;
					changed = 1;
				}
			}   // for ....

		}   //  while ....
///////////////////////////////////////////////////////////////
      	for(i =1; i<=n; i++)

		{
			found = 0;
			while(found < 1)
			{
				for(j =1; j<=n; j++)
				{
					if(r21[j] == r11[i])

					{
							r22[i] = j;
							found = 1;
					}

				} // for ...
			 }  // while ...

		}   // for ...
///////////////////////////////////////////////////////////////

/* Compute Spearman's rank correlation coeficient for n bars */

		absum=0;

             for(i = 1; i<=n; i++)

		{
			ab   = r1[i] - r22[i];
			ab2 = ab*ab;
			absum = absum+ab2;

		} // for ...

		coefcorr[k] = (1-(6*absum)/(n*(n*n-1)));

/* coefcorr[k]: Spearman's rank correlation coefficient for current bar k */

	sc[k]=100*coefcorr[k];   // multiplied by 100

///////////////////////////////////////////////////////////////

}  // for k.....

//

/* Plot Spearman's rank correlation coefficient multiplied by 100 */

Plot(sc, "Spearman indicator", colorBlue, styleLine);

/* Plot 3-bar simple moving average */

Plot(MA(sc,3), "SMA(3)", colorRed, styleLine);

Title = Date()+ " " + Interval(2) +"  "+  Name()  +"  Spearman("+n+") = " + sc;

/*  end */