July 2008
TRADERS' TIPS
You can copy these formulas and programs for easy use in your spreadsheet or analysis software. Simply "select" the desired text by highlighting as you would in any word processing program, then use your standard key command for copy or choose "copy" from the browser menu. The copied text can then be "pasted" into any open spreadsheet or other software by selecting an insertion point and executing a paste command. By toggling back and forth between an application window and the open Web page, data can be transferred with ease.
This month's tips include formulas and programs for:
WEALTH-LAB: LEADER OF THE MACD
eSIGNAL: LEADER OF THE MACD
AMIBROKER: LEADER OF THE MACD
NEUROSHELL TRADER: LEADER OF THE MACD
STRATASEARCH: LEADER OF THE MACD
OMNITRADER: LEADER OF THE MACD
AIQ: LEADER OF THE MACD
ASPEN RESEARCH: LEADER OF THE MACD
CQG: LEADER OF THE MACD
NEOTICKER: LEADER OF THE MACD
TRADE NAVIGATOR: LEADER OF THE MACD
TRADINGSOLUTIONS: LEADER OF THE MACD
TD AMERITRADE STRATEGYDESK: LEADER OF THE MACD
METATRADER 4.0: LEADER OF THE MACD
NINJATRADER: LEADER OF THE MACD
INVESTOR/RT: LEADER OF THE MACD
TRACK 'N TRADE: LEADER OF THE MACD
TRADESTATION: LEADER OF THE MACD
VT TRADER: LEADER OF THE MACD
or return to July 2008 Contents
Editor's note: This month's Traders' Tips are based on Giorgos Siligardos' article in this issue, "Leader Of The MACD."
For subscribers, code found in Siligardos' article can be copied and pasted into MetaStock or Tradecision from the Subscriber Area at www.Traders.com. Login is required.
Note: The MetaStock and Tradecision code for Giorgos Siligardos' MACD Leader indicator is already provided in sidebars to the article "Leader Of The MACD" in this issue.
WEALTH-LAB: LEADER OF THE MACD
Programming "complex" divergences in Wealth-Lab 5.0 is not complex and can be accomplished in different ways (for example, see the February 2008 Traders' Tips column on trading divergences).
Here, we present an alternative approach to what Giorgos Siligardos outlines in his article in this issue, "Leader Of The MACD." Our version identifies a divergence between price and Siligardos' Leader indicator when it fails to confirm a highest high, in its turn, creating a lower peak. (To save space, the rules are for short trades are not shown but can be easily substituted.)
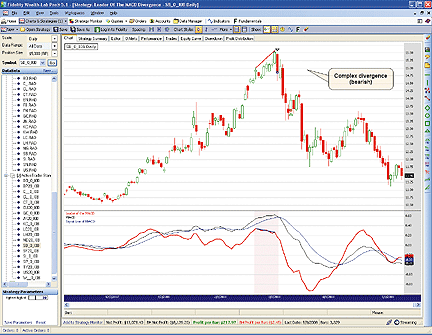
FIGURE 1: WEALTH-LAB, LEADER INDICATOR. Illustrating a short trade in sugar futures, Giorgos Siligardos' Leader indicator helps spot a complex bearish divergence.
Strategy code:
using System;
using System.Collections.Generic;
using System.Text;
using System.Drawing;
using WealthLab;
using WealthLab.Indicators;
namespace WealthLab.Strategies
{
    public class LeaderOfMACD : DataSeries
    {
        public LeaderOfMACD ( Bars bars ) : base(bars,"Leader of the MACD")
        {
            EMACalculation cm = EMACalculation.Modern;
            EMA ema12 = EMA.Series( bars.Close, 12, cm );
            EMA ema26 = EMA.Series( bars.Close, 26, cm );
            DataSeries Indicator1 = ema12 + EMA.Series( bars.Close - ema12, 12, cm );
            DataSeries Indicator2 = ema26 + EMA.Series( bars.Close - ema26, 26, cm );
            for (int bar = FirstValidValue; bar < bars.Count; bar++)
                this[bar] = Indicator1[bar] - Indicator2[bar];
        }
        public static LeaderOfMACD Series( Bars bars )
        {
            LeaderOfMACD _LeaderOfMACD = new LeaderOfMACD( bars );
            return _LeaderOfMACD;
        }
    }
    /*
        Leader of the MACD divergence:
        Price sets a highest high but the indicator fails to confirm and turns down
    */

    public class Leader_Divergence : WealthScript
    {
        private StrategyParameter paramHighest;

        public Leader_Divergence()
        {
            paramHighest = CreateParameter("Highest high of", 20, 5, 50, 1);
        }

        protected override void Execute()
        {
            bool peak = false; int peakBar = -1;
            int high = paramHighest.ValueInt;

            LeaderOfMACD leader = LeaderOfMACD.Series( Bars );
            Highest indicatorHighest = Highest.Series( leader, high );
            Highest hHigh = Highest.Series( High, high );
            MACD macd = new MACD( Close, "MACD" );
            EMA signal = EMA.Series( macd, 9, EMACalculation.Modern );
            macd.Description = "MACD"; signal.Description = "Signal Line of MACD";

            HideVolume(); LineStyle solid = LineStyle.Solid;
            ChartPane leaderPane = CreatePane( 50, false, true );
            PlotSeries( leaderPane, leader, Color.Red, solid, 2 );
            PlotSeries( leaderPane, macd, Color.Black, solid, 1 );
            PlotSeries( leaderPane, signal, Color.Blue, solid, 1 );
            for(int bar = 80; bar < Bars.Count; bar++)
            {
                if (!IsLastPositionActive)
                {
                    /* 1st peak: both price and indicator */

                    if( peak == false )
                    {
                        if( (High[bar-1] == Highest.Series(High, high)[bar-1])
                        & (leader[bar-1] == Highest.Series(leader, high)[bar-1])
                        & TurnDown(bar, High) & TurnDown(bar, leader) )
                        {
                            peak = true; peakBar = bar-1;
                        }
                    }

                    if( peak == true )
                    {
                        if( (High[bar] != Highest.Series( High, high )[bar])
                        & (leader[bar] == Highest.Series( leader, high )[bar]))
                            peak = false;
                    }
                    /* 2nd peak: price high not confirmed by the indicator */
                    if( peak == true )
                    {
                        if((High[bar-1] == Highest.Series( High, high )[bar-1])
                        & (High[bar-1] >= High[peakBar] )
                        & (leader[bar-1] != Highest.Series(leader, high)[bar-1])
                        & ( eader[bar-1] < leader[peakBar]) &
                        TurnDown( bar, High ) & TurnDown(bar, leader) )
                        {
                            peak = false;
                            ShortAtClose( bar );

                            /* Highlight divergence */

                            for (int b = peakBar; b <= bar; b++)
                                SetPaneBackgroundColor( leaderPane, b, Color.FromArgb( 30, Color.LightCoral ) );

                            DrawLine( PricePane, peakBar, High[peakBar],
                                bar-1,High[bar-1], Color.Red, solid,2 );
                            DrawLine( leaderPane, peakBar, leader[peakBar], bar-1,leader[bar-1],Color.Blue,solid,2 );
                        }
                    }
                } else
                {
                    /* Exit after 5 days */

                    Position p = LastPosition;
                    if ( bar+1 - p.EntryBar >= 5 )
                        CoverAtMarket( bar+1, p, "Timed" );
                }
            }
        }
    }
}
--Eugene
www.wealth-lab.com
eSIGNAL: LEADER OF THE MACD
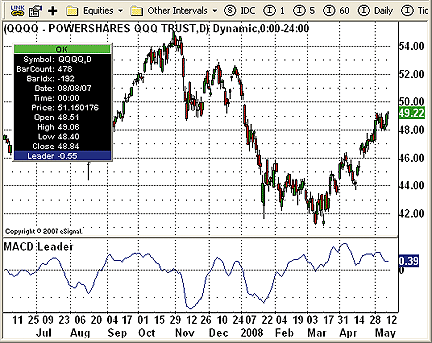
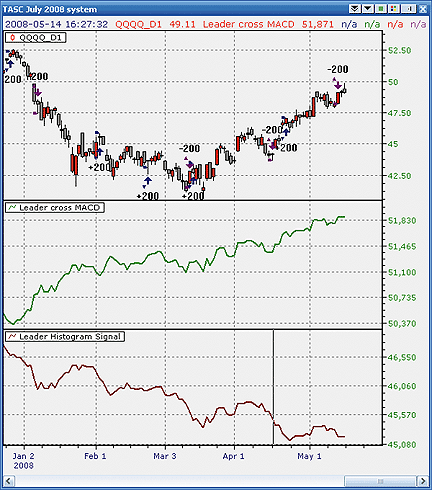
For this month's Traders' Tip, we've provided the formula Macd_Leader.efs based on the formula code from Giorgos Siligardos' article in this issue, "Leader Of The MACD." A sample chart implementation is shown in Figure 2.
To discuss this study or download a complete copy of the formula code, please visit the EFS Library Discussion Board forum under the Forums link at www.esignalcentral.com or visit our EFS KnowledgeBase at www.esignalcentral.com/support/kb/efs/.FIGURE 2: eSIGNAL, MACD LEADER INDICATOR. This eSignal chart shows the MACD Leader indicator on a daily chart of QQQQ.
The eSignal formula scripts (EFS) are also available for copying and
pasting from the STOCKS & COMMODITIES website at Traders.com.
/*********************************
Provided By:
    eSignal (Copyright © eSignal), a division of Interactive Data
    Corporation. 2007. All rights reserved. This sample eSignal
    Formula Script (EFS) is for educational purposes only and may
    be modified and saved under a new file name. eSignal is not
    responsible for the functionality once modified. eSignal
    reserves the right to modify and overwrite this EFS file with
    each new release.

Description:  Leader of the MACD
                    by Giorgos E. Siligardos, PhD
Version:         1.0  5/13/2008
Notes:
* July 2008 Issue of Stocks & Commodities Magazine
* Study requires version 8.0 or later.
**********************************/
function preMain(){
    setStudyTitle("MACD Leader");
    setPriceStudy(false);
    setCursorLabelName("Leader");
}
var bVersion    = null;
var bInit = false;
var xMACDLeader = null;
function main(){
    if (bVersion == null) bVersion = verify();
    if (bVersion == false) return;
    if(bInit == false){
        xMACDLeader = efsInternal("Calc");
        bInit = true;
    }

    var nMACDLeader = xMACDLeader.getValue(0);

    if(nMACDLeader==null) return;

    return nMACDLeader;
}
var xInit = false;
var xMACDSig1 = null;
var xMACDSig2 = null;
var xEMA1 = null;
var xEMA2 = null;
function Calc(){
    if(xInit==false){
        xMACDSig1 = macdSignal(1,12,12);
        xMACDSig2 = macdSignal(1,26,26);
        xEMA1 = ema(12);
        xEMA2 = ema(26);
        xInit = true;
    }

    var nMACDSig1 = xMACDSig1.getValue(0);
    var nMACDSig2 = xMACDSig2.getValue(0);
    var nEMA1 = xEMA1.getValue(0);
    var nEMA2 = xEMA2.getValue(0);

    if(nMACDSig1==null || nMACDSig2==null || nEMA1==null || nEMA2==null) return;

    var Indicator1 = nEMA1+nMACDSig1;
    var Indicator2 = nEMA2+nMACDSig2;

    return Indicator1-Indicator2;
}
function verify() {
    var b = false;
    if (getBuildNumber() < 779) {
        drawTextAbsolute(5, 35, "This study requires version 8.0 or later.",
            Color.white, Color.blue, Text.RELATIVETOBOTTOM|Text.RELATIVETOLEFT|Text.BOLD|Text.LEFT,
            null, 13, "error");
        drawTextAbsolute(5, 20, "Click HERE to upgrade.@URL=https://www.esignal.com/download/default.asp",
            Color.white, Color.blue, Text.RELATIVETOBOTTOM|Text.RELATIVETOLEFT|Text.BOLD|Text.LEFT,
            null, 13, "upgrade");
        return b;
    } else {
        b = true;
    }

    return b;
}
--Jason Keck
eSignal, a division of Interactive Data Corp.
800 815-8256, www.esignalcentral.com
WORDEN BROTHERS BLOCKS: LEADER OF THE MACD
Note: To use the charts and layouts referenced in this article, you will need the free Blocks software. Go to www.Blocks.com to download the software and get detailed information on the available datapacks.
The indicator presented by Giorgos Siligardos in his article in this issue, "Leader Of The MACD," is available in the Blocks Trader indicator library. To load the indicator, click the Indicators button, click on the "SC Traders Tips" folder, then click on "Leader Of The MACD" and drag it onto the chart. (A sample chart is shown in Figure 3.)
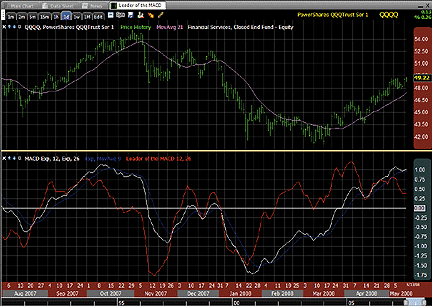
FIGURE 3: BLOCKS, LEADER INDICATOR WITH MACD. Shown here is the Leader of the MACD (red) indicator and the MACD (white) with the nine-period EMA of MACD (blue).
For more information and to view Blocks tutorial videos, go to www.Blocks.com.
-- Patrick Argo and Bruce Loebrich
Worden Brothers, Inc.
AMIBROKER: LEADER OF THE MACD
In "Leader Of The MACD" in this issue, Giorgos Siligardos presents a leading indicator derived from the classic MACD concept. Implementing the Leader indicator in AmiBroker is very easy since it consists of just a few exponential moving averages.
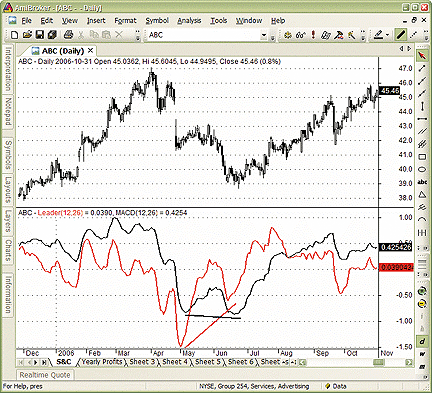
FIGURE 4: AMIBROKER, LEADER. This screen capture shows a daily chart of ABC (upper pane) with the Leader indicator (red) and classic MACD (black) in the bottom pane, replicating the chart from Giorgos Siligardos' article.Listing 1 shows a ready-to-use formula, which can be copied from our website or the STOCKS & COMMODITIES website. To use it, simply enter the code in the AmiBroker Formula Editor, then choose Tools->Apply Indicator menu from the editor. You may use the Parameters window (available from the right-click menu) to adjust the averaging periods. To overlay a standard MACD on the Leader indicator, simply select "MACD" from the Charts window, drag and drop it onto the chart, or choose the "Overlay" option from the Chart window using the right-click menu.
LISTING 1
_SECTION_BEGIN("Leader");
ShortPer = Param("Short avg", 12, 1, 100 );
LongPer = Param("Long avg", 26, 1, 100 );
sEMA = EMA( C, ShortPer );
lEMA = EMA( C, LongPer );
Indicator1 = sEMA + EMA( C - sEMA, ShortPer );
Indicator2 = lEMA + EMA( C - lEMA, LongPer );
Leader = Indicator1 - Indicator2;
Plot( Leader, _DEFAULT_NAME(), colorRed, styleThick );
_SECTION_END();
--Tomasz Janeczko
www.amibroker.com
NEUROSHELL TRADER: LEADER OF THE MACD
The Leader indicator described by Giorgos Siligardos in his article in this issue, "Leader Of The MACD," can be easily implemented in NeuroShell Trader by combining a few of NeuroShell Trader's 800+ indicators. To recreate the Leader indicator, select "New Indicator …" from the Insert menu and set up the following indicators:
Once the indicators are plotted on a chart, they may be visually analyzed as described in Siligardos' article. They may also be built into trading strategies using crossovers of the Leader and MACD to generate trading signals.Indicator1: Add2 ((MACD(Close, 12, 26)), (ExpAvg (Sub (Close, MACD(Close, 12, 26)), 12)) Indicator2: Add2 ((MACD(Close, 12, 26)), (ExpAvg (Sub (Close, MACD(Close, 12, 26)), 26)) Once you've constructed the above indicators, rename them as Indicator1 and Indicator2, respectively. Leader: Subtract (Indicator 1, Indicator 2)
If you have NeuroShell Trader Professional, you can also choose whether the system parameters should be optimized. After backtesting the trading strategies, use the "Detailed Analysis …" button to view the backtest and trade-by-trade statistics for the system.
The sample chart in Figure 5 displays the optimized system equity in blue while the equity for the system with the original parameters is shown by the green line.
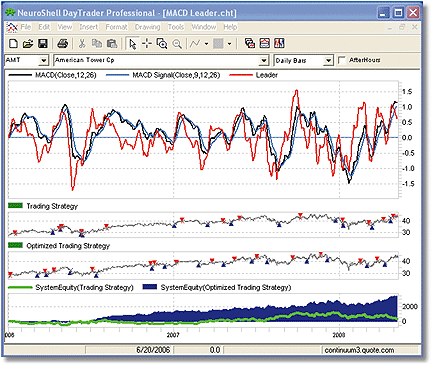
FIGURE 5: NEUROSHELL TRADER, MACD LEADER INDICATOR. Here is a NeuroShell Trader chart showing the MACD Leader. The optimized system equity is shown in blue while the equity for the system with the original parameters is shown by the green line.--Marge Sherald
Ward Systems Group, Inc.
301 662-7950, sales@wardsystems.com
www.neuroshell.com
STRATASEARCH: LEADER OF THE MACD
In "Leader Of The MACD," author Giorgos Siligardos offers two suggestions for implementing buy and sell signals: divergences and crossovers. We decided to test them both to see which might offer the best improvement over the MACD itself.
To run the tests, we used a four-year evaluation period from 2004 to 2007, using a bid/ask spread of 0.04 and commissions of $10.00 on either side. To get a well-diversified test, the idea was to run the two systems against 250 industry groups and see which would be profitable against the higher percentage of them. The crossover system did reasonably well, being profitable for roughly 50% of the industry groups. However, the simple divergence system was profitable for roughly 75% of the industry groups, showing that it may be the more robust method. The divergence settings were based on a 3% divergence in a one-day period.
Both methods showed definite benefits, so both may be worth exploring further. In particular, the use of supporting trading rules may offer some significant benefit, as could the use of alternate parameter sets. The automated search in StrataSearch allows these tests to be performed quickly and easily.
A sample StrataSearch chart is shown in Figure 6.
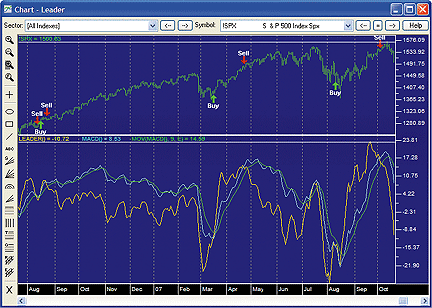
FIGURE 6: STRATASEARCH, MACD LEADER INDICATOR. Crossovers between the Leader and MACD are one option for creating buy and sell signals.As with all other Traders' Tips, additional information, including plug-ins, can be found in the Shared Area of the StrataSearch user forum. This month's plug-in contains a number of prebuilt trading rules that will allow you to include this indicator in your automated searches. Simply install the plug-in and let StrataSearch identify whether there are supporting indicators or alternate parameter sets that might prove helpful.
//***************************************
// Leader Of The MACD
//***************************************
Indicator1 = mov(C,12,E)+mov(C-mov(C,12,E),12,E);
Indicator2 = mov(C,26,E)+mov(C-mov(C,26,E),26,E);
Leader = Indicator1-Indicator2;
--Pete Rast
Avarin Systems Inc
www.StrataSearch.com
OMNITRADER: LEADER OF THE MACD
For Giorgos Siligardos' article in this issue, "Leader Of The MACD," we are providing a new indicator named LeaderOfTheMacd.txt. As stated in the article, the Leader tends to give insight into the future direction of the MACD. Functionally, the Leader seems to perform much like the MACD histogram in many cases. The combination of MACD, MACD histogram, and the LeaderOfTheMacd can provide excellent insight into the current state of the market.
To use the indicator, first copy the file "LeaderOfTheMacd.txt" to the directory C:\Program Files\Nirvana\OT2008\VBA\Indicators. Next, open OmniTrader and click Edit:OmniLanguage. You should see LeaderOfTheMacd in the indicators section of the Project Pane. Click compile. Now the code is ready to use.
A sample OmniTrader chart is shown in Figure 7 comparing the MACD, MACD histogram, and Leader indicators.
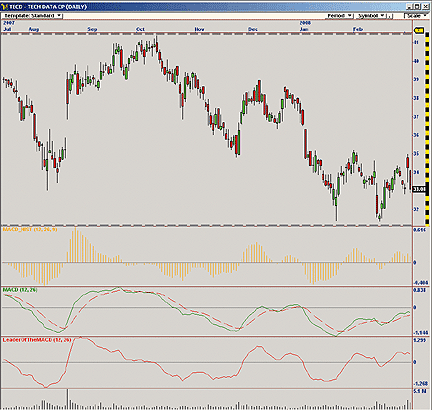
FIGURE 7: OMNITRADER, LEADER OF THE MACD. Here is a daily price chart of Tech Data Corp. [TECD] with the MACD, MACD histogram, and LeaderOfTheMACD indicators plotted.For more information and complete source code, visit https://www.omnitrader.com/ProSI.
#Indicator
'**************************************************************
'*   Leader of the MACD  (LeaderOfTheMACD.txt)
'*     by Jeremy Williams
'*       May 14, 2008
'*
'*    Adapted from Technical Analysis of Stocks & Commodities
'*     July 2008
'*
'*  Summary:
'*
'*      This indicator calculates a oscillator which is used in
'*  conjuction with the traditional MACD indicator. For more
'*  information see "Leader of the MACD" in the July 2008 issue of
'*  Technical Analysis of Stocks & Commodities.
'*
'*  Parameters:
'*
'*  ShortPeriods -  Specifies the number of periods for the fast
'*                    moving average calculation
'*
'*  LongPeriods- Specifies the number of periods for the slow
'*                    moving average calculation
'**************************************************************
#Param "ShortPeriods" , 12
#Param "LongPeriods" , 26
Dim ShortEMA    As Single
Dim ShortDiff    As Single
Dim ShortEMA2    As Single
Dim Indicator1    As Single
Dim LongEMA        As Single
Dim LongDiff    As Single
Dim LongEMA2    As Single
Dim Indicator2    As Single
Dim Leader        As Single
' Calculate the EMA's
ShortEMA      = EMA(ShortPeriods)
LongEMA       = EMA(LongPeriods)
' Calculate the differences between close and the EMA's
ShortDiff     = C - ShortEMA
LongDiff      = C - LongEMA
' Calculate the EMA of the differences
ShortEMA2     = EMA(ShortDiff,ShortPeriods)
LongEMA2      = EMA(LongDiff,LongPeriods)
' Combine the base EMA with the EMA of the differences to
' reduce lag
Indicator1    = ShortEMA + ShortEMA2
Indicator2  = LongEMA + LongEMA2
' Calculate the value of the Leader indicator by differencing
' the two indicators
Leader         = Indicator1 - Indicator2
' Plot the Indicator
Plot("MACDLeader",Leader)
' Return the value calculated by the indicator
Return Leader
--Jeremy Williams, Trading Systems Researcher
Nirvana Systems, Inc.
www.omnitrader.com
www.nirvanasystems.com
AIQ: LEADER OF THE MACD
The AIQ code for Giorgos Siligardos' article in this issue, "Leader Of The MACD," is given here.
I ran simulations using the NASDAQ 100 list of stocks for each of the two mentioned strategies -- crossovers and simple divergences. Exits for the strategies were not discussed by the author in the article. For longs, I exited after 15 days or on a reversing signal, whichever came first. For shorts, I exited after three days or on a reversing signal, whichever came first. I used a relative strength formula descending to select the trades, taking three per day with a maximum of 10 concurrent positions. I started the test period on 3/1/2000, which was the approximate start of a significant bear market for the NASDAQ stocks. The longs were tested separately from the shorts.
In Figure 8, I show a comparison of the equity curves for the longs. The divergence strategy significantly outperformed the crossover strategy and also outperformed all of the major indexes. The divergence strategy also seemed to have survived the sharp bear market of 2000 to 2002. After 2002, the divergence strategy preformed fairly consistently.
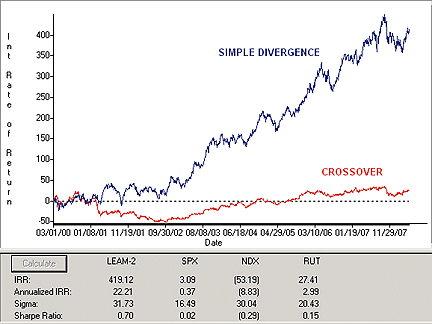
FIGURE 8: AIQ, LONG TRADES. Here is a comparison of the equity curves for the crossover strategy and simple divergence strategy trading the long side only using the NASDAQ 100 list of stocks.In Figure 9, I show a comparison of the equity curves for the shorts. Neither of the strategies was profitable during either the bear or bull markets in the test period. They also underperformed the indexes.
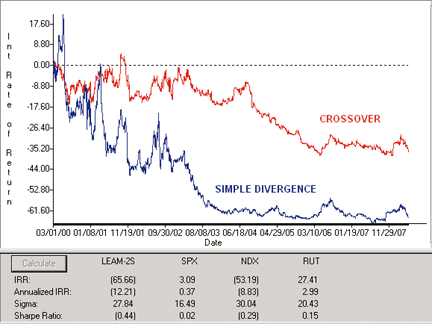
FIGURE 9: AIQ, SHORT TRADES. Here is a comparison of the equity curves for the crossover strategy and simple divergence strategy trading the short side only using the NASDAQ 100 list of stocks.The AIQ code can be downloaded from the AIQ website at www.aiqsystems.com and also from www.tradersedge systems.com/traderstips.htm.
! LEADER OF THE MACD
! Author: Giorgos E. Siligardos, TASC, July 2008
! Coded by: Richard Denning 05/14/08
! MACD AND MACD SIGNAL LINE:
Define S 12.
Define L 26.
Define X 9.
ShortEMA is expavg([Close],S).
LongEMA is expavg([Close],L).
MACD is ShortEMA-LongEMA.
SignalMACD is expavg(MACD,X).
MACDhist is MACD-SignalMACD.
! LEADER
Indicator1 is ShortEMA + expavg([Close]-ShortEMA,S).
Indicator2 is LongEMA + expavg([Close]-LongEMA,L).
Leader is Indicator1 - Indicator2.
SignalLeader is expavg(Leader,X).
LeaderHist is Leader - SignalLeader.
! TEST1: CROSSOVERS-LEADER VS MACD
LE if Leader > MACD and valrule(Leader < MACD,1).
SE if Leader < MACD and valrule(Leader > MACD,1).
LX if {position days} >= 15 or SE.
SX if {position days} >= 3 or LE.
! TEST2: SIMPLE DIVERGENCES-TRADE
!           IN DIRECTION OF LEADER
LEdvg if slope2(Leader,10) > 0 and slope2(MACD,5) < 0.
SEdvg if slope2(Leader,10) < 0 and slope2(MACD,5) > 0.
LXdvg if {position days} >= 15 or SEdvg.
SXdvg if {position days} >= 3 or LEdvg.
--Richard Denning, AIQ Systems
richard.denning@earthlink.net
ASPEN RESEARCH: LEADER OF THE MACD
Giorgos Siligardos' Leader indicator, as described in his "Leader Of The MACD" article in this issue, is easy to recreate in Aspen Graphics.
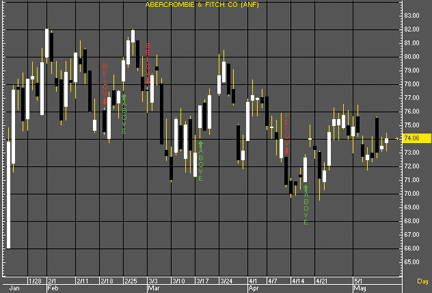
Aspen offers several methods for displaying the results from the Leader, including the actual plotline, Aspen color rules, quote page alerts, and on-chart alerts. Please visit our Aspen User Forums at https://www.aspenres.com/forums/viewtopic.php?f=3&t=21 for the entire list of formulas and a preconfigured page suite that contains custom views of Siligardos' Leader indicator.
The first step in Aspen Graphics is to recreate the root formulas. These formulas will be referenced by all the other formulas. This includes the MACD, signal, and Leader lines. The Leader as well as MACD and signal lines can be plotted directly on a chart.FIGURE 10: ASPEN GRAPHICS, THE LEADER INDICATOR
FIGURE 11: ASPEN GRAPHICS, THE LEADER CROSS ALERTS
FIGURE 12: ASPEN GRAPHICS, THE LEADER COLOR RULE
macd_(series, period1 = 12, period2 = 26) = eavg($1, period1) - eavg($1, period2)
signal_(series, period1 = 12, period2 = 26) = eavg(macd_($1, period1, period2), period1)
Leader(series, period1 = 12, period2 = 26) = begin

    indicator1 =  eavg($1.close, period1) + eavg($1.close - eavg($1.close, period1), period1)

    indicator2 = eavg($1.close, period2) + eavg($1.close - eavg($1.close, period2), period2)
    retval = indicator1 - indicator2
    retval
end
    The LeaderCrossTest formula outputs signals when the Leader crosses the Macd.
leaderCrossTest(series, period1 = 12, period2 = 26)  = begin
        retval = 0

        lead1 = leader($1, period1, period2)[1]
        lead2 = leader($1, period1, period2)
        macd1 = macd_($1, period1, period2)[1]
        macd2 = macd_($1, period1, period2)
        if(lead1 < macd1 and lead2 > macd2)  then retval = 1
        if(lead1 > macd1 and lead2 < macd2) then retval = -1
        retval
end
    For the Leader color rule, we use the results from LeaderCrossTest:
if(leaderCrossTest($1, 12, 26) ==1, clr_green, if(leaderCrossTest($1, 12, 26) == -1, clr_red, clr_yellow))
For a free trial of Aspen Graphics, please contact our sales department
at sales@aspenres.com, 800 359-1121, or visit our website at https://aspenres.com.
--Jeremiah Adams
Aspen Research Group
support@aspenres.com, 800 359-1121
CQG: LEADER OF THE MACD
Here is the CQG custom study definition for the Leader indicator presented by Giorgos Siligardos in his article in this issue, "Leader Of The MACD." Three curves are recreated to match Figure 3 in Siligardos' article. A sample CQG chart is shown in Figure 13.
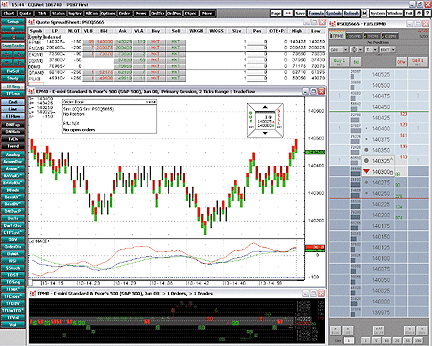
FIGURE 13: CQG, LEADER STUDY. Here is a demonstration of the study applied to a TradeFlow chart.
A CQG component PAC is available at the CQG website (https://www.cqg.com/Support/Downloads.aspx) to install this study in CQG.C1 is called Leader. The formula is: ( MA(@,Exp,12.000)+ MA(( Close(@)- (MA(@,Exp,12.000))),Exp,12.000))- (MA(@,Exp,26.000)+ MA( (Close(@)- MA(@,Exp,26.000)),Exp,26.000)) C2 is called Macd. The formula is: MACD(@,12.000,26.000) C3 is called Signal. The formula is: MACDA(@,12.000,26.000,9.000)
--Thom Hartle
www.CQG.com
NEOTICKER: LEADER OF THE MACD
In "Leader Of The MACD," Giorgos Siligardos presents a new way to calculate MACD, which he names the "Leader" indicator.
In NeoTicker, Leader can be implemented using formula language with two integer parameters (Listing 1). These two parameters will allow the user to adjust the fast and slow periods that the indicator calculation is based on.
To recreate in NeoTicker the Leader histogram as discussed the article's sidebar, no additional coding is needed. Simply add the simple moving average indicator onto the Leader to create the Leader signal line. Next, add the "subtraction" indicator and subtract the leader by the signal line. This will result in the Leader histogram (Figure 14).
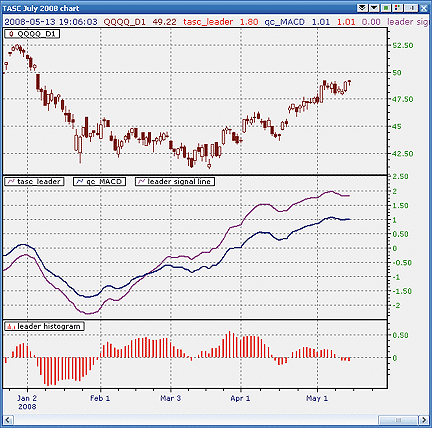
FIGURE 14: NEOTICKER, LEADER HISTOGRAM
There are two crossover signals mentioned in the article and sidebar.
The first one is the MACD crossing the Leader indicator. The second is
the histogram crossing the zero line. These crossover signals can be quickly
tested using the NeoTicker's feature "Backtest EZ" with simple formula
expression (Listing 2) at the long entry and short entry parameter fields.
Backtest EZ by default plots system equity (Figure 15).
FIGURE 15: NEOTICKER. Backtest EZ plots system equity.
All chart groups and indicator code will be available for download
at the NeoTicker blog site (https://blog.neoticker.com).
LISTING 1
$indicator1 := mov(data1,"Exponential",param1) +
               mov(data1-mov(data1,"Exponential",param1),"Exponential",param1);
$indicator2 := mov(data1,"Exponential",param2) +
               mov(data1-mov(data1,"Exponential",param2),"Exponential",param2);
plot1 := $indicator1-$indicator2;
LISTING 2
Leader Cross MACD
Long Entry: xabove (tasc_leader (data1, 12, 26), qc_MACD(data1,12,26,"No",9))
Short Entry: xbelow (tasc_leader (data1, 12, 26), qc_MACD(0,data1,12,26,"No",9))
Leader Histogram Signal
Long Entry: xaboveconst(data2, 0)
Short Entry: xbelowconst(data2, 0)
--Kenneth Yuen, TickQuest Inc.
www.tickquest.com
TRADE NAVIGATOR: LEADER OF THE MACD
Giorgos Siligardos discusses his MACD Leader indicator in "Leader Of The MACD" in this issue. In the article, he states, "The Leader is constructed to provide information about the prospects of MACD."
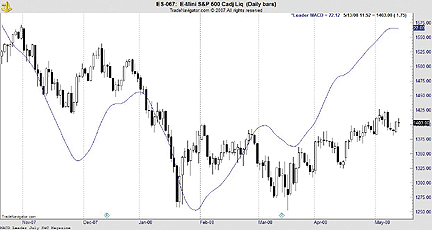
FIGURE 16: TRADE NAVIGATOR, LEADER INDICATOR. Here is an example chart showing the Leader MACD overlaid on the price pane.This indicator can be set up in Trade Navigator by following these steps, or by simply downloading the file "SC0708."
To recreate this indicator in Trade Navigator:
1. Click on the Edit menu and select "Functions."
2. Click "New" to create a new function.
3. Copy and paste the following syntax:
(MovingAvgX (Close , 12 , False) - MovingAvgX (Close - MovingAvgX (Close , 12 , False) , 12 , False))
 - (MovingAvgX (Close , 26 , False) - MovingAvgX (Close - MovingAvgX (Close , 26 , False) , 26 , False))
4. Click Save As and name it "Leader Macd."Now you can apply the indicator to your chart. From the chart menu, choose "Add to chart." Select the Indicators tab. Find "Leader MACD" on the list, highlight it, and click "Add." Figure 16 shows is an example chart with the Leader MACD overlaid on the price pane.
--Dave Kilman
Genesis Financial Technologies, Inc.
www.TradeNavigator.com, www.GenesisFT.com
TRADINGSOLUTIONS: LEADER OF THE MACD
In "Leader Of The MACD," Giorgos Siligardos presents a leading version
of the MACD indicator. This function is described here and is also available
as a function file that can be downloaded from the TradingSolutions website
(www.tradingsolutions.com) in the Free Systems section.
Function Name: MACD Leader
Inputs: Data
Sub (Add (EMA (Data, 12), EMA (Sub (Data, EMA (Data, 12)), 12)),
     Add (EMA (Data, 26), EMA (Sub (Data, EMA (Data, 26)), 26)))
--Gary Geniesse
NeuroDimension, Inc.
800 634-3327, 352 377-5144
www.tradingsolutions.com
TD AMERITRADE STRATEGYDESK: LEADER OF THE MACD
In this issue, Giorgos Siligardos discusses a leading indicator for the MACD. Here, we'll present an interpretation of that using TD Ameritrade's StrategyDesk.
In "Leader Of The MACD," Siligardos discusses a modification of the
existing MACD construction to provide for a leading indicator. He dubs
this the "Leader" indicator. To recreate this as a custom chart indicator
in StrategyDesk, use the following formula:
Siligardos goes on to suggest using crossovers between the Leader and the MACD lines for entry and exit points. The examples in the article make the point that these generally occur before the traditional MACD and signal line crossovers, but not always. The following formulas stipulate this crossover, entering with a buy when the Leader crosses above the MACD and exiting with a sell when the Leader crosses below the MACD. These can be used for either backtesting or program trading.MACD Leader: (ExpMovingAverage[EMA,Close,12,0,D] + MACD[Signal,Close,1,12,12,D]) - (ExpMovingAverage[EMA,Close,26,0,D] + MACD[Signal,Close,1,26,26,D])
Entry (Buy):  ((ExpMovingAverage[EMA,Close,12,0,D] + MACD[Signal,Close,1,12,12,D])
              - (ExpMovingAverage[EMA,Close,26,0,D] + MACD[Signal,Close,1,26,26,D])) > MACD[MACD,Close,12,26,9,D]
              AND MACD[MACD,Close,12,26,9,D,1] > ((ExpMovingAverage[EMA,Close,12,0,D,1]
              + MACD[Signal,Close,1,12,12,D,1]) - (ExpMovingAverage[EMA,Close,26,0,D,1]
              + MACD[Signal,Close,1,26,26,D,1]))
Exit (Sell):  ((ExpMovingAverage[EMA,Close,12,0,D] + MACD[Signal,Close,1,12,12,D])
              - (ExpMovingAverage[EMA,Close,26,0,D] + MACD[Signal,Close,1,26,26,D])) < MACD[MACD,Close,12,26,9,D]
              AND MACD[MACD,Close,12,26,9,D,1] < ((ExpMovingAverage[EMA,Close,12,0,D,1]
              + MACD[Signal,Close,1,12,12,D,1]) - (ExpMovingAverage[EMA,Close,26,0,D,1]
              + MACD[Signal,Close,1,26,26,D,1]))
Some traders employ a strategy with Macd crossing above/below the
zero line. If you are interested in using this same idea with the MACD
Leader, or you are interested in simply adding it as another strategy condition,
the following formulas can be used:
A sample chart is shown in Figure 17.Leader Crosses Above MACD: ((ExpMovingAverage[EMA,Close,12,0,D] + MACD[Signal,Close,1,12,12,D]) - (ExpMovingAverage[EMA,Close,26,0,D] + MACD[Signal,Close,1,26,26,D])) > 0 AND ((ExpMovingAverage[EMA,Close,12,0,D,1] + MACD[Signal,Close,1,12,12,D,1]) - (ExpMovingAverage[EMA,Close,26,0,D,1] + MACD[Signal,Close,1,26,26,D,1])) < 0 Leader Crosses Below MACD: ((ExpMovingAverage[EMA,Close,12,0,D] + MACD[Signal,Close,1,12,12,D]) - (ExpMovingAverage[EMA,Close,26,0,D] + MACD[Signal,Close,1,26,26,D])) < 0 AND ((ExpMovingAverage[EMA,Close,12,0,D,1] + MACD[Signal,Close,1,12,12,D,1]) - (ExpMovingAverage[EMA,Close,26,0,D,1] + MACD[Signal,Close,1,26,26,D,1])) > 0
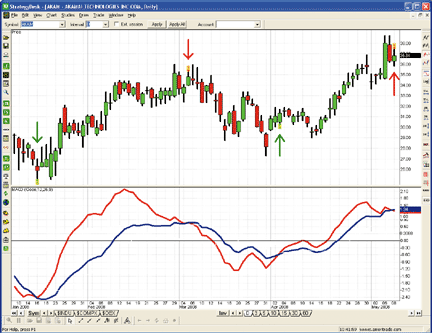
FIGURE 17: TD AMERITRADE, LEADER INDICATOR. The red line in the lower pane represents the Leader, while the blue line represents the MACD. On the price chart, entry signals are shown at the green arrows while the exit signals are shown at the red arrows.If you have questions about this formula or functionality, please call TD Ameritrade's StrategyDesk free help line at 800 228-8056, or access the Help Center via the StrategyDesk application. StrategyDesk is a downloadable application free for all TD Ameritrade clients. Regular commission rates apply.
TD Ameritrade and StrategyDesk do not endorse or recommend any particular trading strategy.
--Jeff Anderson
TD AMERITRADE Holding Corp.
www.tdameritrade.com
METATRADER 4.0: LEADER OF THE MACD
Here is the code to implement Giorgos Siligardos' technique presented
in "Leader Of The MACD" in MetaTrader 4.0.
//+--------
+
//|                                   LeaderMACD.mq4 |
//|                        Copyright © 2008, MistigriFX.com |
//|                                https://www.MistigriFX.com |
//+--------
+
#property copyright "Copyright © 2008, MistigriFX.com"
#property link      "https://www.MistigriFX.com"
#property indicator_separate_window
#property  indicator_buffers 2
#property  indicator_color1  Blue
#property  indicator_color2  Red
//---- indicator parameters
extern int  FastEMA=12;
extern int  SlowEMA=26;
extern int SignalEMA=9;
//---- indicator buffers
double LEADERMACD[];
double     SIGNAL[];
//+--------
+
//| Custom indicator initialization function                         |
//+--------
+
int init()
{
   //---- drawing settings
   SetIndexStyle(0,DRAW_LINE);
   SetIndexStyle(1,DRAW_LINE);
   SetIndexDrawBegin(1,SignalEMA);
   IndicatorDigits(Digits);
   //---- indicator buffers mapping
   SetIndexBuffer(0, LEADERMACD );
   SetIndexBuffer(1, SIGNAL );
   //---- name for DataWindow and indicator subwindow label
   IndicatorShortName("LEADER_MACD("+FastEMA+","+SlowEMA+","+SignalEMA+")");
   SetIndexLabel(0,"LEADERMACD");
   SetIndexLabel(1,"LEADERSignal");
//---- initialization done
   //----
   return(0);
  }
//+--------
+
//| Custom indicator deinitialization function                       |
//+--------
+
int deinit() { return(0); }
//+--------
+
//| Custom indicator iteration function                              |
//+--------
+
int start()
{
   double ArrEMA12[];
   double ArrEMA26[];
   int limit;
   int counted_bars=IndicatorCounted();
   //---- last counted bar will be recounted
   if(counted_bars>0) counted_bars--;
   limit=Bars-counted_bars;

   for(int i=0; i<limit; i++)
   ArrEMA12[i] = Close[i] - iMA(NULL,0,SlowEMA,0,MODE_EMA,PRICE_CLOSE,i);
   ArrEMA26[i] = Close[i] - iMA(NULL,0,FastEMA,0,MODE_EMA,PRICE_CLOSE,i);

   for(    i=0; i<limit; i++)
   LEADERMACD[i]= (( iMA(NULL,0,SlowEMA,0,MODE_EMA,PRICE_CLOSE,i)
                  + iMAOnArray( ArrEMA12, Bars, SlowEMA, 0, MODE_EMA, i ) )
                  - ( iMA(NULL,0,FastEMA,0,MODE_EMA,PRICE_CLOSE,i)
                  + iMAOnArray( ArrEMA26, Bars, FastEMA, 0, MODE_EMA, i ) ) );

   for(i=0; i<limit; i++)
   SIGNAL[i]=iMAOnArray( LEADERMACD,Bars,SignalEMA,0,MODE_EMA,i);

   //---- done
   return(0);
}
//+--------
+
--Patrick Nouvion
www.mistigri.net
NINJATRADER: LEADER OF THE MACD
The Leader indicator as discussed in "Leader Of The MACD" by Giorgos Siligardos in this issue is available for download at www.ninjatrader.com/SC/July2008SC.zip.
Once it's downloaded, from within the NinjaTrader Control Center window, select the menu File > Utilities > Import NinjaScript, and select the downloaded file. This strategy is for NinjaTrader 6.5 or higher.
You can review the indicator's source code by selecting the menu Tools > Edit NinjaScript > Strategy from within the NinjaTrader Control Center window and selecting "Leader." A sample NinjaTrader chart demonstrating the Leader indicator is shown in Figure 18.
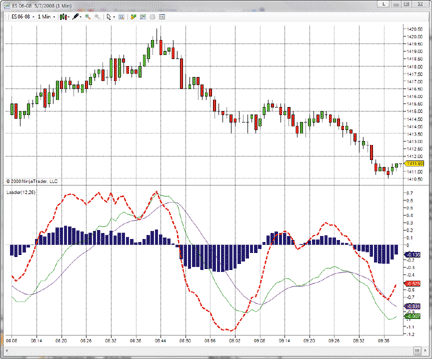
FIGURE 18: NINJATRADER, LEADER INDICATOR & MACD. This NinjaTrader chart shows the Leader indicator in the same panel as the MACD indicator.NinjaScript indicators are compiled DLLs that run native, not interpreted, which provides you with the highest performance possible.
--Raymond Deux, NinjaTrader, LLC
www.ninjatrader.com
INVESTOR/RT: LEADER OF THE MACD
Giorgos Siligardos' Leader indicator can be implemented in Investor/RT
using a custom indicator with the following syntax:
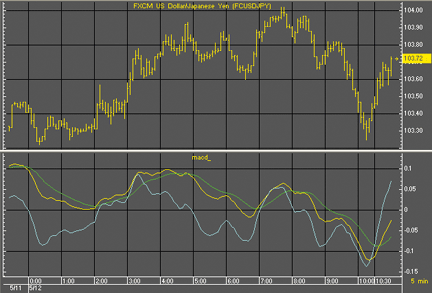
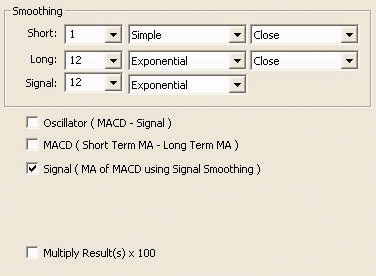
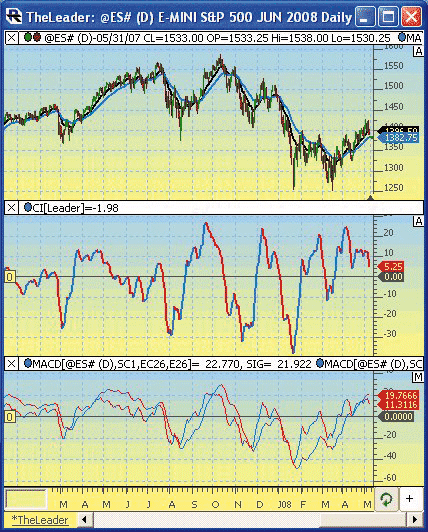
(MA + MACD) - (MA_B + MACD_B)where MA is set up as a 12-period exponential smoothing of the close; MA_B is set up as a 26-period exponential smoothing of the close, and Macd and Macd_B are set up as seen in Figures 19 and 20:
FIGURE 19: INVESTOR/RT, MACD SETUP
The resulting Leader custom indicator can be seen in the second pane of the chart in Figure 21.FIGURE 20: INVESTOR/RT, MACD SETUP
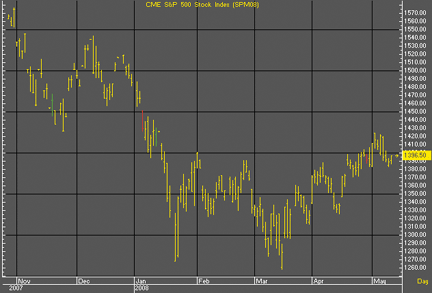
FIGURE 21: INVESTOR/RT, MACD LEADER INDICATOR. Here is a daily chart of the S&P emini futures. The second pane shows the Leader indicator. The third pane shows two MACDs used within the Leader custom indicator.
A video on creating signal markers and custom indicators in Investor/RT can be found at: https://www.linnsoft.com/videos/. More information on Investor/RT's implementation of the MACD indicator can be found at https://www.linnsoft.com/tour/techind/macd.htm.
--Chad Payne, Linn Software
info@linnsoft.com, www.linnsoft.com
TRACK 'N TRADE: LEADER OF THE MACD
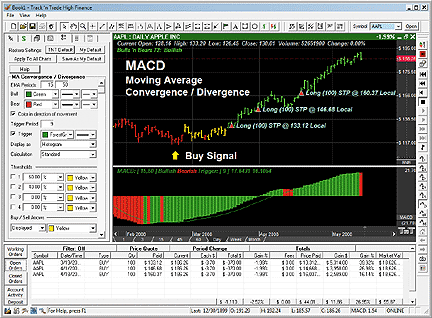
Within Track 'n Trade, computing the MACD indicator requires the use of exponential moving averages. Exponential moving averages are different than simple moving averages in the sense that instead of looking at only the last few days and averaging them, the exponential moving averages look at all the prices where the output is weighed more heavily toward the most recent data. This type of weighted average gives a smoother average price that reacts quickly to market moves.
Within Track 'n Trade, the two averages of MACD move above and below a baseline, which gives an indication of the strength of the current move. This placement of the two averages in relationship to the baseline is calculated by looking at the exponential moving average of the difference between the two averages. Even though the two averages may cross, the divergence, or true indication of the signal, is not shown until both averages cross the baseline.
In this study, the oscillator is the simple difference between the first two exponential moving averages. Track 'n Trade uses the following formula to calculate the MACD:
The second part of the study computes an exponential moving average of the oscillator:OSCt = (EMA1 - EMA2) OSCt: The oscillator for the current period. EMA1: The first exponential moving average. EMA2: The second exponential moving average.
Since the second value, EMAosct, is an exponential moving average, it rises and falls slower than the oscillator, and the two lines generate crossover points. These crossover points are the buy/sell signals. A sample chart is in Figure 22.EMAosct = EMAosct-1+ (k x (OSCt - EMAosct-1)) EMAosct: The exponential moving average of the oscillator. OSCt: The oscillator for the current interval. EMAosct-1: The exponential moving average of the oscillator for the previous interval. k: The exponential smoothing constant.
FIGURE 22: TRACK 'N TRADE, MACDIf the study is displayed as a histogram, each value for the lines is calculated as follows:
DIFFt = OSCt - EMAosct
DIFFt:   The difference between the oscillator for the current interval and the exponential moving
         average of the oscillator.
OSCt:    The oscillator for the current interval.
EMAosct: The exponential moving average of the oscillator.
--Lan H. Turner
Gecko Software, Inc.
www.GeckoSoftware.com
TRADESTATION: LEADER OF THE MACD
Giorgos Siligardos' article in this issue, "Leader Of The MACD," reviews utilization of the moving average convergence-divergence indicator (MACD), and adapts its formula to produce a derivative indicator called "Leader" and another indicator, a "signal line" for Leader. EasyLanguage code that plots both lines is provided here. A sample chart can be seen in Figure 23.
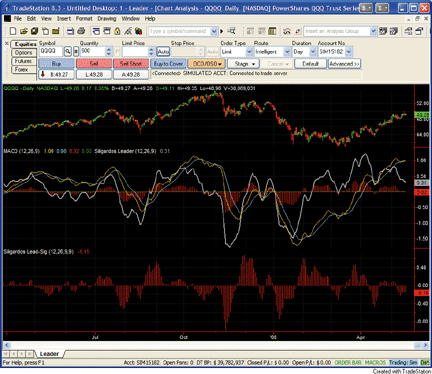
FIGURE 23: TRADESTATION, LEADER INDICATOR & MACD. Here is an example of the Siligardos Leader indicator overlaid on a traditional MACD indicator (middle subgraph) and the Siligardos Leader minus the Siligardos Leader signal line (lower subgraph). Both studies are applied here to a daily chart of symbol QQQQ.To download the EasyLanguage code for these studies, go to the TradeStation and EasyLanguage Support Forum (https://www.tradestation.com/Discussions/forum.aspx? Forum_ID=213). Search for the file "SiligardosLeader.Eld."
TradeStation does not endorse or recommend any particular strategy.
Indicator:  Siligardos Leader
inputs:
    FastLength( 12 ),
    SlowLength( 26 ) ;
variables:
    VarPopLen( 0 ),
    FastXMAValue( 0 ),
    XMAFastPlusDiff( 0 ),
    SlowXMAValue( 0 ),
    XMASlowPlusDiff( 0 ),
    Lead( 0 ) ;
if CurrentBar = 1 then
    VarPopLen = MaxList( FastLength, SlowLength ) ;
FastXMAValue = XAverage( Close, FastLength ) ;
XMAFastPlusDiff = FastXMAValue + XAverage( Close -
 FastXMAValue, FastLength ) ;
SlowXMAValue = XAverage( Close, SlowLength ) ;
XMASlowPlusDiff = SlowXMAValue + XAverage( Close -
 SlowXMAValue, SlowLength ) ;
Lead = XMAFastPlusDiff - XMASlowPlusDiff ;
if CurrentBar > VarPopLen then
    Plot1( Lead, "Leader" ) ;
Indicator:  Siligardos Lead-Sig
inputs:
    FastLength( 12 ),
    SlowLength( 26 ),
    SignalLength( 9 ) ;
variables:
    VarPopLen( 0 ),
    FastXMAValue( 0 ),
    XMAFastPlusDiff( 0 ),
    SlowXMAValue( 0 ),
    XMASlowPlusDiff( 0 ),
    Lead( 0 ),
    Signal( 0 ) ;
if CurrentBar = 1 then
    VarPopLen = MaxList( FastLength, SlowLength ) +
      SignalLength ;
FastXMAValue = XAverage( Close, FastLength ) ;
XMAFastPlusDiff = FastXMAValue + XAverage( Close -
 FastXMAValue, FastLength ) ;
SlowXMAValue = XAverage( Close, SlowLength ) ;
XMASlowPlusDiff = SlowXMAValue + XAverage( Close -
 SlowXMAValue, SlowLength ) ;
Lead = XMAFastPlusDiff - XMASlowPlusDiff ;
Signal = Lead - XAverage( Lead, SignalLength ) ;
if CurrentBar > VarPopLen then
    Plot1( Signal, "Signal" ) ;
--Mark Mills
TradeStation Securities, Inc.
A subsidiary of TradeStation Group, Inc.
www.TradeStation.com
VT TRADER: LEADER OF THE MACD
Giorgos Siligardos' article in this issue, "Leader Of The MACD," begins by describing the origins of the classic MACD indicator, its uses (and shortcomings) as a trend indicator, and its construction. Siligardos goes on to discuss the merits of smoothing an indicator while reducing its lag and provides the "zero-lag" moving average as an example. Siligardos then introduces a similar lag-reducing, smoothing method that can be applied to the classic MACD indicator, thereby creating a new indicator called the Leader. Finally, Siligardos describes the characteristics of the Leader indicator and potential uses for it. Some of the uses mentioned are the identification of simple divergences as well as crossovers between the Leader and the MACD.
We'll be offering the Leader indicator for download in our user forums. The VT Trader code and instructions for creating Siligardos' Leader indicator are as follows:
The Leader Indicator
1. Navigator Window>Tools>Indicator Builder>[New] button
2. In the Indicator Bookmark, type the following text for each field:
Name: TASC - 07/2008 - The Leader Indicator
Short Name: vt_Leader
Label Mask: TASC - 07/2008 - The Leader Indicator (%Sh%,%Lg%,%pr%,%mat%) | MACD: %_MACD%, Leader: %Leader%
Placement: New Frame
Inspect Alias: Leader
3. In the Input Bookmark, create the following variables:
[New] button... Name: Sh , Display Name: Short MA Periods , Type: integer , Default: 12
[New] button... Name: Lg , Display Name: Long MA Periods , Type: integer , Default: 26
[New] button... Name: pr , Display Name: Short/Long MA Price , Type: price , Default: close
[New] button... Name: mat , Display Name: Short/Long MA Type , Type: MA Type , Default: Exponential
4. In the Output Bookmark, create the following variables:
[New] button...
Var Name: Leader
Name: (Leader)
Line Color: blue
Line Width: slightly thicker
Line Type: solid
[New] button...
Var Name: _MACD
Name: (MACD)
Line Color: red
Line Width: slightly thicker
Line Type: solid
5. In the Horizontal Line Bookmark, create the following variables:
[New] button...
Value: +0.0000
Color: black
Width: thin
Type: dashed
6. In the Formula Bookmark, copy and paste the following formula:
{Provided By: Visual Trading Systems, LLC & Capital Market Services, LLC (c) Copyright 2008}
{Description: The Leader Indicator}
{Notes: T.A.S.C., July 2008 - "Leader of the MACD" by Giorgos E. Siligardos, PhD}
{vt_Leader Version 1.0}
{MACD}
ShortMA:= mov(pr,Sh,mat);
LongMA:= mov(pr,Lg,mat);
_MACD:= ShortMA - LongMA;
{The Leader Indicator}
Indicator1:= ShortMA + mov((pr-ShortMA),Sh,mat);
Indicator2:= LongMA + mov((pr-LongMA),Lg,mat);
Leader:= Indicator1 - Indicator2;
7. Click the "Save" icon to finish building the Leader indicator.
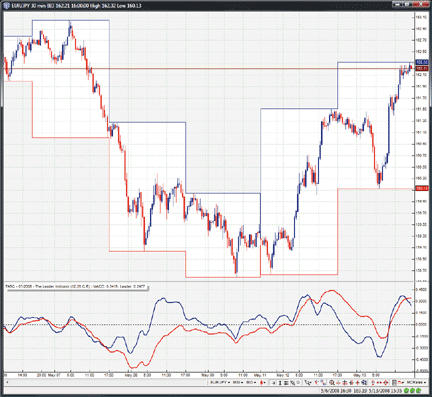
To attach the indicator to a chart, click the right mouse button within the chart window and select "Add Indicator" -> "TASC - 07/2008 ? The Leader Indicator" from the indicator list. See Figure 24 for an example.
To learn more about VT Trader, please visit www.cmsfx.com.
FIGURE 24: VT TRADER, LEADER INDICATOR. Here is the Leader indicator on a EUR/JPY 30-minute candle chart.
? Chris Skidmore. CMS Forex
(866) 51-CMSFX, trading@cmsfx.com
www.cmsfx.com
