CHARTING
The Best Of Both Worlds
In this fifth part of our article series on indicator rules for a swing trading strategy (IRSTS), we will introduce an oscillator based on Percent B.
You’re probably familiar with the Percent b (%b, or PB) oscillator that was developed by John Bollinger — it’s derived from the Bollinger Bands indicator. Here’s how it works: When the price touches the upper Bollinger Band, then the oscillator hits 100. If price moves above the upper band, the oscillator moves to +100. When the price touches the lower Bollinger Band, then the oscillator hits zero, and if price moves below the lower band, the oscillator moves to a negative value.
Here’s how it’s calculated:
Percent b = (Closing price − Lower band) /
(Upper band − Lower band) * 100
BASIC CALCULATION
When I created my zero-lag oscillator (SVEZLRBPercB), which is based on the Percent b, I used the same basic formula as the Percent b. However, before applying the formula, I manipulated the input data I used.
In a July 1997 Stocks & Commodities article, Mel Widner introduced rainbow charts, which is the technique I used to convert the closing price data to a “rainbow” data series and give some extra weight for the less-smoothed data:
rainbow_value =
(5 * SMA(2)[0] +
4 * SMA(SMA(2), 2)[0] +
3 * SMA(SMA(SMA(2), 2), 2)[0] +
2 * SMA(SMA(SMA(SMA(2), 2), 2), 2)[0] +
SMA(SMA(SMA(SMA(SMA(2), 2), 2), 2), 2)[0] +
SMA(SMA(SMA(SMA(SMA(SMA(2), 2), 2), 2), 2), 2)[0] +
SMA(SMA(SMA(SMA(SMA(SMA(SMA(2), 2), 2), 2), 2), 2), 2)[0] +
SMA(SMA(SMA(SMA(SMA(SMA(SMA(SMA(2), 2), 2), 2), 2), 2), 2), 2)[0] +
SMA(SMA(SMA(SMA(SMA(SMA(SMA(SMA(SMA(2), 2), 2), 2), 2), 2), 2), 2), 2)[0] +
SMA(SMA(SMA(SMA(SMA(SMA(SMA(SMA(SMA(SMA(2), 2), 2), 2), 2), 2), 2), 2), 2), 2)[0]) / 20;
rainbow.Set(rainbow_value);
Next, I averaged this new rainbow data series with an exponential moving average (EMA) by applying a zero-lag method. The idea of smoothing data with less lag and zero-lag techniques was proposed by Patrick Mulloy in the February 1994 issue of Stocks & Commodities and by John Ehlers in the March 2000 issue. The technique compensates for the lag in moving averages.
Here’s how I created the new data series ZLRB (zero-lag rainbow):
EMA1.Set(EMA(rainbow, smooth)[0]);
EMA2.Set(EMA(EMA1, smooth)[0]);
diff = EMA1[0] - EMA2[0];
ZLRB.Set(EMA1[0] + diff);
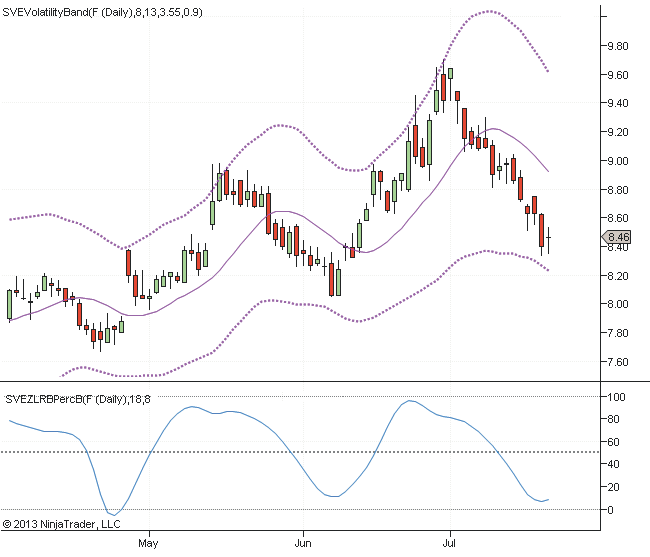
FIGURE 1: MODIFIED PERCENT B OSCILLATOR. This indicator is a fast-moving oscillator and is often a leading indicator.