TRADERS’ TIPS
September 2013

For this month’s Traders’ Tips, the focus is Sylvain Vervoort’s article in this issue, “Oscillators, Smoothed.” Here we present the September 2013 Traders’ Tips code with possible implementations in various software.
Code for NinjaTrader is already provided in Vervoort’s article. Subscribers will find that code at the Subscriber Area of our website, www.traders.com. (Click on “Article Code” from the S&C menu.) Presented here is an overview of possible implementations for other software.
Traders’ Tips code is provided to help the reader implement a selected technique from an article in this issue. The entries are contributed by various software developers or programmers for software that is capable of customization.

TRADESTATION: SEPTEMBER 2013 TRADERS’ TIPS CODE
In “Oscillators, Smoothed” in this issue, author Sylvain Vervoort describes a zero-lag oscillator (SVEZLRBPercB) for which the calculation was based on the Percent b oscillator. Vervoort also introduces a slow stochastic oscillator that is overlaid onto his modified Percent b.
Provided here is the EasyLanguage code for Vervoort’s oscillator based on the NinjaTrader code provided in the article. To download the EasyLanguage code, please visit our TradeStation and EasyLanguage support forum. The code can be found here: https://www.tradestation.com/TASC-2013. The ELD filename is “_TASC_SVEZLRPercB.ELD.”
_TASC_SVEZLRBPercB (Indicator)
{ TASC - Sep, 2013 }
{ Oscillators, Smoothed }
{ Sylvain Vervoort }

inputs:
	StdDevPeriod( 18 ),
	Smooth( 3 ),
	PeriodK( 30 ),
	SmoothK( 3 ) ;

variables:
	SMAValue1( 0 ),
	SMAValue2( 0 ),
	SMAValue3( 0 ),
	SMAValue4( 0 ),
	SMAValue5( 0 ),
	SMAValue6( 0 ),
	SMAValue7( 0 ),
	SMAValue8( 0 ),
	SMAValue9( 0 ),
	SMAValue10( 0 ),
	Rainbow_Value( 0 ),
	diff( 0 ),
	EMA1( 0 ),
	EMA2( 0 ),
	ZLRB( 0 ),
	TemaZLRB( 0 ),
	SdevTEMAZLRB( 0 ),
	WMATEMAZLRB( 0 ),
	ZLRBPercentB( 0 ),
	RBC( 0 ),
	Nom( 0 ),
	Den( 0 ),
	Fast_K( 0 ),
	K( 0 ) ;

SMAValue1 = Average( Close, 2 ) ;
SMAValue2 = Average( SMAValue1, 2 ) ;
SMAValue3 = Average( SMAValue2, 2 ) ;
SMAValue4 = Average( SMAValue3, 2 ) ;
SMAValue5 = Average( SMAValue4, 2 ) ;
SMAValue6 = Average( SMAValue5, 2 ) ;
SMAValue7 = Average( SMAValue6, 2 ) ;
SMAValue8 = Average( SMAValue7, 2 ) ;
SMAValue9 = Average( SMAValue8, 2 ) ;
SMAValue10 = Average( SMAValue9, 2) ;

Rainbow_Value = ( 5 * SMAValue1 + 4 * SMAValue2
+ 3 * SMAValue3 + 2 * SMAValue4 + SMAValue5 + SMAValue6
+ SMAValue7 + SMAValue8 + SMAValue9 + SMAValue10 ) / 20 ;

EMA1 = XAverage( Rainbow_Value, Smooth ) ;
EMA2 = XAverage( EMA1, Smooth ) ;
diff = EMA1 - EMA2 ;
ZLRB = EMA1 + diff ;

TemaZLRB = _TEMA( ZLRB, Smooth ) ;
SdevTEMAZLRB = StdDev( TemaZLRB, StdDevPeriod ) ;
WMATEMAZLRB = WAverage( TemaZLRB, StdDevPeriod ) ;
ZLRBPercentB = ( TemaZLRB + (2 * SdevTEMAZLRB )
	- WMATEMAZLRB ) / ( 4 * SdevTEMAZLRB ) * 100 ;

RBC = ( Rainbow_Value + TypicalPrice ) / 2 ;
Nom = RBC - Lowest( Low, PeriodK ) ;
Den = Highest( High, PeriodK ) - Lowest( RBC, PeriodK ) ;

Fast_K = iff( Den < >  0, MinList( 100,
MaxList(0,  ( 100 * Nom / Den ) ) ), Fast_K[1] ) ;

K = Average( Fast_K, SmoothK ) ;

Plot1( ZLRBPercentB, "ZLRBPctB" ) ;
Plot2( K, "K Line" ) ;
Plot3( 100, "100 Line" );
Plot4( 50, "50 Line" ) ;
Plot5( 0, "0 Line" ) ;
For general information about EasyLanguage programming, see https://www.tradestation.com/EL-FAQ.
A sample chart is shown in Figure 1.
FIGURE 1: TRADESTATION. Here is a daily chart of Ford (F) with the oscillator described in Vervoort’s article in this issue applied to the chart.
This article is for informational purposes. No type of trading or investment recommendation, advice, or strategy is being made, given, or in any manner provided by TradeStation Securities or its affiliates.
—Doug McCrary
TradeStation Securities, Inc.
www.TradeStation.com
BACK TO LIST

METASTOCK: SEPTEMBER 2013 TRADERS’ TIPS CODE
In “Oscillators, Smoothed” in this issue, which is the fifth part of an ongoing series on indicator rules for a swing trading strategy (IRSTS), author Sylvain Vervoort introduces two variations on existing oscillators. He describes his take on John Bollinger’s %b as well as on the stochastic oscillator. The MetaStock code for these formulas is shown below.
Sylvain Vervoort's %b

smooth:= 3;
stdper:= 18;
rv1:= Mov(C,2,S);
rv2:= Mov(rv1,2,S);
rv3:= Mov(rv2,2,S);
rv4:= Mov(rv3,2,S);
rv5:= Mov(rv4,2,S);
rv6:= Mov(rv5,2,S);
rv7:= Mov(rv6,2,S);
rv8:= Mov(rv7,2,S);
rv9:= Mov(rv8,2,S);
rval:=((5*rv1)+(4*rv2)+(3*rv3)+(2*rv4)+
rv5+rv6+rv7+rv8+rv9+Mov(rv9,2,S))/20;
ema1:= Mov(rval,smooth,E);
diff:= ema1-Mov(ema1,smooth,E);
zlrb:= ema1-diff;
center:= Tema(zlrb,smooth);
(center + 2*Stdev(center,stdper) - Mov(center,stdper,W))/
(4*Stdev(center,stdper))*100


Sylvain Vervoort's Stochastic Oscillator

kp:=30;
ksp:=3;
rv1:= Mov(C,2,S);
rv2:= Mov(rv1,2,S);
rv3:= Mov(rv2,2,S);
rv4:= Mov(rv3,2,S);
rv5:= Mov(rv4,2,S);
rv6:= Mov(rv5,2,S);
rv7:= Mov(rv6,2,S);
rv8:= Mov(rv7,2,S);
rv9:= Mov(rv8,2,S);
rval:=((5*rv1)+(4*rv2)+(3*rv3)+(2*rv4)+
rv5+rv6+rv7+rv8+rv9+Mov(rv9,2,S))/20;
rbc:= (rval+Typical())/2;
temp:= HHV(H,kp)-LLV(rbc,kp);
denom:= If(temp=0, -1, temp);
fastk:=If(temp= -1, 50, ((rbc-LLV(L,kp))/denom)*100);
fastk;
Mov(fastk,ksp,S)
—William Golson
MetaStock Technical Support
www.metastock.com
BACK TO LIST

eSIGNAL: SEPTEMBER 2013 TRADERS’ TIPS CODE
For this month’s Traders’ Tip, we’ve provided the formula SVEZLPercB.efs based on the formula code from Sylvain Vervoort’s article in this issue, “Oscillators, Smoothed.”
The study contains formula parameters to set the values for the Percent b deviation period, Percent b average, stochastic period, and stochastic slowing, which may be configured through the edit chart window (right-click on chart and select “Edit chart”).
To discuss this study or download a complete copy of the formula code, please visit the EFS Library Discussion Board forum under the forums link from the support menu at www.esignal.com or visit our EFS KnowledgeBase at https://www.esignal.com/support/kb/efs/. The eSignal formula scripts (EFS) are also shown below and are available for download here.
/*********************************
Provided By:
    Interactive Data Corporation (Copyright © 2013)
    All rights reserved. This sample eSignal Formula Script (EFS)
    is for educational purposes only. Interactive Data Corporation
    reserves the right to modify and overwrite this EFS file with
    each new release.

Description:
    SVEZLRBPercB

Version:            1.00  04/06/2013

Formula Parameters:                     Default:
PercentB Deviation Period               18
PercentB Average                        3
Stochastic Period                       30
Stochastic Slowing                      3

Notes:
    The related article is copyrighted material. If you are not a subscriber
    of Stocks & Commodities, please visit www.traders.com.

**********************************/

var fpArray = new Array();

function preMain()
{
    setStudyTitle("SVEZLRBPercB");

    setCursorLabelName("Overbought", 0);
    setCursorLabelName("Neutral", 1);
    setCursorLabelName("Oversold", 2);
    setCursorLabelName("PB_Plot", 3);
    setCursorLabelName("K", 4);

    setDefaultBarFgColor(Color.grey, 0);
    setDefaultBarFgColor(Color.grey, 1);
    setDefaultBarFgColor(Color.grey, 2);
    setDefaultBarFgColor(Color.blue, 3);
    setDefaultBarFgColor(Color.red, 4);

    setPlotType(PLOTTYPE_DOT, 0);
    setPlotType(PLOTTYPE_DOT, 1);
    setPlotType(PLOTTYPE_DOT, 2);
    setPlotType(PLOTTYPE_LINE, 3);
    setPlotType(PLOTTYPE_LINE, 4);

    setDefaultBarThickness(1, 0);
    setDefaultBarThickness(2, 1);
    setDefaultBarThickness(1, 2);
    setDefaultBarThickness(1, 3);
    setDefaultBarThickness(1, 4);

    setShowCursorLabel(false, 0);
    setShowCursorLabel(false, 1);
    setShowCursorLabel(false, 2);
    setShowCursorLabel(true, 3);
    setShowCursorLabel(true, 4);

    var x = 0;

    fpArray[x] = new FunctionParameter("fpStDevPeriod", FunctionParameter.NUMBER);
    with(fpArray[x++])
    {
        setName("PercentB Deviation Period");
        setLowerLimit(1);
        setDefault(18);
    }

    fpArray[x] = new FunctionParameter("fpSmooth", FunctionParameter.NUMBER);
    with(fpArray[x++])
    {
        setName( "PercentB Average" );
        setLowerLimit(1);
        setDefault(3);
    }

    fpArray[x] = new FunctionParameter("fpPeriodK", FunctionParameter.NUMBER);
    with(fpArray[x++])
    {
        setName( "Stochastic Period" );
        setLowerLimit(1);
        setDefault(30);
    }

    fpArray[x] = new FunctionParameter("fpSmoothK", FunctionParameter.NUMBER);
    with(fpArray[x++])
    {
        setName( "Stochastic Slowing" );
        setLowerLimit(1);
        setDefault(3);
    }
}

var bInit = false;
var bVersion = null;

var xRainbow = null;
var xEMA1 = null;
var xEMA2 = null;
var xZLRB = null;
var xTEMA = null;
var xStdDev = null;
var xWMA = null;
var xRBC = null;
var xNom = null;
var xDen = null;
var xFastK = null;
var xSMA = null;

function main(fpStDevPeriod, fpSmooth, fpPeriodK, fpSmoothK)
{
    if (bVersion == null) bVersion = verify();
    if (bVersion == false) return;

    if (!bInit)
    {
    	xRainbow = efsInternal("Calc_Rainbow");
    	xEMA1 = ema(fpSmooth, xRainbow);
    	xEMA2 = ema(fpSmooth, xEMA1);
    	xZLRB = efsInternal("Calc_ZLRB", xEMA1, xEMA2);
        xTEMA = efsInternal("Calc_TEMA", fpSmooth, xZLRB);
        xStdDev = efsInternal("Calc_StdDev", fpStDevPeriod, xTEMA);
        xWMA = wma(fpStDevPeriod, xTEMA);
        xRBC = efsInternal("Calc_RBC", xRainbow);
        xNom = efsInternal("Calc_Nom", fpPeriodK, xRBC);
        xDen = efsInternal("Calc_Den", fpPeriodK, xRBC);
        xFastK = efsInternal("Calc_FastK", xNom, xDen);
        xSMA = sma(fpSmoothK, xFastK);

        bInit = true;
    }

    var nTEMA = 0;
    var nStdDev = 0;
    var nWMA = 0;
    var nFastK = 0;
    var nDen = 0;

    var nOverbought = 100;
    var nNeutral = 50;
    var nOversold = 0;

    var nPB_Plot = 0;
    var nK = 0;

    nTEMA = xTEMA.getValue(0);
    nStdDev = xStdDev.getValue(0);
    nWMA = xWMA.getValue(0);

    if (nTEMA == null || nStdDev == null || nWMA == null)
        return;

    nPB_Plot = (nTEMA + 2 * nStdDev - nWMA) / (4 * nStdDev) * 100;

    nFastK = 50;
    nDen = xDen.getValue(0);

    if (nDen == null)
        return;

    if (nDen >  0)
    {
        nK = xSMA.getValue(0);
    }
    else
    {
        nK = nFastK;
    }

    if (nK == null)
        return;

    return [nOverbought, nNeutral, nOversold, nPB_Plot, nK];
}

var xMA1 = null;
var xMA2 = null;
var xMA3 = null;
var xMA4 = null;
var xMA5 = null;
var xMA6 = null;
var xMA7 = null;
var xMA8 = null;
var xMA9 = null;
var xMA10 = null;

function Calc_Rainbow()
{
    var nSmaPeriod = 2;

    if (getBarState() == BARSTATE_ALLBARS)
    {
        xMA1 = sma(nSmaPeriod);
        xMA2 = sma(nSmaPeriod, xMA1);
        xMA3 = sma(nSmaPeriod, xMA2);
        xMA4 = sma(nSmaPeriod, xMA3);
        xMA5 = sma(nSmaPeriod, xMA4);
        xMA6 = sma(nSmaPeriod, xMA5);
        xMA7 = sma(nSmaPeriod, xMA6);
        xMA8 = sma(nSmaPeriod, xMA7);
        xMA9 = sma(nSmaPeriod, xMA8);
        xMA10 = sma(nSmaPeriod, xMA9);
    }

    var aAvg = new Array();
    var nSum = 0;

    var nReturnValue = 0;

    aAvg[0] = 5*xMA1.getValue(0);
    aAvg[1] = 4*xMA2.getValue(0);
    aAvg[2] = 3*xMA3.getValue(0);
    aAvg[3] = 2*xMA4.getValue(0);
    aAvg[4] = xMA5.getValue(0);
    aAvg[5] = xMA6.getValue(0);
    aAvg[6] = xMA7.getValue(0);
    aAvg[7] = xMA8.getValue(0);
    aAvg[8] = xMA9.getValue(0);
    aAvg[9] = xMA10.getValue(0);

    for (var i = 0; i <  aAvg.length; i++)
    {
        if (aAvg[i] == null)
            return;

        nSum += aAvg[i];
    }

    nReturnValue = nSum/20;

    return nReturnValue;
}

function Calc_ZLRB(xSeries1, xSeries2)
{
    var nDiff = 0;
    var nSeries1 = 0;
    var nSeries2 = 0;

    var nReturnValue = 0;

    nSeries1 = xSeries1.getValue(0);
    nSeries2 = xSeries2.getValue(0);

    if (nSeries1 == null || nSeries2 == null)
        return;

    nDiff = nSeries1 - nSeries2;
    nReturnValue = nSeries1 + nDiff;

    return nReturnValue;
}

var xTEMAEma1 = null;
var xTEMAEma2 = null;
var xTEMAEma3 = null;

function Calc_TEMA(nPeriod, xSeries)
{
    if (getBarState() == BARSTATE_ALLBARS)
    {
        xTEMAEma1 = ema(nPeriod, xSeries);
        xTEMAEma2 = ema(nPeriod, xTEMAEma1);
        xTEMAEma3 = ema(nPeriod, xTEMAEma2);
    }

    var nTEMAEma1 = 0;
    var nTEMAEma2 = 0;
    var nTEMAEma3 = 0;

    var nReturnValue = 0;

    nTEMAEma1 = xTEMAEma1.getValue(0);
    nTEMAEma2 = xTEMAEma2.getValue(0);
    nTEMAEma3 = xTEMAEma3.getValue(0);

    if (nTEMAEma1 == null || nTEMAEma2 == null || nTEMAEma3 == null)
        return null;

    nReturnValue = 3 * nTEMAEma1 - 3 * nTEMAEma2 + nTEMAEma3;

    return nReturnValue;
}

function Calc_StdDev(nPeriod, xSeries)
{
    if (xSeries.getValue(-nPeriod + 1) == null)
        return;

    var nCurValue = 0;
    var nSum1 = 0;
    var nSum2 = 0;
    var nMean = 0;

    var nReturnValue = 0;

    for (i = 0; i <  nPeriod; i++)
    {
        nCurValue = xSeries.getValue(-i);
        nSum1 += nCurValue;
        nSum2 += (nCurValue * nCurValue);
    }

    nMean = (nSum1 / nPeriod);
    nReturnValue = Math.sqrt((nSum2 / nPeriod) - (nMean * nMean));

    return nReturnValue;
}

var xHLC3 = null;

function Calc_RBC(xSeries)
{
    if (getBarState() == BARSTATE_ALLBARS)
    {
        xHLC3 = hlc3();
    }

    var nSeries = 0;
    var nHLC3 = 0;

    var nReturnValue = 0;

    nSeries = xSeries.getValue(0);
    nHLC3 = xHLC3.getValue(0);

    if (nSeries == null || nHLC3 == null)
        return;

    nReturnValue = (nSeries + nHLC3)/2

    return nReturnValue;
}

var xLow = null;
var xMinNow = null;

function Calc_Nom(nPeriod, xSeries)
{
    if (getBarState() == BARSTATE_ALLBARS)
    {
        xLow = low();
        xMinNow = lowest(nPeriod, xLow)
    }

    var nSeries = 0;
    var nMinNow = 0;

    var nReturnValue = 0;

    nSeries = xSeries.getValue(0);
    nMinNow = xMinNow.getValue(0);

    if (nSeries == null || nMinNow == null)
        return;

    nReturnValue = nSeries - nMinNow;

    return nReturnValue;
}

var xHigh = null;
var xMinDen = null;
var xMaxDen = null;

function Calc_Den(nPeriod, xSeries)
{
    if (getBarState() == BARSTATE_ALLBARS)
    {
        xHigh = high();
        xMaxDen = highest(nPeriod, xHigh);
        xMinDen = lowest(nPeriod, xSeries);
    }

    var nMinDen = 0;
    var nMaxDen = 0;

    var nReturnValue = 0;

    nMinDen = xMinDen.getValue(0);
    nMaxDen = xMaxDen.getValue(0);

    if (nMinDen == null || nMaxDen == null)
        return;

    nReturnValue = nMaxDen - nMinDen;

    return nReturnValue;
}

function Calc_FastK(xSeries1, xSeries2)
{
    var nSeries1 = 0;
    var nSeries2 = 0;

    var nReturnValue = 0;

    nSeries1 = xSeries1.getValue(0);
    nSeries2 = xSeries2.getValue(0);

    if (nSeries1 == null || nSeries2 == null)
        return;

    nReturnValue = Math.min(100, Math.max(0, 100 * nSeries1 / nSeries2));

    return nReturnValue;
}

function verify()
{
    var b = false;
    if (getBuildNumber() <  779)
    {
        drawTextAbsolute(5, 35, "This study requires version 8.0 or later.",
            Color.white, Color.blue, Text.RELATIVETOBOTTOM|Text.RELATIVETOLEFT|Text.BOLD|Text.LEFT,
            null, 13, "error");
        drawTextAbsolute(5, 20, "Click HERE to upgrade.@URL=https://www.esignal.com/download/default.asp",
            Color.white, Color.blue, Text.RELATIVETOBOTTOM|Text.RELATIVETOLEFT|Text.BOLD|Text.LEFT,
            null, 13, "upgrade");
        return b;
    }
    else
    {
        b = true;
    }

    return b;
}
A sample chart is shown in Figure 2.
FIGURE 2: ESIGNAL, SVEZLPERCB. The EFS study contains formula parameters to set the values for the indicator.
—Jason Keck
eSignal, an Interactive Data company
800 779-6555, www.eSignal.com
BACK TO LIST

THINKORSWIM: SEPTEMBER 2013 TRADERS’ TIPS CODE
In “Oscillators, Smoothed” in this issue, which is part 5 of an ongoing seven-part series from Sylvain Vervoort, Vervoort describes combining ideas based on Percent b and the stochastic oscillator to create an indicator smoothed by multiple moving averages (Figure 3). For thinkorswim users, we have created both a study and a strategy in our proprietary scripting language, thinkScript. You can adjust the parameters of these within the edit studies window to fine tune the periods calculated.
FIGURE 3: THINKORSWIM. Here is an example of a strategy implemented in thinkorswim based on Sylvain Vervoort’s article in this issue.
The Study:
- From our TOS Charts, Select Studies → Edit Studies.
- Select the Studies tab in the upper left hand corner.
- Select New in the lower left hand corner.
- Name the study (i.e. SVEZLRBPercB)
- Click in the script editor window, remove plot Data = close; and paste the following:
script RainbowAverage {
    input price = close;
    input length = 2;
    input averageType = AverageType.SIMPLE;

    def average1 = MovingAverage(averageType, price, length);
    def average2 = MovingAverage(averageType, average1, length);
    def average3 = MovingAverage(averageType, average2, length);
    def average4 = MovingAverage(averageType, average3, length);
    def average5 = MovingAverage(averageType, average4, length);
    def average6 = MovingAverage(averageType, average5, length);
    def average7 = MovingAverage(averageType, average6, length);
    def average8 = MovingAverage(averageType, average7, length);
    def average9 = MovingAverage(averageType, average8, length);
    def average10 = MovingAverage(averageType, average9, length);
    plot Rainbow = (5 * average1 + 4 * average2 + 3 * average3 + 2 * average4 + average5 + average6 + average7 + average8 + average9 + average10) / 20;

    Rainbow.SetDefaultColor(GetColor(1));
}

declare lower;

input price = close;
input stdDevLength = 18;
input emaLength = 3;
input numDev = 2.0;

input kPeriod = 30;
input slowingPeriod = 3;

def rainbow = reference RainbowAverage(price, 2, AverageType.SIMPLE);
def zeroLagRainbow = reference DEMA(rainbow, emaLength);
def tema = reference TEMA(zeroLagRainbow, emaLength);
def width = numDev * StDev(tema, stdDevLength);
plot PercentB = (tema + width - WMA(tema, stdDevLength)) / (2 * width) * 100;

def rbc = (rainbow + hlc3) / 2;
def fastK = (rbc - Lowest(low, kPeriod)) / (Highest(high, kPeriod) - Lowest(rbc, kPeriod)) * 100;
plot Stochastic = Average(fastK, slowingPeriod);

plot Lower = 0;
plot Middle = 50;
plot Upper = 100;

PercentB.SetDefaultColor(GetColor(1));
Stochastic.SetDefaultColor(GetColor(2));
Lower.SetDefaultColor(GetColor(8));
Middle.SetDefaultColor(GetColor(8));
Upper.SetDefaultColor(GetColor(8));

Lower.HideTitle();
Middle.HideTitle();
Upper.HideTitle();
The Strategy:
- From our TOS Charts, Select Studies → Edit Studies.
- Select the Strategy tab in the upper left hand corner.
- Select New in the lower left hand corner.
- Name the study (i.e. SVEZLRBPercB)
- Click in the script editor window, remove addOrder(OrderType.BUY_AUTO, no); and paste the following:
script RainbowAverage {
    input price = close;
    input length = 2;
    input averageType = AverageType.SIMPLE;

    def average1 = MovingAverage(averageType, price, length);
    def average2 = MovingAverage(averageType, average1, length);
    def average3 = MovingAverage(averageType, average2, length);
    def average4 = MovingAverage(averageType, average3, length);
    def average5 = MovingAverage(averageType, average4, length);
    def average6 = MovingAverage(averageType, average5, length);
    def average7 = MovingAverage(averageType, average6, length);
    def average8 = MovingAverage(averageType, average7, length);
    def average9 = MovingAverage(averageType, average8, length);
    def average10 = MovingAverage(averageType, average9, length);
    plot Rainbow = (5 * average1 + 4 * average2 + 3 * average3 + 2 * average4 + average5 + average6 + average7 + average8 + average9 + average10) / 20;

    Rainbow.SetDefaultColor(GetColor(1));
}
script SVEZLRBPercB {
    declare lower;

    input price = close;
    input stdDevLength = 18;
    input emaLength = 3;
    input numDev = 2.0;

    input kPeriod = 30;
    input slowingPeriod = 3;

    def rainbow = reference RainbowAverage(price, 2, AverageType.SIMPLE);
    def zeroLagRainbow = reference DEMA(rainbow, emaLength);
    def tema = reference TEMA(zeroLagRainbow, emaLength);
    def width = numDev * StDev(tema, stdDevLength);
    plot PercentB = (tema + width - WMA(tema, stdDevLength)) / (2 * width) * 100;

    def rbc = (rainbow + hlc3) / 2;
    def fastK = (rbc - Lowest(low, kPeriod)) / (Highest(high, kPeriod) - Lowest(rbc, kPeriod)) * 100;
    plot Stochastic = Average(fastK, slowingPeriod);

    plot Lower = 0;
    plot Middle = 50;
    plot Upper = 100;

    PercentB.SetDefaultColor(GetColor(1));
    Stochastic.SetDefaultColor(GetColor(2));
    Lower.SetDefaultColor(GetColor(8));
    Middle.SetDefaultColor(GetColor(8));
    Upper.SetDefaultColor(GetColor(8));

    Lower.HideTitle();
    Middle.HideTitle();
    Upper.HideTitle();
}

input price = close;
input stdDevLength = 18;
input emaLength = 3;
input numDev = 2.0;

input kPeriod = 30;
input slowingPeriod = 3;

def percentB = reference SVEZLRBPercB(price, stdDevLength, emaLength, numDev, kPeriod, slowingPeriod).PercentB;
def stochastic = reference SVEZLRBPercB(price, stdDevLength, emaLength, numDev, kPeriod, slowingPeriod).Stochastic;
def bothUp = percentB >  percentB[1] and stochastic >  stochastic[1];
def bothDown = percentB <  percentB[1] and stochastic <  stochastic[1];

AddOrder(OrderType.BUY_AUTO, bothUp crosses above 0.5, tickColor = GetColor(1), arrowColor = GetColor(1), name = "SVEZLRBPercB_LE");
AddOrder(OrderType.SELL_AUTO, bothDown crosses above 0.5, tickColor = GetColor(2), arrowColor = GetColor(2), name = "SVEZLRBPercB_SE");
—thinkorswim
A division of TD Ameritrade, Inc.
www.thinkorswim.com
BACK TO LIST

WEALTH-LAB: SEPTEMBER 2013 TRADERS’ TIPS CODE
In his article in this issue (“Oscillators, Smoothed”), author Sylvain Vervoort presents a near master class of suggestions on improving some well-known indicators using smoothing techniques. A combination of TEMA (triple exponential moving average) and WMA (weighted moving average) does a nice job smoothing out wiggles in a %b oscillator derived from a zero-lag “rainbow” data series (SVEZLRBPercB). The same rainbow series, averaged with the typical price, visibly smooths the traditional stochastic %K oscillator.
To illustrate the application of SVEZLRBPercB and the smoothed stochastic %K, we include a demo long-only strategy with just two basic rules: buy when the StochK crosses above from oversold territory, and sell when it leaves the overbought zone.
As usual, the complexity of the code is hidden by including the indicators in our TASCIndicators library (https://www.wealth-lab.com/Extensions/Details/24). To run the sample strategy in Wealth-Lab, you’ll need TASCIndicators version 2013.08 or higher. Please install (or update) the library from the wealth-lab.com website to its latest version.
C# Code

using System;
using System.Collections.Generic;
using System.Text;
using System.Drawing;
using WealthLab;
using WealthLab.Indicators;
using TASCIndicators;

namespace WealthLab.Strategies
{
	public class OscillatorsSmoothed : WealthScript
	{
		protected override void Execute()
		{
			HideVolume();
			ChartPane cp = CreatePane( 40,true,true );
			SVERBStochK K = SVERBStochK.Series(Bars,30,3);
			SVEZLRBPercB PB = SVEZLRBPercB.Series(Bars,3,18);
			PlotSeries( cp, PB, Color.DodgerBlue, LineStyle.Solid, 3 );
			PlotSeriesOscillator( cp, K, 80, 20, Color.FromArgb(40, Color.Red),
				Color.FromArgb(40, Color.Blue), Color.Red, LineStyle.Solid, 2 );


			for(int bar = GetTradingLoopStartBar(18); bar <  Bars.Count; bar++)
			{
				if (IsLastPositionActive) {
					if( CrossUnder( bar, K, 80 ) )
						SellAtMarket( bar+1, LastPosition );
				}
				else {
					if( CrossOver( bar, K, 20 ) )
						BuyAtMarket( bar+1 );
				}
			}
		}
	}
}
See Figure 4 for a sample of the strategy output.
FIGURE 4: WEALTH-LAB. Here is a sample Wealth-Lab 6 chart illustrating the application of smoothed indicators.
—Eugene, Wealth-Lab team
MS123, LLC
www.wealth-lab.com
BACK TO LIST

NEUROSHELL TRADER: SEPTEMBER 2013 TRADERS’ TIPS CODE
The zero-lag Percent b-based oscillator (SVEZLRBPercB) described by Sylvain Vervoort in his article in this issue (“Oscillators, Smoothed”) can be easily implemented with a few of NeuroShell Trader’s built-in indicators. Simply select “New Indicator...” from the Insert menu and use the Indicator Wizard to set up the following indicators:
Rainbow
Divide(Add3(Add4(Multiply2( 5, Avg(TimeSeries,2)),Multiply2( 4, Avg ( Avg ( TimeSeries, 2), 2)),
Mulitply2( 3, Avg( Avg( Avg(TimeSeries,2), 2), 2)),Multiply2( 2, Avg( Avg( Avg( Avg( TimeSeries, 2), 2), 2), 2))),Add4( Avg( Avg( Avg( Avg( Avg(TimeSeries,2), 2), 2), 2), 2),Avg( Avg( Avg( Avg( Avg( Avg( TimeSeries, 2), 2), 2), 2), 2), 2),Avg( Avg( Avg( Avg( Avg( Avg( Avg( TimeSeries, 2), 2), 2), 2), 2), 2), 2),Avg( Avg( Avg( Avg( Avg( Avg( Avg( Avg( TimeSeries, 2), 2), 2), 2), 2), 2),2), 2)), Add2( Avg( Avg( Avg( Avg( Avg( Avg( Avg( Avg( Avg( TimeSeries, 2), 2), 2), 2), 2), 2), 2), 2), 2), Avg( Avg( Avg( Avg( Avg( Avg( Avg( Avg( Avg( Avg( TimeSeries, 2), 2), 2), 2), 2), 2), 2), 2), 2), 2))), 20 )


ZLRB
Add2( ExpAvg( Rainbow, 3), Subtract( ExpAvg( Rainbow, 3), ExpAvg(ExpAvg( Rainbow, 3), 3)))


SVEZLRBPercB
Multiply2( Divide( Subtract( Add2( TEMA( ZLRB,3), Multiply2( 2, StdDev( TEMA( ZLRB,3), 18) ), LinWgtAvg( TEMA( ZLRB,3),18)), Multiply2( 4, StndDev( TEMA( ZLRB,3),18)), 100)


SlowStochastic
SimpleStochastic%D( Avg2(Rainbow, Avg3(High, Low, Close), 30, 3 )
Users of NeuroShell Trader can go to the Stocks & Commodities section of the NeuroShell Trader free technical support website to download a copy of this or any previous Traders’ Tips.
A sample chart of the SVEZLRBPercB implemented in NeuroShell Trader is shown in Figure 5.
FIGURE 5: NEUROSHELL TRADER. This NeuroShell Trader chart displays the SVEZLRBPercB and slow stochastic.
—Marge Sherald, Ward Systems Group, Inc.
301 662-7950, sales@wardsystems.com
www.neuroshell.com
BACK TO LIST

AIQ: SEPTEMBER 2013 TRADERS’ TIPS CODE
The AIQ code based on Sylvain Vervoort’s article in this issue, “Oscillators, Smoothed,” is provided at www.TradersEdgeSystems.com/traderstips.htm and is also shown below.
!OSCILLATORS, SMOOTHED
!Author: Sylvain Vervoort, TASC Sept 2013
!Coded by: Richard Denning 7/6/13
!www.TradersEdgeSystems.com

!INPUTS:
C is [close].
H is [high].
L is [low].
smaLen is 2.
smoLen is 3.
sdLen is 18.
kLen is 3.

!CODE FOR MODIFIED PERCENT B INDICATOR:
SMA1 is simpleavg(C,smaLen).
SMA2 is simpleavg(SMA1,smaLen).
SMA3 is simpleavg(SMA2,smaLen).
SMA4 is simpleavg(SMA3,smaLen).
SMA5 is simpleavg(SMA4,smaLen).
SMA6 is simpleavg(SMA5,smaLen).
SMA7 is simpleavg(SMA6,smaLen).
SMA8 is simpleavg(SMA7,smaLen).
SMA9 is simpleavg(SMA8,smaLen).
SMA10 is simpleavg(SMA9,smaLen).

rainbow is (5*SMA1 + 4*SMA2 + 3*SMA3 + 2*SMA4
  + SMA5 + SMA6 + SMA7 + SMA8 + SMA9
  +SMA10) / 20.

EMA1 is expavg(rainbow,smoLen).
EMA2 is expavg(EMA1,smoLen).
diff is EMA1 - EMA2.
ZLRB is EMA1 + diff.

EMAZ1 is expavg(ZLRB,smoLen).
EMAZ2 is expavg(EMAZ1,smoLen).
EMAZ3 is expavg(EMAZ2,smoLen).
TEMAZ is 3*EMAZ1 - 3*EMAZ2 + EMAZ3.
SDTEMAZ is sqrt(variance(TEMAZ,sdLen)).

TEMAZ18 is valresult(TEMAZ,18).
TEMAZ17 is valresult(TEMAZ,17).
TEMAZ16 is valresult(TEMAZ,16).
TEMAZ15 is valresult(TEMAZ,15).
TEMAZ14 is valresult(TEMAZ,14).
TEMAZ13 is valresult(TEMAZ,13).
TEMAZ12 is valresult(TEMAZ,12).
TEMAZ11 is valresult(TEMAZ,11).
TEMAZ10 is valresult(TEMAZ,10).
TEMAZ9 is valresult(TEMAZ,9).
TEMAZ8 is valresult(TEMAZ,8).
TEMAZ7 is valresult(TEMAZ,7).
TEMAZ6 is valresult(TEMAZ,6).
TEMAZ5 is valresult(TEMAZ,5).
TEMAZ4 is valresult(TEMAZ,4).
TEMAZ3 is valresult(TEMAZ,3).
TEMAZ2 is valresult(TEMAZ,2).
TEMAZ1 is valresult(TEMAZ,1).

WMA18TEMAZ is (18*TEMAZ + 17*TEMAZ1 + 16*TEMAZ2
	     + 15*TEMAZ3 + 14*TEMAZ4 + 13*TEMAZ5
	     + 12*TEMAZ6 + 11*TEMAZ7 + 10*TEMAZ8
	     + 9*TEMAZ9 + 8*TEMAZ10  + 7*TEMAZ11
	     + 6*TEMAZ12 + 5*TEMAZ13  + 4*TEMAZ14
	     + 3*TEMAZ15 + 2*TEMAZ16 + 1*TEMAZ17 ) /
	(18+17+16+15+14+13+12+11+10+9+8+7+6+5+4+3+2+1).

!Plot the following as single line indicator with 50 line:
PBmod is (TEMAZ + 2*SDTEMAZ - WMA18TEMAZ) / (4*SDTEMAZ)*100.

!CODE FOR MODIFIED BOLLIGER BANDS:
BBupMod is TEMAZ + 2*SDTEMAZ. !Plot on chart area
BBdnMod is TEMAZ - 2*SDTEMAZ. !Plot on chart area

!CODE FOR STANDARD PERCENT B:
sdC is sqrt(variance(C,sdLen)).
!For comparison the following is the percent B:
pctB is (C+2*sdC-simpleavg(C,sdLen))/(4*sdC)*100.

!CODE FOR MODIFIED SLOW STOCHASTIC:
typ is (H+L+C)/3.

RBC is (rainbow + typ) / 2.
nom is RBC - lowresult(RBC,kLen).
den is highresult(RBC,kLen) - lowresult(RBC,kLen).
fastKmod is min(100,max(0,100*nom / den)).
Kmod is simpleavg(fastKmod,smoLen).

!CODE FOR STANDARD SLOW STOCHASTIC:
n is (C - lowresult(L,kLen)).
d is (highresult(H,kLen)-lowresult(L,kLen)).
fastK is min(100,max(0,100*n / d)).
slowK is simpleavg(fastK,smoLen).

!COLOR STUDY FOR MODIFIED OSCILLATORS
Green if PBmod >  valresult(PBmod,1)
	and Kmod >  valresult(Kmod,1)
	and PBmod <  20 and Kmod <  20.
Red if PBmod <  valresult(PBmod,1)
	and Kmod <  valresult(Kmod,1)
	and PBmod >  80 and Kmod >  80.
In Figure 6, I show a chart of Sanderson Farms (SANF) with a color bar study that shows potential buys (green bars) when both oscillators are moving up and they are both oversold (below 20). It sells (red bars) when both oscillators are moving down and they are both overbought (above 80). The bands shown are based on the modified Bollinger Bands that are used in the calculation of the modified Percent b oscillator. For comparison purposes, I have also provided the formula for John Bollinger’s original Percent b indicator as well as for the original smoothed %K indicator.
FIGURE 6: AIQ. Here is a sample chart of Sanderson Farms (SANF) with Vervoort’s modified Bollinger Bands, his modified Percent b oscillator, and his smoothed %K oscillator, with a color study showing potential buys (green bars with up white arrows) and sells (red bars with down white arrows).
—Richard Denning
info@TradersEdgeSystems.com
for AIQ Systems
BACK TO LIST

TRADERSSTUDIO: SEPTEMBER 2013 TRADERS’ TIPS CODE
The TradersStudio code based on Sylvain Vervoort’s article in this issue, “Oscillators, Smoothed,” is provided at the following websites:
'OSCILLATORS, SMOOTHED
'Author: Sylvain Vervoort, TASC Sep 2013
'Coded by: Richard Denning 7/9/13
'www.TradersEdgeSystems.com

' TRIPPLE EXPONENTIAL MOVING AVERAGE:
Function TEMA(price as bararray,temaLen)
    Dim EMA As BarArray
    EMA = XAverage(price, temaLen, 0)
    TEMA = (3 * EMA) - (3 * XAverage(EMA,temaLen)) + (XAverage(XAverage(EMA,temaLen),temaLen))
End Function
'-----------------------------------------------------------------------------------------------
Function ZLEMA(price as bararray,smoLen)
Dim EMA1 As BarArray
Dim EMA2 As BarArray
Dim diff As BarArray
EMA1 = XAverage(price,smoLen)
EMA2 = XAverage(EMA1,smoLen)
diff = EMA1 - EMA2
ZLEMA = EMA1 + diff
End Function
'-----------------------------------------------------------------------------------------------
Function RainbowWtd(Price as bararray, Length)
    Dim SMA1 As BarArray
    Dim SMA2 As BarArray
    Dim SMA3 As BarArray
    Dim SMA4 As BarArray
    Dim SMA5 As BarArray
    Dim SMA6 As BarArray
    Dim SMA7 As BarArray
    Dim SMA8 As BarArray
    Dim SMA9 As BarArray
    Dim SMA10 As BarArray

    SMA1 = Average(Price, Length, 0)
    SMA2 = Average(SMA1, Length, 0)
    SMA3 = Average(SMA2, Length, 0)
    SMA4 = Average(SMA3, Length, 0)
    SMA5 = Average(SMA4, Length, 0)
    SMA6 = Average(SMA5, Length, 0)
    SMA7 = Average(SMA6, Length, 0)
    SMA8 = Average(SMA7, Length, 0)
    SMA9 = Average(SMA8, Length, 0)
    SMA10 = Average(SMA9, Length, 0)

    RainbowWtd = (5*SMA1+4*SMA2+3*SMA3+2*SMA4+SMA5+SMA6+SMA7+SMA8+SMA9+SMA10)/20
End Function
'-------------------------------------------------------------------------------------------------
Function PCT_B_MOD(smaLen,smoLen,sdLen)
Dim rainbow As BarArray
Dim ZLRB As BarArray
Dim TEMAZ As BarArray
Dim SDTEMAZ As BarArray
Dim WTEMAZ As BarArray

rainbow = RainbowWtd(C,smaLen)
ZLRB = ZLEMA(rainbow,smoLen)
TEMAZ = TEMA(ZLRB,smoLen)
SDTEMAZ = StdDev(TEMAZ,sdLen)
WTEMAZ = weightedma(TEMAZ,sdLen,0)
If SDTEMAZ < >  0 Then
  PCT_B_MOD = (TEMAZ + 2*SDTEMAZ - WTEMAZ)/(4*SDTEMAZ)*100
End If
End Function
'---------------------------------------------------------------------------------------------------
Function MOD_K_STOCH(smaLen,kLen,smoLen)
Dim typ As BarArray
Dim RBC As BarArray
Dim num As BarArray
Dim den As BarArray
Dim fastKmod As BarArray

typ = (H+L+C)/3
RBC = (RainbowWtd(C,smaLen) + typ) / 2
num = RBC - Lowest(RBC,kLen)
den = Highest(RBC,kLen) - Lowest(RBC,kLen)
If den < >  0 Then
   fastKmod = Min(100,Max(0,100*num) / den)
End If
MOD_K_STOCH = Average(fastKmod,smoLen)
End Function
'----------------------------------------------------------------------------------------------------
Sub PCTB_K_MOD_IND(smaLen,smoLen,sdLen,kLen)
Dim PBmod As BarArray
Dim Kmod As BarArray

PBmod = PCT_B_MOD(smaLen,smoLen,sdLen)
Kmod = MOD_K_STOCH(smaLen,kLen,smoLen)
plot1(PBmod)
plot2(Kmod)
plot3(100)
plot4(50)
plot5(0)
End Sub
'----------------------------------------------------------------------------------------------------
In Figure 7, I show a chart of the S&P emini (ES) using data from Pinnacle Data showing the combination of Vervoort’s modified indicators — the modified Percent b (in white) and the modified smoothed %K (in yellow).
FIGURE 7: TRADERSSTUDIO. Here is a chart of the S&P emini (ES) showing Vervoort’s modified Percent b (in white) and his modified smoothed %K (in yellow).
—Richard Denning
info@TradersEdgeSystems.com
for TradersStudio
BACK TO LIST

NINJATRADER: SEPTEMBER 2013 TRADERS’ TIPS CODE
In Sylvain Vervoort’s article in this issue, “Oscillators, Smoothed,” Vervoort discusses implementing his techniques in NinjaTrader and provides a NinjaScript in a sidebar to the article. We have created the LinearTrendSpotter indicator as discussed in his article, and this will be available for download from our website at www.ninjatrader.com/SC/September2013SC.zip.
A trendline is one of the oldest and simplest trading tools, yet it is very versatile and useful. These lines, often hand-drawn on a chart, are prone to inaccuracy and bias and so can be greatly improved by automation. The LinearTrendSpotter indicator offers two sets of lines tracked for uptrends and downtrends in different sensitivities so inputs can be found for a wide range of markets and time frames.
Further, the indicator can show a history of the trendlines printed on the chart, as well as alerts when the slope of the trend changes by more than a user-defined amount. The history can be imagined as a snapshot that occurs once every period, while the alerts can be especially useful when a long-term period changes direction. Adding to that, users can also set to draw the current set of trendlines as rays, thereby gaining the advantage of seeing the trends extrapolated beyond the last bar’s boundary.
A sample chart is shown in Figure 8.
FIGURE 8: NINJATRADER, LINEARTRENDSPOTTER. This screenshot shows the LinearTrendSpotter applied to a seven-minute chart of a CL light sweet crude oil continuous contract.
—Raymond Deux & Chelsea Bell
NinjaTrader, LLC
www.ninjatrader.com
BACK TO LIST

UPDATA: SEPTEMBER 2013 TRADERS’ TIPS CODE
Our Traders’ Tip for this month is based on “Oscillators, Smoothed” by Sylvain Vervoort in this issue. In his article, Vervoort delivers the fifth part in his ongoing series, using rainbow smoothing to modify John Bollinger’s Percent b oscillator to create an oscillator with zero lag for use with swing trading.
All parameters can be optimized within the Updata’s indicator optimizer to determine the most profitable combinations. A sample chart implementation is shown in Figure 9.
FIGURE 9: UPDATA. This chart shows the rainbow %b as applied to the S&P 500 index of daily resolution.
The Updata code for this system has been added to the Updata library and may be downloaded by clicking the custom menu and then system library. Users can alternatively paste the code shown below into the Updata custom editor and save it.
PARAMETER "Rainbow Iterations" #ITERATIONS=10
PARAMETER "EMA Period" #EMAPeriod=3
PARAMETER "Std.Dev Period" #stddevPERIOD=18
PARAMETER "TEMA Period" #Avg1Period=3
PARAMETER "Stochastic Period" #StochPERIOD=30
PARAMETER "Stochastic Smooth" #StochSMOOTH=3
INDICATORTYPE CHART
DISPLAYSTYLE 2LINES
COLOUR RGB(200,0,0)
COLOUR2 RGB(0,0,200)
NAME "%b [" #stddevPERIOD "][" #Avg1Period "]" ""
@BANDWIDTH=0
#i=0
@AVG=0
@RAINBOWAVG=0
#Mult=(#ITERATIONS/2)
'General formula for any length of iterations normalising constant
#SUMITERATIONS=#Mult+((#Mult)*(1+#Mult))/2
@AVERAGE=0
@WEIGHTEDSUM=0
@EMAWEIGHTEDAVG1=0
@EMAWEIGHTEDAVG2=0
@RAINBOWDIFF=0
@ZLRB=0
@TEMAvg=0
@TEMA_ZLRB=0
@WMA=0
@%b=0
@RBC=0
@STOCHASTIC=0
@STOCHASTICSMOOTH=0
FOR #CURDATE=(#stddevPERIOD*#ITERATIONS) TO #LASTDATE
   For #i=1 To #ITERATIONS
        if #i=1
           @AVG=SGNL(CLOSE,2,M)
           @RAINBOWAVG=#Mult*@AVG
        else
           @AVERAGE=SGNL(@AVG,2,M)
           @RAINBOWAVG=@RAINBOWAVG+(#Mult*@AVERAGE)
        endif
        #Mult=Max(1,#Mult-1)
   Next
   @RAINBOWAVG=@RAINBOWAVG/#SUMITERATIONS
   @EMAWEIGHTEDAVG1=SGNL(@RAINBOWAVG,#EMAPeriod,E)
   @EMAWEIGHTEDAVG2=SGNL(@EMAWEIGHTEDAVG1,#EMAPeriod,E)
   @RAINBOWDIFF=@EMAWEIGHTEDAVG1-@EMAWEIGHTEDAVG2
   @ZLRB=@EMAWEIGHTEDAVG1+@RAINBOWDIFF
   @TEMAvg=3*Sgnl(@ZLRB,#Avg1Period,E)-3*Sgnl(Sgnl(@ZLRB,#Avg1Period,E),#Avg1Period,E)+Sgnl(Sgnl(Sgnl(@ZLRB,#Avg1Period,E),#Avg1Period,E),#Avg1Period,E)
   @WMA=SGNL(@TEMAvg,#stddevPERIOD,W)
   @TEMA_ZLRB=STDDEV(@TEMAvg,#stddevPERIOD)
   @%b=100*(@TEMAvg+(2*@TEMA_ZLRB)-@WMA)/(4*@TEMA_ZLRB)
   @RBC=(@RAINBOWAVG+(HIGH+LOW+CLOSE)/3)/2
   @STOCHASTIC=100*(@RBC-PLOW(@RBC,#StochPERIOD))/(PHIGH(@RBC,#StochPERIOD)-PLOW(@RBC,#StochPERIOD))
   @STOCHASTICSMOOTH=SGNL(@STOCHASTIC,#StochSMOOTH,M)
   @PLOT=@STOCHASTIC
   @PLOT2=@STOCHASTICSMOOTH
NEXT
—Updata support team
support@updata.co.uk
www.updata.co.uk
BACK TO LIST

TRADESIGNAL: SEPTEMBER 2013 TRADERS’ TIPS CODE
The indicators presented by Sylvain Vervoort in his article in this issue, “Oscillators, Smoothed,” which is the fifth part of a seven-part series on indicators rules for a swing trading strategy (IRSTS), can easily be used with our online charting tool at www.tradesignalonline.com.
To locate the indicators, check the Infopedia section for our lexicon. There, you will find the indicator and the functions that you can make available for your personal account. Click on it and select open script. You can then apply it to any chart you wish (Figure 10).
FIGURE 10: TRADESIGNAL ONLINE. Here is a sample TradeSignal Online chart displaying the rainbow data series, the Percent Bollinger preview, and the slow stochastic rainbow indicator on an intraday chart of the German DAX.
The code is also shown below.
Percent Bollinger Rainbow:
Meta:
	Weblink("https://www.tradesignalonline.com/lexicon/view.aspx?id=20232"),
	Subchart( True );

Inputs:
	Smooth( 5 , 1 ),
	stdevperiod( 20 , 1 );

Vars:
	rainBowPCB, smoothedRainbow;

smoothedRainbow = IND_SmoothedRainbowData( 5 );

rainBowPCB = ( ( IND_TEMA(smoothedRainbow, smooth) + 2 * StdDeviation( IND_TEMA( smoothedRainbow, smooth ), stdevperiod ) - WAverage( Ind_TEMA( smoothedRainbow, smooth ), stdevperiod) ) / ( 4 * StdDeviation(IND_TEMA( smoothedRainbow, smooth),
stdevperiod) ) * 100 );

DrawLine( rainBowPCB, "Percent Bollinger Rainbow Data", StyleSolid, 2, Red );

// *** Copyright Tradesignal GmbH ***
// *** www.tradesignal.com **
Rainbow Data Series:
Meta:
	Weblink("https://www.tradesignalonline.com/lexicon/view.aspx?id=20232"),
	Subchart( False );

Vars:
	smoothedRainbow;

smoothedRainbow = IND_SmoothedRainbowData( 5 );

DrawLine( smoothedRainbow, "Rainbow", StyleSolid, 2, Red );

// *** Copyright Tradesignal GmbH ***
// *** www.tradesignal.com **
Slow Stochastic Rainbow:
Meta:
	Weblink("https://www.tradesignalonline.com/lexicon/view.aspx?id=20232"),
	Subchart( True );

Inputs:
	Smooth( 5 , 1 ),
	Stoch( 5 , 1 ),
	Stoch_Smooth( 5 , 1 );

vars:
	smoothedRainbow, rbcValue, nomValue, denomValue, fastKValue;

smoothedRainbow = IND_SmoothedRainbowData( 5 );
rbcValue = ( smoothedRainbow + TypicalPrice ) / 2;

nomValue = rbcValue - Lowest( Low, Stoch );
denomValue = Highest( High, Stoch ) - Lowest( rbcValue, Stoch );

If denomValue >  0 Then
	fastKValue = MinList( 100 * ( nomValue / denomValue ), 100 );

DrawLIne( Average( fastKValue, Stoch_Smooth ), "Stochastic Slow", StyleSolid, 2, Red );

// *** Copyright Tradesignal GmbH ***
// *** www.tradesignal.com **
—Henning Blumenthal, Tradesignal GmbH
support@tradesignalonline.com
www.TradesignalOnline.com, www.Tradesignal.com
BACK TO LIST

AMIBROKER: SEPTEMBER 2013 TRADERS’ TIPS CODE
In “Oscillators, Smoothed” in this issue, author Sylvain Vervoort presents a smoother Percent b and stochastic oscillator. Ready-to-use AmiBroker code to implement this indicator is shown below.
LISTING 1.

Typical = (H+L+C)/3;
input = Close ;

rainbow = 0;
for( i = 1; i < = 10; i++ )
{
   input = MA( input, 2 );

   weight = Max( 1, 6 - i );

   rainbow += weight * input;
}

rainbow /= 20;

StDevperiod = Param( "StDevPeriod", 18, 2, 100, 1 );
smooth = Param("Smooth", 3, 1, 100, 1 );
periodK = Param("PeriodK", 30, 2, 100, 1 );
smoothK = Param("SmoothK", 3, 1, 100, 1 );

EMA1 = EMA( rainbow, smooth );
EMA2 = EMA( EMA1, smooth );
ZLRB = 2 * EMA1 - EMA2;

TZ = TEMA( ZLRB, smooth );
TZDev = StDev( TZ, StDevperiod );

ZLRBPercB = ((TZ + 2*TZDev  - WMA(TZ,stdevperiod)) / (4*TZDev )*100);

Plot( ZLRBPercB , "ZLRBPercB", colorBlue );


RBC = (rainbow + Typical)/2;
nom = RBC - LLV( Low, periodK );
den = HHV( High, periodK ) - LLV( RBC, periodK ) + 1e-10;

fastK = Min( 100, Max( 0, 100 * nom/den ) );

Plot( MA( fastK, smoothK ), "SlowK", colorRed );
To display the indicator, input the code into the formula editor and press apply indicator. The averaging period and other parameters can be changed by right-clicking the chart and selecting parameters from the context menu. A sample chart is shown in Figure 11.
FIGURE 11: AMIBROKER. Here is a price chart of Ford (F) overlaid with the ZLRB Percent b and slow %K stochastic, replicating results from Sylvain Vervoort’s article in this issue.
—Tomasz Janeczko, AmiBroker.com
www.amibroker.com
BACK TO LIST

VT TRADER: SEPTEMBER 2013 TRADERS’ TIPS CODE
This Traders’ Tip is based on “Oscillators, Smoothed” by Sylvain Vervoort in this issue.
We’ll be offering the SVEZLRB oscillator indicator for download in our VT client forums at https://forum.vtsystems.com along with other precoded and free indicators & trading systems. The VT Trader instructions for using the SVEZLRB oscillator as well as the code are shown below.
- VT Trader’s Ribbon→Technical Analysis menu→Indicators group→Indicators Builder→[New] button
- In the General tab, type the following text into each corresponding text box:
Name: TASC - 09/2013 - SVEZLRB PercentB Oscillator
Function Name Alias: tasc_SVEZLRBPercBOsc
Label Mask: SVEZLRB PercB Oscillator (%prc%,%stdevperiod%,%smooth%) = %PB%
Placement: New Frame
Data Inspection Alias: SVEZLRB PercB Oscillator
- In the Input Variable(s) tab, create the following variables:
[New] button...
Name: prc
Display Name: Price (data series)
Type: price
Default: close

[New] button...
Name: stdevperiod
Display Name: PercentB Deviation Period
Type: integer
Default: 18

[New] button...
Name: smooth
Display Name: PercentB Smoothing Period
Type: integer
Default: 3
- In the Output Variable(s) tab, create the following variables:
[New] button...
Var Name: PB
Name: PB
Line Color: blue
Line Width: 1
Line Type: solid line
- In the Horizontal Line tab, create the following horizontal lines:
[New] button...
Value: +50
Line Color: red
Line Width: thin
Line Type: dashed
- In the Formula tab, copy and paste the following formula:
{Provided By: Visual Trading Systems, LLC}
{Copyright: 2013}
{Description: TASC, September 2013 - "Oscillators, Smoothed" by Sylvain Vervoort}
{File: tasc_SVEZLRBPercBOsc.vtscr - Version 1.0}

{Rainbow Value}

MA:= 5*Mov(prc,2,S);
r1:= 4*Mov(MA,2,S);
r2:= 3*Mov(r1,2,S);
r3:= 2*Mov(r2,2,S);
r4:= Mov(r3,2,S);
r5:= Mov(r4,2,S);
r6:= Mov(r5,2,S);
r7:= Mov(r6,2,S);
r8:= Mov(r7,2,S);
r9:= Mov(r8,2,S);

Rainbow:= (MA+r1+r2+r3+r4+r5+r6+r7+r8+r9)/20;

{Zero-Lag Rainbow}

EMA1:= Mov(Rainbow,smooth,E);
EMA2:= Mov(EMA1,smooth,E);
diff:= EMA1-EMA2;
ZLRB:= EMA1+diff;

{Modified Percent B}

TemaZLRB:= vt_TEMA(ZLRB,smooth,E);
PB:= (TemaZLRB+2*stdev(TemaZLRB,stdevperiod)-Mov(TemaZLRB,stdevperiod,W))/(4*stdev(TemaZLRB,stdevperiod))*100;
- Click the “Save” icon in the toolbar to finish building the SVEZLRB PercentB Oscillator.
To add the indicator to a VT Trader chart (see Figure 12), click the right mouse button within the chart window and then select “Add Indicator” → “TASC - 09/2013 - SVEZLRB PercentB Oscillator” from the indicator list.
FIGURE 12: VT TRADER, SVEZLRB. Here, Sylvain Vervoort’s SVEZLRB oscillator is shown on a EUR/USD daily candle chart.
To learn more about VT Trader, visit www.vtsystems.com.
Risk disclaimer: Past performance is not indicative of future results. Forex trading involves a substantial risk of loss and may not be suitable for all investors.
—Chris Skidmore
Visual Trading Systems, LLC
vttrader@vtsystems.com, www.vtsystems.com
BACK TO LIST

TRADING BLOX: SEPTEMBER 2013 TRADERS’ TIPS CODE
In Sylvain Vervoort’s article in this issue, “Oscillators, Smoothed,” which is the fifth part of an ongoing series, he introduces a fast and slow oscillator that can be used to help make buy & sell decisions in the context of a trading system.
Last month in Trading Blox’s August 2013 Traders’ Tip, we provided an example of how to create standard indicators in Trading Blox without writing any code in the main scripting editor. For indicators that require more complex calculations, it is sometimes necessary to write code in the scripting editor and, as a result, the process for creating the indicator is slightly different.
To set up the indicators, we create a new block called “SVE Percent B Indicator.” Vervoort’s article instructs us to create four parameters that act as inputs to our indicator calculations. In addition, we will create 24 instrument permanent variables to hold our calculations.
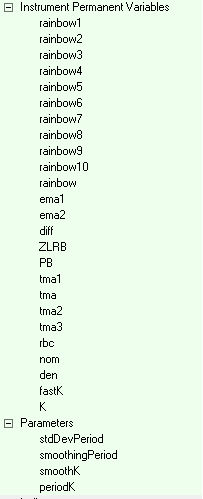
24 instrument permanent variables and four parameters comprise the SVE Percent B Indicator Block variables
The instrument permanent variables for this example are set to the variable type series, which stores a series of numbers. Series variables that are used as indicators must be enabled for plotting, which is unchecked by default. Under plotting controls, check plots, choose a color and line style, and create a new label for the graph area if the indicator will not be overlaid in the price window.
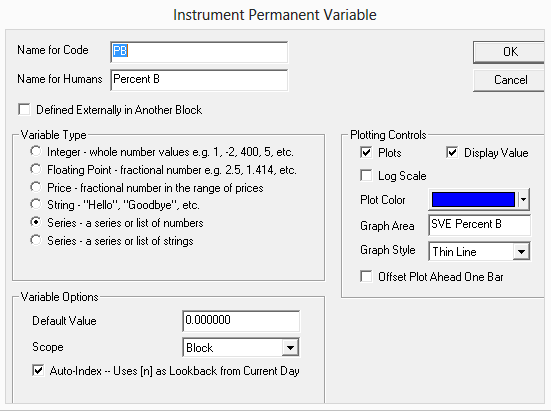
The Instrument Permanent Variable settings
Indicator calculations are done in the update indicators script. Update indicators is run on each bar of the test, building the indicator bar by bar. Below is the code for both the fast and slow indicators.
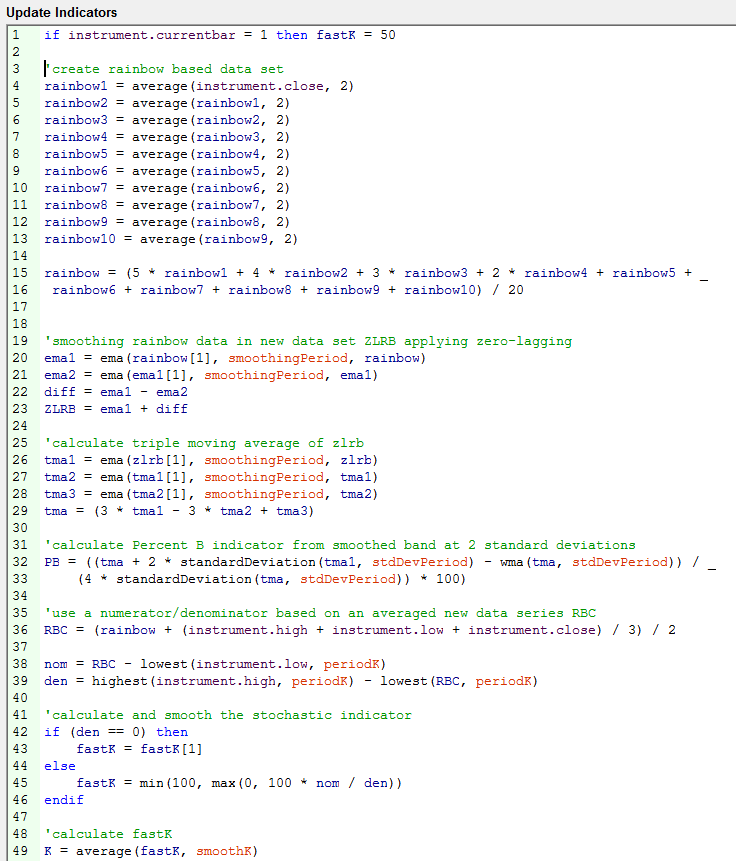
Update Indicators code for the fast and slow oscillators
The code is also available here.
A sample chart is in Figure 13.
FIGURE 13: TRADING BLOX, SAMPLE PLOT. Here, Sylvain Vervoort’s modified Percent b is plotted in a separate graph.
—Trading Blox
tradingblox.com
BACK TO LIST
MICROSOFT EXCEL: SEPTEMBER 2013 TRADERS’ TIPS CODE
In “Oscillators, Smoothed” in this issue, Sylvain Vervoort presents the fifth part of a seven-article series on indicator rules for a swing trading strategy (IRSTS). In it, he presents a modified version of the Percent b oscillator as well as his smoothed stochastic indicators.
The spreadsheet I am presenting here builds on the base of last month’s that I offered for part 4 of Vervoort’s series and is cumulative back to the beginning of the article series (which began with the April 2013 issue of S&C).
The calculations necessary for the two oscillators described in Vervoort’s article this month occupy 32 columns beginning in column BE of the charts tab and extending through column CJ. The calculations are straightforward and the results appear to be quite predictive of price behavior. See an example chart displaying the indicators in Figure 14.
FIGURE 14 EXCEL, OSCILLATOR SPECIFICATIONS. User controls (in blue) for the SVE oscillators can be found starting at cell BE22.
You can play “what-if” with these two indicators using the computational control values (in blue) for these indicators co-located with the calculation columns. The numbers in black are derived from the numbers specified in blue (Figure 15).
FIGURE 15: EXCEL, DATA DOWNLOAD. A new data download capability has been added to this month’s spreadsheet, with support for direct data retrieval from Yahoo Finance.
With this month’s spreadsheet, I have added support for direct data retrieval from Yahoo! Finance (Figure 16).
FIGURE 16: EXCEL, SVEZLRBPERB OSCILLATOR. Shown here is a chart of US Steel with Sylvain Vervoort’s SVEZLRBPercB oscillator and his smoothed stochastic indicators, similar to Figure 5 of Vervoort’s article in this issue.
This new support can be used to avoid the extra step of downloading historical data to disk and then importing the resulting CSV file.
To use this capability, the user specifies the same four criteria that you would need on the Yahoo! website: symbol; date range as a “from” and “to” date; and a data type. Then click the get historical data button. The available data area will provide a summary of the data retrieved.
The older capability of importing from disk is still there for those who want to save bandwidth by downloading once and then perhaps using the data in multiple spreadsheets that have been presented in other Traders’ Tips sections.
The spreadsheet file for this Traders’ Tip can be downloaded here. To successfully download it, follow these steps:
- Right-click on the Excel file link, then
- Select “save target as” to place a copy of the spreadsheet file on your hard drive.
—Ron McAllister
Excel and VBA programmer
rpmac_xltt@sprynet.com
BACK TO LIST
Originally published in the September 2013 issue of
Technical Analysis of Stocks & Commodities magazine.
All rights reserved. © Copyright 2013, Technical Analysis, Inc.
Return to
Contents