OPTIONS
Use The CBOE's Options Analysis Calculator -- Gratis
by Rudy Teseo
Here's how to use the free option calculator offered by the Chicago Board Options Exchange to set up your positions.
Option strategy diagrams are the standards used in the industry to represent the curves developed in the Black-Scholes options model. The Black-Scholes model is actually a mathematical formula that was developed in the early 1970s for calculating a fair option price, and it is still the accepted standard used today. You can get an excellent model of these computations, free of charge, on a compact disc from the Chicago Board Options Exchange (CBOE). This CD also contains a complete course in options trading.
In the CBOE model, you enter the required variables (current stock price, strike price, time to expiration, implied volatility, and current risk-free interest rate), and the model then presents a graphic display of the strategy that allows you to theorize by changing the variables.
Here's how to use this little treasure.

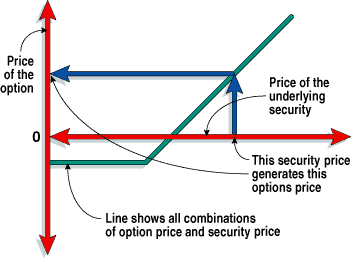
FIGURE 1: DEFINITIONS AT A GLANCE.
1 Think about having to memorize all those option definitions, and then see if a simple diagram couldn't tell you the same thing in a single glance. Cost/profit curves display the relationship between the price of the option (the premium paid or received) and the price of the underlying security (Figure 1). You can readily visualize the option price increasing and decreasing in value as the security price increases and decreases, respectively. You can also tell at a glance the risk/reward potential of this strategy.
Rudy Teseo is a retired communications and computer consultant. He teaches classes in option trading and basics of stock charting. He can be reached via E-mail at Rftess@juno.com.
Excerpted from an article originally published in the March 2000 issue of Technical Analysis of STOCKS & COMMODITIES magazine. All rights reserved. © Copyright 2000, Technical Analysis, Inc.
Return to March 2000 Contents