INDICATORS
On Lag, Signal Processing, And The Hilbert Transform
Hilbert Indicators Tell You When To Trade
by John Ehlers
Here's one way to control moving average lag, using a little math and a little-known algorithm called the Hilbert transform to come up with indicators telling you when to trade.
Two characteristics of moving averages is that they smooth the input data and they lag the input data. Their use and application is almost always a tradeoff between these two characteristics. The smoothing function removes the higher-frequency components (that is, the rapid up and down movements) of the input prices, so moving averages are also referred to as low-pass filters by engineers. This means moving averages display or allow to pass through only the low-frequency components (that is, the slow up and down movements) while removing the high-frequency components. Essentially, what you'll see instead of raw prices jumping around is a smoothly moving line slowly oscillating up and down.
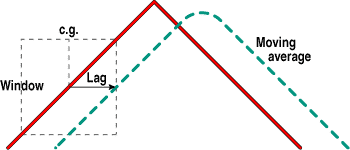
FIGURE 1: OBSERVATION WINDOW. An average formed over the width of an observation window is plotted at the right-hand side of the window to produce lag. The observation window is moved along the dataset to produce a moving average.
Moving average lag is perhaps the most important characteristic for traders to understand quantitatively. Figure 1 shows how a simple moving average is formed. Data within the observation window is averaged to produce a single point. The observation window (the dotted box) is moved forward in time from bar to bar to form a continuous moving average. If the weighting of the data values within the observation window is uniform, the average value of the data is centered in the horizontal dimension of the window and is also centered in the vertical dimension of the window.
Since the simple moving average is usually plotted at the right-hand side of the observation window, the lag must be half the width of the window. When more complex weighting functions, such as a linearly weighted moving average, are applied to the data, the lag will be the center of the weighting function. For example, a linearly weighted moving average will have a lag equal to a third of the width of the observation window.
Since the exponential moving average (EMA) is commonly used in technical analysis, you should know how to compute the averaging constant a (alpha) in terms of the lag that the EMA produces. The mathematical expression for an EMA is:
f(z) = a *g(z) + (1 ? a) * f(z - 1)
Here, z is the counter for the sampled prices (day 1, day 2, and so forth), f is the EMA (the filtered output), a (alpha) is a fraction between zero and 1, and g(z) is the input price for period z. In terms of daily price bars, this equation says that the EMA today, f(z), is equal to the a fraction times today's price plus the complement, (1 ? a), of the a fraction multiplied by yesterday's EMA.
John Ehlers, Box 1801, Goleta, CA 93116, is an electrical engineer working in electronic research and development and has been a private trader since 1978. He is a pioneer in introducing maximum entropy spectrum analysis to technical trading through his Mesa software. He may be reached at 805 969-6478, or via his Website at https://www.mesa-systems.com/.
Excerpted from an article originally published in the March 2000 issue of Technical Analysis of STOCKS & COMMODITIES magazine. All rights reserved. © Copyright 2000, Technical Analysis, Inc.
Return to March 2000 Contents