TRADERS’ TIPS
August 2025

For this month’s Traders’ Tips, the focus is Markos Katsanos’ article in this issue, “A Sector Rotation Strategy.” Here, we present the August 2025 Traders’ Tips code with possible implementations in various software.
You can right-click on any chart to open it in a new tab or window and view it at it’s originally supplied size, often much larger than the version printed in the magazine.
The Traders’ Tips section is provided to help the reader implement a selected technique from an article in this issue or another recent issue. The entries here are contributed by software developers or programmers for software that is capable of customization.

The Zorro Platform: August 2025
A stock rotation system is normally a safe haven, compared to other algorithmic systems. There’s no risk of losing all capital, and there are normally small but steady gains. The catch: Most of those strategies, and the ETFs derived from them, do not fare better than the index. Many fare even worse. In his article in this issue, “A Sector Rotation Strategy,” Markos Katsanos proposes a solution for that.
His stock rotation strategy comes with two twists: excluding the top performers, which often experience a reversal to the mean, and filtering out bear market situations. His code is written in AmiBroker language, which means that I must rewrite it from scratch in the C language. AmiBroker uses a structure with no buy or sell orders. Instead, it establishes a “portfolio rotation mode” that needs to be set up with many variables. Zorro’s C language does it without a special rotation mode and uses buy and sell orders just as for any other strategy. This makes the script a bit shorter and easier to comprehend. The script follows:
void run()
{
  StartDate = 2012;
  EndDate = 2025;
  BarPeriod = 1440;
  LookBack = 252;  // 1 year
  Capital = slider(1,10000,0,20000,"Capital","");

  assetList("AssetsNASDAQ");
  assetAdd("QQQ","STOOQ:QQQ");
  asset("QQQ");

// set up variables
  int MaxOpenPositions = 15;
  int ROCBars = 100;
  int ExitBars = 20;
  int MAPeriod = 300;
  int ExcludeTopN = 2;

// bear market filter
  var MAQQQ = ZMA(seriesC(),MAPeriod);
  bool Bear = MAQQQ < ref(MAQQQ,1);

  if(Day%ExitBars == 0)
  {
// assign a score to any asset
     for(listed_assets) {
       asset(Asset);
       if(Asset == "QQQ" || Bear)
         Score[Itor] = 0;    // don't trade the index
      else
           Score[Itor] = ROC(seriesC(),ROCBars);

// exclude the N top scores
         int i;
        for(i=0; i<ExcludeTopN; i++)
          Score[MaxIndex(Score,NumAssetsListed)] = 0;

// rotate positions
     distribute(Weights,Score,NumAssetsListed,MaxOpenPositions,0.5);
     rotate(0);	// decrease positions
     rotate(1);	// increase positions
  }
}
We load all NASDAQ stocks from an asset list (AssetsNASDAQ), and add the “QQQ” index ETF because we need that for the bear market filter. The MAQQQ variable holds the average index value, determined with a zero-lag moving average (ZMA). The ZMA has two advantages over a standard moving average: faster reaction (as the name indicates) and not needing a long data history. We determine a bear market when the average is falling.
Next, we check if we have reached the rotation date (Day%ExitBars is the number of days since start modulo the number of days for a rotation). If so, we loop over all assets and assign every one a score, depending on its N-day rate of return (ROC). The Itor variable is the number of the asset in the loop. The QQQ index gets no score, and in a bear market, none of them gets a score.
Next, we remove the top two performers, since we assume they are overbought. The distribute function takes the scores and converts them to weights, while all weights sum up to 1. The function can be looked up in the Zorro manual (https://zorro-project.com/manual/en/renorm.htm).
Finally, we perform the actual rotation. This is a bit tricky, because we need two steps. The first step reduces all positions that ought to be reduced. The second step increases all positions that ought to be increased. This order is important, because if we increased a position first, the total volume could exceed our capital on the brokerage account.
The rotate function is not a Zorro function but is contained in the script:
void rotate(int Buy)
{
  for(listed_assets) {
    asset(Asset);
    int NewLots = Capital*Weights[Itor]/MarginCost;
    if(NewLots < LotsPool)
      exitLong(0,0,LotsPool-NewLots);
    else if(Buy && NewLots > LotsPool)
      enterLong(NewLots-LotsPool);
  }
}
In his article, Katsanos optimizes the variables, so, to implement or recreate his approach, we must do the same. This requires the following modification to the above code:
set(PARAMETERS);  // parameter optimization
setf(TrainMode,TRADES|GENETIC); // size matters

int MaxOpenPositions = optimize(15,5,30,5);
int ROCBars = optimize(100,50,250,50);
int ExitBars = optimize(20,10,50,5);
int MAPeriod = optimize(300,100,1000,100);
int ExcludeTopN = optimize(2,1,5,1);
We’re using genetic optimization with considering the trade volume (TRADES|GENETIC). The optimization takes about one minute. It’s in-sample, so take the result with a grain of salt. The example equity curve shown in Figure 1 resulted from a backtest.
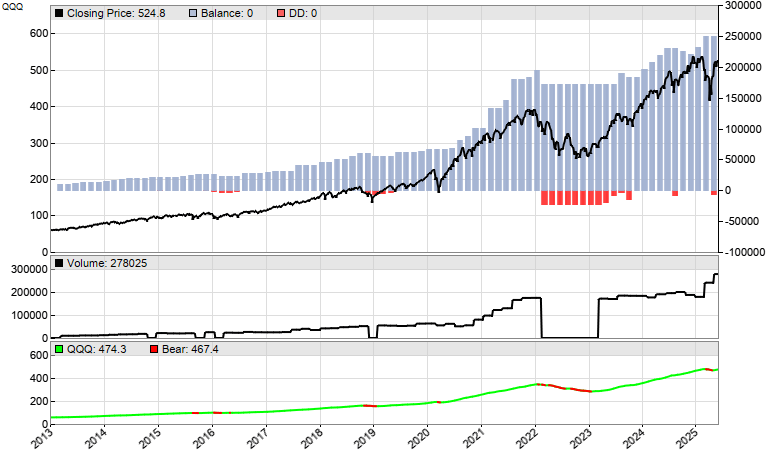
FIGURE 1: ZORRO. Here is an example equity curve from a backtest of the sector rotation strategy. Genetic optimization is used with consideration of the trade volume (TRADES|GENETIC).
In the backtest, we’re reinvesting profits; for this, replace “capital” with “equity” in the rotate function. The blue bars are the account equity, the black line is the QQQ index. We can see that the balance has far less drawdowns than the index. The black line in the small subchart is our trade volume, which is zero when a bear market is detected. The green line is the QQQ average, with bear market situations indicated in red.
The system produces 32% CAGR in this backtest, with a 14% worst drawdown. This replicates Katsanos’ results in his article, but again, keep in mind that this is from an in-sample optimization. When we apply walk-forward optimization, our CAGR result goes down to 22%. Still, a good performance.
The code can be downloaded from the 2025 script repository on https://financial-hacker.com. The Zorro platform can be downloaded from https://zorro-project.com.
—Petra Volkova
The Zorro Project by oP group Germany
https://zorro-project.com
BACK TO LIST

Wealth-Lab.com: August 2025
WealthLab’s Rotation Strategy type makes it a cinch to whip up the strategy that Markos Katsanos presents in his article in this issue, “A Sector Rotation Strategy.” No coding is needed to perform it. See Figure 2.
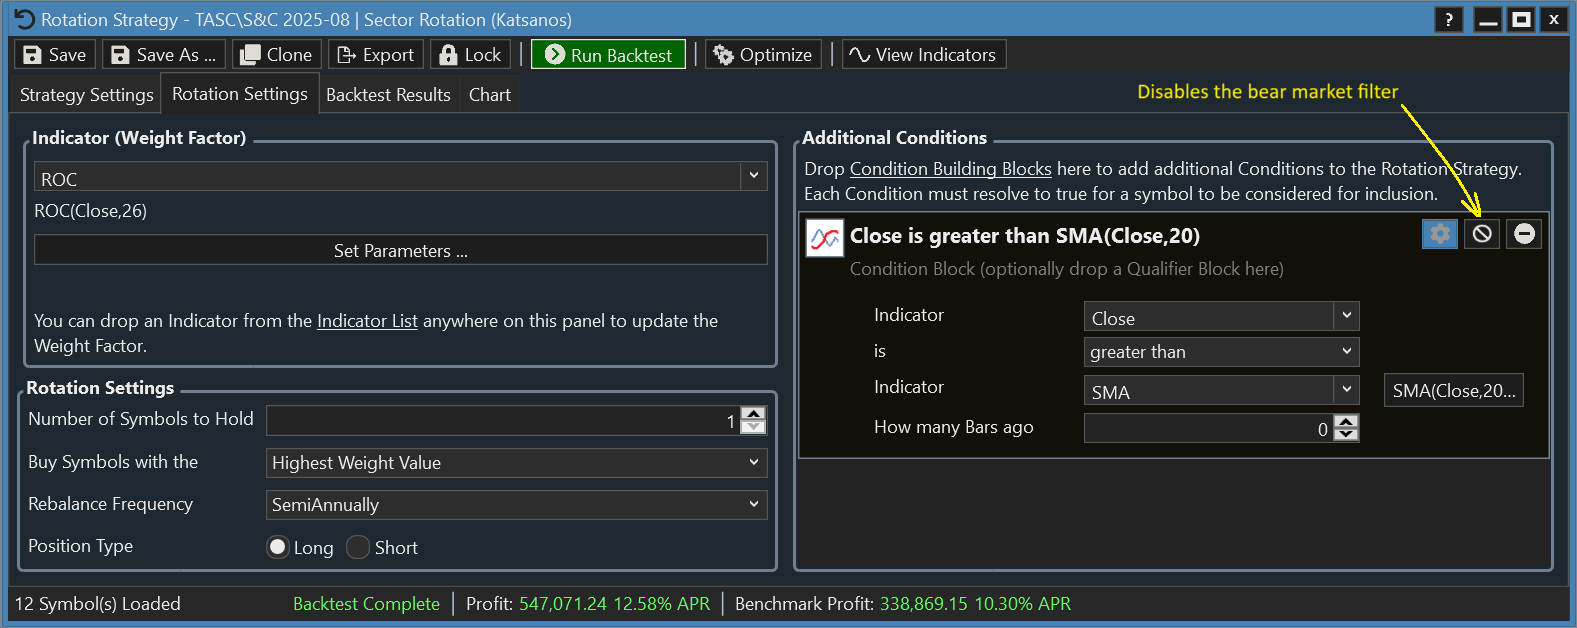
FIGURE 2: WEALTH-LAB. Shown here is WealthLab’s Rotation Strategy window.
The trade dates shown in the article for the 13/52 sector rotation backtest with annual rebalancing varied over four calendar weeks from April 1, 2005 to March 7, 2025. WealthLab’s rotation strategy rebalancing is more deterministic. A yearly rebalance always signals on the last full trading week in December. Likewise, rebalancing semiannually signals on the last trading weeks in June and December. Rebalance dates make a big difference in the results—especially since none of the ETFs were above their 20-week average at the end of December 2008 and 2018, leaving the strategy flat for two years due to that bear market constraint. Nonetheless, we found that a 26-week ROC with a semi-annual rebalance (and the bear market filter disabled) handily beat the benchmark from 2005 to 2025 with a 12.6% annualized return vs. SPY’s 10.3%, dividends included (see Figure 3).
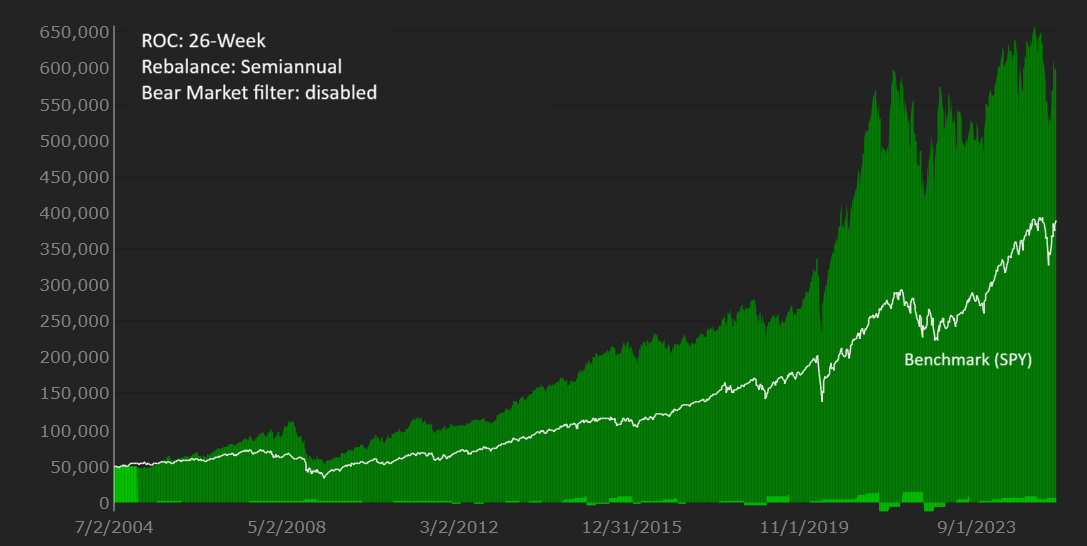
FIGURE 3: WEALTH-LAB. Displayed here is a sample equity curve for the “26/26” rotation backtest from Figure 2.
—Robert Sucher
Wealth-Lab team
www.wealth-lab.com
BACK TO LIST

Neuroshell Trader: August 2025
A sector rotation strategy such as the one described in Markos Katsanos’s article in this issue, “A Sector Rotation Strategy,” can be easily implemented in NeuroShell Trader with a few of NeuroShell Trader’s 800+ indicators.
Simply select “New strategy” from the insert menu and use the trading strategy wizard to create the following strategy, which implements the strategy of selecting the two top-performing sectors based upon their 13-week percent change, excluding those below their 20-week moving average and then rebalancing after 26 weeks:
BUY LONG CONDITIONS: [All of which must be true]
A<=B(ChartPageURank(IfThenElse(A>=B(Close,Avg(Close,20)),%Change(Close,13),*)),2)
A=B(Remainder(CumSum(Add2(1,0),0),26),0)

SELL LONG CONDITIONS: [All of which must be true]
A>B(ChartPageURank(%Change(Close,13)),2)
A=B(Remainder(CumSum(Add2(1,0),0),26),0)
To determine the most profitable parameters, simply use NeuroShell Trader built-in genetic optimizer to optimize the momentum, moving average, rebalance, and number of top performer parameters.
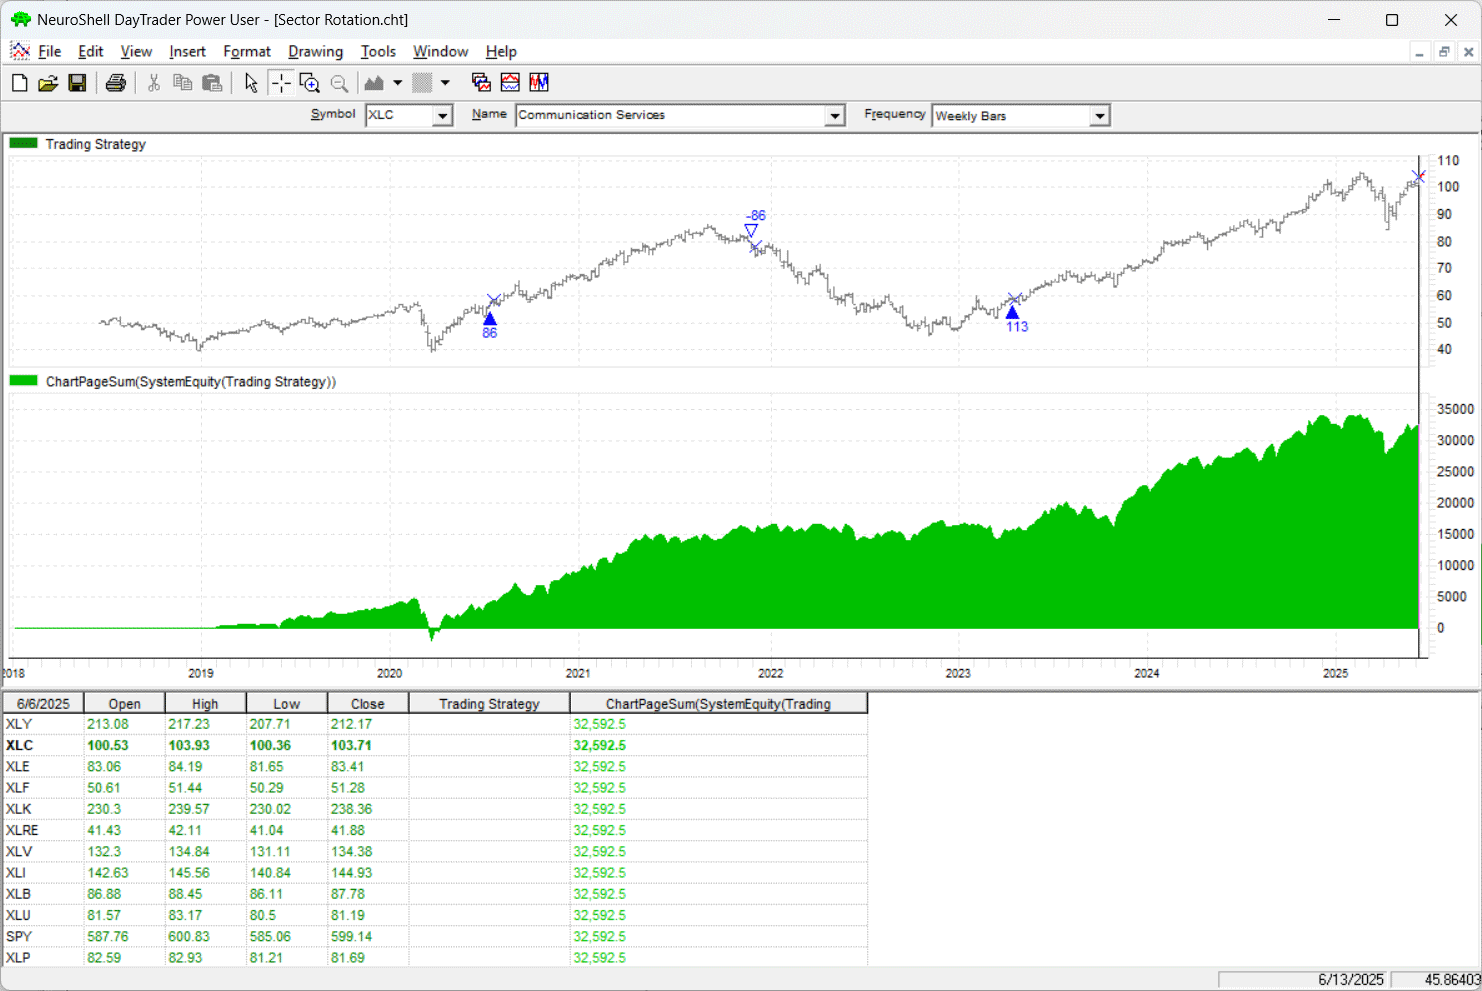
FIGURE 4: NEUROSHELL TRADER. This NeuroShell Trader chart demonstrates a genetically optimized sector rotation trading strategy.
Users of NeuroShell Trader can go to the Stocks & Commodities section of the NeuroShell Trader free technical support website to download a copy of this or any previous Traders’ Tips.
—Ward Systems Group, Inc.
sales@wardsystems.com
www.neuroshell.com
BACK TO LIST

RealTest: August 2025
Provided here is coding for use in the RealTest platform to implement Markos Katsanos’s ideas described in his article in this issue, “A Sector Rotation Strategy.” The first code listing implements Katsanos’ first strategy and the second code listing implements the second strategy described in the article.
Notes:
	Markos Katsanos "A Sector Rotation Strategy", TASC August 2025.
	Implements the first strategy coded in the article (S&P sector ETF rotation)

Import:
	DataSource:	Yahoo
	IncludeList:	XLY, XLP, XLE, XLF, XLV, XLI, XLB, XLK, XLU, VOX, RWR {"sectors"}
	StartDate:	2004-04-01 // extra year for warmup
	EndDate:	Latest
	SaveAs:	tasc_aug_25_a.rtd

Settings:
	DataFile:	tasc_aug_25_a.rtd
	StartDate:	2005-04-01 // author's start date
	EndDate:	Latest
	BarSize:	Weekly
	AccountSize:	100000

Parameters:
	numpos:	1
	barsMA:	20
	barsROC:	13
	barsHold:	52
	bearFilter:	1

Data:
	myMA:	MA(C, barsMA)
	aboveMA:	myMA >= myMA[1]
	myROC:	ROC(C, barsROC)
	canRank:	InList("sectors") and (bearFilter = 0 or aboveMA)
	posrank:	#rank if(canRank, myROC, nan)

Strategy: sector_rotate
	Side:	Long
	EntrySetup:	posrank <= numpos
	ExitRule:	BarsHeld = barsHold
	EntryTime:	ThisClose
	ExitTime:	ThisClose
	MaxPositions:	numpos
	Commission:	0.01
	// the author uses non-compounded position sizing
	Quantity:	100000 / numpos
	QtyType:	Value
	// force stats to report as if compounded as per the article
	Compounded:	True
Notes:
	Markos Katsanos "A Sector Rotation Strategy", TASC August 2025.
	Implements the second strategy coded in the article (Nasdaq 100 stocks rotation)

Import:
	DataSource:	Norgate
	IncludeList:	.Nasdaq 100 Current & Past
	IncludeList:	QQQ // for index filter
	StartDate:	2017-04-30 // extra year for warmup
	EndDate:	Latest
	SaveAs:	tasc_aug_25_b.rtd

Settings:
	DataFile:	tasc_aug_25_b.rtd
	StartDate:	2018-04-30 // author's start date
	EndDate:	Latest
	BarSize:	Daily
	AccountSize:	100000

Parameters:
	numpos:	1
	exclude:	3
	barsMA:	25
	barsROC:	63
	barsHold:	20
	bearFilter:	1
	histConst:	0, 1

Data:
	myMA:	MA(C, barsMA)
	aboveMA:	myMA >= myMA[1]
	myROC:	ROC(C, barsROC)
	// use historical index constituency (article results do not)
	canRank:	InNDX and (bearFilter = 0 or Extern($QQQ, aboveMA))
	// cross-sectional ranking of eligible symbols
	posrank:	#rank if(canRank, myROC, nan)

Strategy: ndx_rotate
	Side:	Long
	EntrySetup:	posrank > exclude and posrank <= numpos + exclude
	ExitRule:	BarsHeld = barsHold
	EntryTime:	ThisClose
	ExitTime:	ThisClose
	MaxPositions:	numpos
	Commission:	0.01
	// article code uses non-compounded position sizing
	Quantity:	100000 / numpos
	QtyType:	Value
	// force stats to report as if compounded as per the article
	Compounded:	True
—Marsten Parker
MHP Trading
mhp@mhptrading.com
BACK TO LIST
Python: August 2025
Following are a set of Python tools for implementing various concepts discussed in Markos Katsanos’ article in this issue, “A Sector Rotation Strategy.” Since an entire code set to replicate the author’s code set given in his article may be too lengthy to present here, I am taking the approach here of providing some Python-based building blocks that you can use to implement the strategy on your own. The framework will allow you to customize various aspects such as instrument selections, lookback period, rebalance period, and some other options. The tools provided here can accept different symbol sets, and strategy parameters can be changed.
The tools here can be used to perform a backtest by varying the parameters to help identify trades. Trades can be tabulated and performance metrics can be extracted. The screener can be used to implement the strategy on the desired rebalance days.
"""
Written By: Rajeev Jain, 2025-06-18
For TAS&C Magazine article "A Sector Rotation Strategy"

A set of python tools are provided to allow a user to implement various concepts
from the article. The tools can accept different symbol sets and strategy parameters can be changed.

The tools can be used to complete a full back test varying various parameters to identify trades. Trades can be tabulated and performance metrics can be extracted. The screener can be used to implement the strategy on the desired rebalance days.

"""

# import required python libraries
%matplotlib inline

import pandas as pd
import numpy as np
import yfinance as yf
import math
import datetime as dt
import matplotlib.pyplot as plt
import mplfinance as mpf

print(yf.__version__)


# Use Yahoo Finance python package to retrieve OHLCV data for desired symbol set

symbols = ['XLK', 'XLI', 'XLU', 'SPY', 'XLY', 'XLB', 'XLC', 'XLP', 'XLF', 'XLRE', 'XLE','XLV']
symbols = ['AMZN', 'GOOGL', 'MSFT', 'TSLA', 'NVDA', 'NFLX', 'META']
symbols = ['XLK', 'XLI', 'XLU', 'SPY', 'XLY', 'XLB', 'VOX', 'XLP', 'XLF', 'RWR', 'XLE','XLV']

start = "1990-01-01"
end = dt.datetime.now().strftime('%Y-%m-%d')
end = '2025-06-19'
ohlcv = yf.download(
    symbols,
    start,
    end,
    #interval='1mo',
    group_by="Ticker",
    auto_adjust=False,
    progress=True,

)
Ohlcv


# Helper routine to resample price data to different time aggregations

def resample_ohlcv_bizday(df, freq='W'):
    """
    Resample OHLCV data to business period ends (week, month, quarter, year).

    Parameters:
        df (pd.DataFrame): Daily OHLCV data with a DatetimeIndex and columns ['Open', 'High', 'Low', 'Close', 'Volume'].
        freq (str): One of 'W', 'M', 'Q', 'Y' for week, month, quarter, year.

    Returns:
        pd.DataFrame: Resampled OHLCV data with business period ends.
    """
    if not isinstance(df.index, pd.DatetimeIndex):
        raise ValueError("DataFrame index must be a DatetimeIndex")

    freq_map = {
        'W': 'W-FRI',       # Week ending on Friday (business week)
        'M': 'BM',          # Business Month End
        'Q': 'BQ',          # Business Quarter End
        'Y': 'BA'           # Business Year End
    }

    if freq not in freq_map:
        raise ValueError("Frequency must be one of 'W', 'M', 'Q', 'Y'")

    resampled = pd.DataFrame()
    grouped = df.resample(freq_map[freq])

    resampled['Open'] = grouped['Open'].first()
    resampled['High'] = grouped['High'].max()
    resampled['Low'] = grouped['Low'].min()
    resampled['Close'] = grouped['Close'].last()
    resampled['Volume'] = grouped['Volume'].sum()

    return resampled.dropna(how='any')  # Drop incomplete periods


# helper function which encapsulates all desired technical analysis
# calculations. This example presents how to calculate SMA, MOM and the
# Bear Market Filter indicators using the user defined parameters
# passed into the routine

def run_single_intrument_calculations(data, params):

    tsagg = params.get('tsagg')
    sma_period = params.get('sma_period')
    mom_period = params.get('mom_period')

    df = data.copy()

    if tsagg in ['W','M','Q','Y']:
        ticker = data['Ticker'].iloc[0]
        df = resample_ohlcv_bizday(df, freq=tsagg)
        df['Ticker'] = ticker

    df['SMA'] = df['Close'].rolling(sma_period).mean()
    df['MOM'] = 100*df['Close'].pct_change(mom_period)
    df['Bear Market Filter'] = np.where(df['SMA'] <= df['SMA'].shift(), 1, 0)

    return df.round(2)


# simple plot routine to visualize close, sma, momentum and bear market
# indicator values.

def simple_stock_plot(df):

    ticker = df['Ticker'].iloc[0]
    cols = ['Close', 'SMA']
    ax = df[cols].plot(title=f'Ticker={ticker}', grid=True, figsize=(9,4), marker='.')
    ax.set_xlabel('')

    cols = ['Bear Market Filter', 'MOM']
    ax = df[cols].plot(title=f'Bear Market Filter & MOM', grid=True, figsize=(9,2), secondary_y='Bear Market Filter', marker='.')
    ax.set_xlabel('')


# Here we build a simple plotting app which encapsulates all the helper
# functions. Example is using end date of 04-15-2025 and including 255 daily
# data samples (aka 1 year) of sample data

def simple_app(ohlcv, ticker, params):

    data = ohlcv[ticker].copy()
    data['Ticker'] = ticker
    data = run_single_intrument_calculations(data, params)
    simple_stock_plot(data)


ticker = 'XLY'
params = {
    'tsagg':'W',
    'sma_period':20,
    'mom_period':13
}
simple_app(ohlcv[:'2025-04-15'][-255:], ticker, params)
# Here a screener function is provided which cann be used to see which
# instruments are meeting the requirements of the screen. The screener is
# designed to be highly configurable such that teh date of the screen can
# be set, sma period can be set, momentum look back period can be set and
# bear market filter can be enabled or disable

def run_screener(ohlcv, params):

    symbols = list(ohlcv.columns.levels[0])
    df = pd.DataFrame()
    for ticker in symbols:

        # Extract single ticker price data into a format suitable for single ticker calculations
        data = ohlcv[ticker].copy()
        data['Ticker'] = ticker

        data = run_single_intrument_calculations(data, params)
        df = df.append(data[-1:])

    if params.get('bear_market_filter_ena'):
        df = df.sort_values(['Bear Market Filter', 'MOM'], ascending=[True, False])
    else:
        df = df.sort_values(['MOM'], ascending=[False])

    return df

params = {'tsagg':'W','sma_period':20, 'mom_period':13, 'bear_market_filter_ena':False}
run_screener(ohlcv[:'2025-03-07'], params)
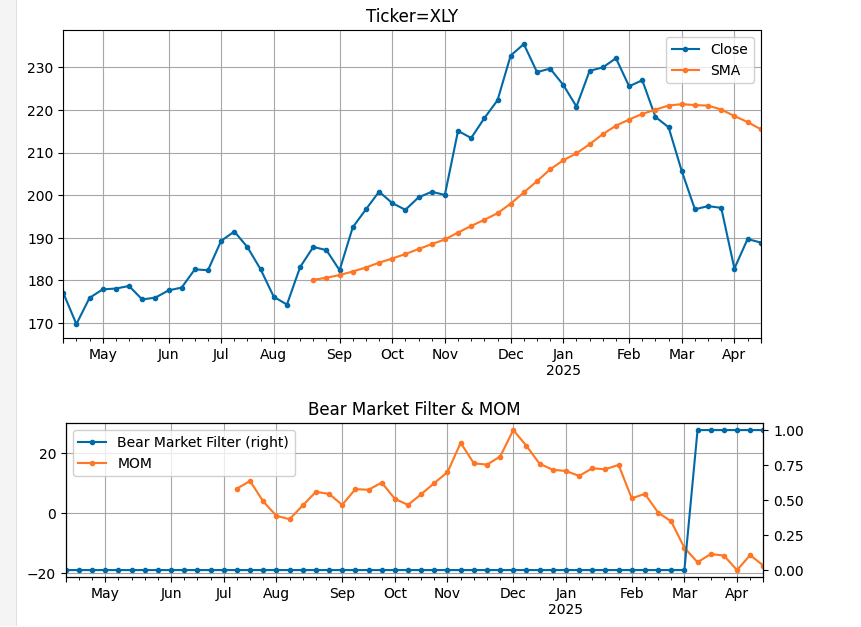
FIGURE 5: PYTHON. You can call the simple_app function to plot a single ticker. The example here shows a plot of XLY.
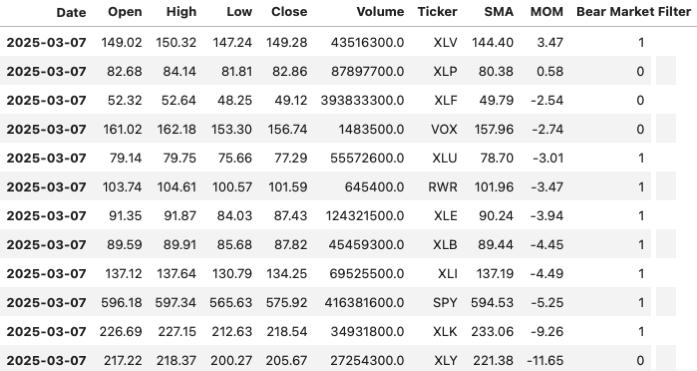
FIGURE 6: PYTHON. You can call the run_screener function to obtain screening results. The screener is designed to be configurable so that the date of the screen, the SMA period, and the momentum lookback period can be set, and a bear market filter can be enabled or disabled.
—Rajeev Jain
jainraje@yahoo.com
BACK TO LIST
Originally published in the August 2025 issue of
Technical Analysis of STOCKS & COMMODITIES magazine.
All rights reserved. © Copyright 2025, Technical Analysis, Inc.