TRADERS’ TIPS
April 2025
For this month’s Traders’ Tips, the focus is John F. Ehlers’ article in this issue, “The Ultimate Oscillator.” Here, we present the April 2025 Traders’ Tips code with possible implementations in various software.
You can right-click on any chart to open it in a new tab or window and view it at it’s originally supplied size, often much larger than the version printed in the magazine.
The Traders’ Tips section is provided to help the reader implement a selected technique from an article in this issue or another recent issue. The entries here are contributed by software developers or programmers for software that is capable of customization.

TradeStation: April 2025
In “The Ultimate Oscillator” in this issue, John Ehlers explains how he developed this indicator by using two highpass filters with different periods to remove lag. The UltimateOscillator closely follows price movements, making it highly responsive to changes in market conditions. A value above zero suggests a bullish trend, while a reading below zero indicates a bearish trend. Key turning points, where market direction changes, are identified when the rate of change crosses zero.
Function: $RMS
{
	RMS Function
	(C) 2015-2022 John F. Ehlers
}

inputs:
	Price( numericseries ),
	Length( numericsimple );

variables:
	SumSq( 0 ),
	count( 0 );

SumSq = 0;

for count = 0 to Length - 1
begin
	SumSq = SumSq + Price[count] * Price[count];
end;

If SumSq <> 0 then
	$RMS = SquareRoot(SumSq / Length);

Function: $HighPass
{
	$HighPass Function
 	(C) 2004-2024 John F. Ehlers
}

inputs:
	Price(numericseries),
	Period(numericsimple);

variables:
	a1( 0 ),
	b1( 0 ),
	c1( 0 ),
	c2( 0 ),
	c3( 0 );

a1 = ExpValue(-1.414 * 3.14159 / Period);
b1 = 2 * a1 * Cosine(1.414 * 180 / Period);
c2 = b1;
c3 = -a1 * a1;
c1 = (1 + c2 - c3) / 4;

if CurrentBar >= 4 then
 	$HighPass = c1*(Price - 2 * Price[1] + Price[2]) +
	 c2 * $HighPass[1] + c3 * $HighPass[2];
if Currentbar < 4 then
	$HighPass = 0;

Indicator: Ultimate Oscillator
{
	TASC APR 2025
	Ultimate Oscillator Indicator
	(C) 2024 John F. Ehlers
}

inputs:
	BandEdge( 20 ),
	Bandwidth( 2 );

variables:
	HP1( 0 ),
	HP2( 0 ),
	Signal( 0 ),
	RMS( 0 ),
	UltimateOsc( 0 );

HP1 = $HighPass(Close, Bandwidth*BandEdge);
HP2 = $HighPass(Close, BandEdge);

Signal = HP1 - HP2;
RMS = $RMS(Signal, 100);

if RMS <> 0 then
	UltimateOsc = Signal / RMS;

Plot1( UltimateOsc, "Ultimate OSC" );
Plot2( 0, "Zero Line" );
A sample chart is shown in Figure 1.

FIGURE 1: TRADESTATION. This demonstrates a daily chart of the continuous emini S&P 500 (ES) showing a portion of 2024 and 2025 with the indicator applied.
This article is for informational purposes. No type of trading or investment recommendation, advice, or strategy is being made, given, or in any manner provided by TradeStation Securities or its affiliates.
—John Robinson
TradeStation Securities, Inc.
www.TradeStation.com
BACK TO LIST

MetaStock: April 2025
John Ehlers’ article in this issue, “The Ultimate Oscillator,” introduces his indicator of the same name. Here is the formula to add that indicator to MetaStock:
{Ultimate Oscillator Indicator}
Len:= 20;
Bandwidth:= 2;
a1:= exp(-1.414*3.14159 / (Len*Bandwidth));
b1:= 2*a1*Cos(1.414*180 / (Len*Bandwidth));
c1:= -a1*a1;
x1:= (1 + b1 - c1) / 4;
HP1:= x1*(C - Ref(2*C,-1) + Ref(C, -2)) + b1*Prev + c1*Ref(Prev, -1);

a2:= exp(-1.414*3.14159 / Len);
b2:= 2*a2*Cos(1.414*180 / Len);
c2:= -a2*a2;
x2:= (1 + b2 - c2) / 4;
HP2:= x2*(C - Ref(2*C,-1) + Ref(C, -2)) + b2*Prev + c2*Ref(Prev, -1);

sig:= HP1 - HP2;
RMS:= sqrt( Sum( C * C, 100)/ 100 );
sig / RMS
—William Golson
MetaStock Technical Support
MetaStock.com
BACK TO LIST

Wealth-Lab.com: April 2025
We have recreated John Ehlers’ UltimateOscillator for use in Wealth-Lab based on Ehlers’ article in this issue, “The Ultimate Oscillator,” so that Wealth-Lab users can more easily get the benefit of this new oscillator.
Figure 2 shows an example of using the UltimateOscillator in a simple trading strategy. The strategy, built with Wealth-Lab’s Building Blocks feature, is shown in the inset. It buys when the UltimateOscillator is above 0 and exits when crossing below 0. Aggressive traders could investigate taking action when the indicator turns from +/- 2.0 standard deviations.

FIGURE 2: WEALTH-LAB. A simple trading strategy based on John Ehlers’ UltimateOscillator (30, 2) is demonstrated on a chart of the emini S&P 500 continuous futures contract. The oscillator is plotted in the bottom pane.
—Robert Sucher
Wealth-Lab team
www.wealth-lab.com
BACK TO LIST

NinjaTrader: April 2025
In “The Ultimate Oscillator” in this issue, John Ehlers presents a no-lag oscillator. The indicator discussed in the article is available for download at the following link for NinjaTrader 8:
Once the file is downloaded, you can import the indicator into NinjaTrader 8 from within the control center by selecting Tools → Import → NinjaScript Add-On and then selecting the downloaded file for NinjaTrader 8.
You can review the indicator source code in NinjaTrader 8 by selecting the menu New → NinjaScript Editor → Indicators folder from within the control center window and selecting the file.
A sample chart plotting the oscillator is shown in Figure 3.

FIGURE 3: NINJATRADER. The UltimateOscillator is plotted on a daily chart of the emini S&P 500 continuous contract (ES).
NinjaScript uses compiled DLLs that run native, not interpreted, to provide you with the highest performance possible.
—NinjaTrader, LLC
www.ninjatrader.com
BACK TO LIST

RealTest: April 2025
Provided here is coding for use in the RealTest platform to implement John Ehlers’ indicator described in his article in this issue, “The Ultimate Oscillator.”
Notes:
	John Ehlers "Ultimate Oscillator", TASC, April 2025
	Implements and plots the indicators as in the article

Import:
	DataSource:	Norgate
	IncludeList:	&ES
	StartDate:	2022-01-01
	EndDate:	2024-12-17
	SaveAs:	es.rtd

Settings:
	DataFile:	es.rtd
	BarSize:	Daily

Parameters:
	BandEdge:	30 // note author's code says 20 but chart in article shows 30
	BandWidth:	2
	RMSlen:	100

Data:
	// Common constants
	decay_factor:	-1.414 * 3.14159
	phase_angle:	1.414 * 180

	// Lengths
	length1:	BandWidth * BandEdge
	length2:	BandEdge

	// Price Value
	price:	Close

	// Highpass Filter Length1
	hp1a1:	exp(decay_factor / Length1)
	hp1b1:	2 * hp1a1 * Cosine(phase_angle / Length1)
	hp1c2:	hp1b1
	hp1c3:	-hp1a1 * hp1a1
	hp1c1:	(1 + hp1c2 - hp1c3) / 4
	HP1:	if(BarNum >= 4, hp1c1 * (price - 2 * price[1] + price[2]) + hp1c2 * HP1[1] + hp1c3 * HP1[2], 0)

	// Highpass Filter Length2
	hp2a1:	exp(decay_factor / Length2)
	hp2b1:	2 * hp2a1 * Cosine(phase_angle / Length2)
	hp2c2:	hp2b1
	hp2c3:	-hp2a1 * hp2a1
	hp2c1:	(1 + hp2c2 - hp2c3) / 4
	HP2:	if(BarNum >= 4, hp2c1 * (price - 2 * price[1] + price[2]) + hp2c2 * HP2[1] + hp2c3 * HP2[2], 0)

	// Signal
	Signal:	HP1 - HP2

	// Root Mean Square of Signal
	RMS:	Sqr(SumSQ(Signal, RMSlen) / RMSlen)

	// Ultimate Oscillator
	UltimateOsc:	Signal / RMS

Charts:
	UltimateOsc:	UltimateOsc {|}
	Zero:	0 {|}
Figure 4 plots an example of the UltimateOscillator in RealTest. The chart replicates Ehlers’ chart in his article using the parameters (30, 2), meaning that one highpass filter has a critical period of 30 and the other has a critical period of 60.
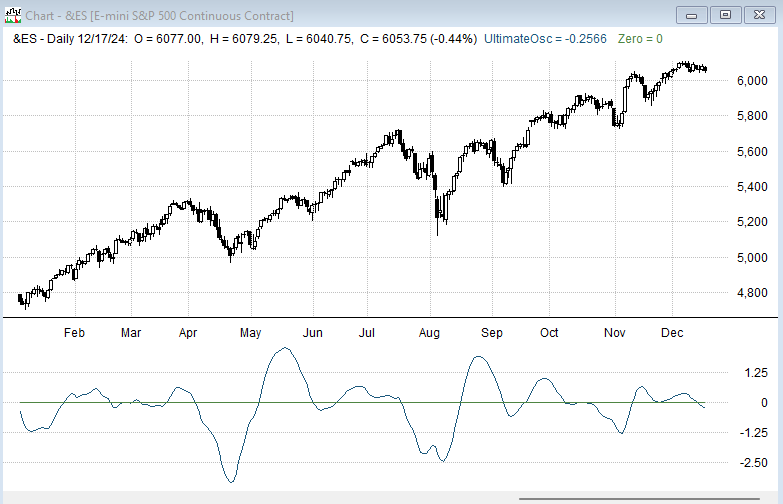
FIGURE 4: REALTEST. Here you an example of John Ehlers’ UltimateOscillator (30, 2) plotted on daily a chart of the emini S&P 500 continuous futures contract.
—Marsten Parker
MHP Trading
mhp@mhptrading.com
BACK TO LIST

TradingView: April 2025
The TradingView Pine Script code here implements the oscillator introduced in John Ehlers’ article in this issue, “The Ultimate Oscillator.” Ehlers’ oscillator uses Ehlers’ method of reducing lag.
//  TASC Issue: April 2025
//     Article: Less Lag In Momentum Indicators
//              The Ultimate Oscillator
//  Article By: John F. Ehlers
//    Language: TradingView's Pine Script® v6
// Provided By: PineCoders, for TradingView.com

//version=6
title =TASC 2025.04 Less Lag In Momentum Indicators +
 The Ultimate Oscillator
stitle = UO
indicator(title, stitle, false)

// import library for RMS function
import TradingView/ta/9 as ta

// function High Pass Filter.
HP (float src, int Period) =>
    float a0 = math.pi * math.sqrt(2.0) / Period
    float a1 = math.exp(-a0)
    float c2 = 2.0 * a1 * math.cos(a0)
    float c3 = -a1 * a1
    float c1 = (1.0 + c2 - c3) * 0.25
    float hp = 0.0
    if bar_index >= 4
        hp := c1 * (src - 2.0 * src[1] + src[2]) +
              c2 * nz(hp[1]) + c3 * nz(hp[2])
    hp

UO (float src, int Bandwidth=2, int BandEdge=20) =>
    float HP1 = HP(src, Bandwidth * BandEdge)
    float HP2 = HP(src, BandEdge)
    float Signal = HP1 - HP2

    float RMS = ta.rms(Signal, 100)
    float UO = RMS == 0 ? 0 : Signal / RMS
    UO

float src = input.source(close, 'Source:')
int Bandwidth = input.int(2, 'Bandwidth:')
int BandEdge = input.int(20, 'BandEdge:')

UO = UO (src, Bandwidth, BandEdge)

plot(UO , 'Ultimate Oscillator', color.red, 2)

hline(0)
The script is available on TradingView from the PineCodersTASC account https://www.tradingview.com/u/PineCodersTASC/#published-scripts.
An example chart is shown in Figure 5.
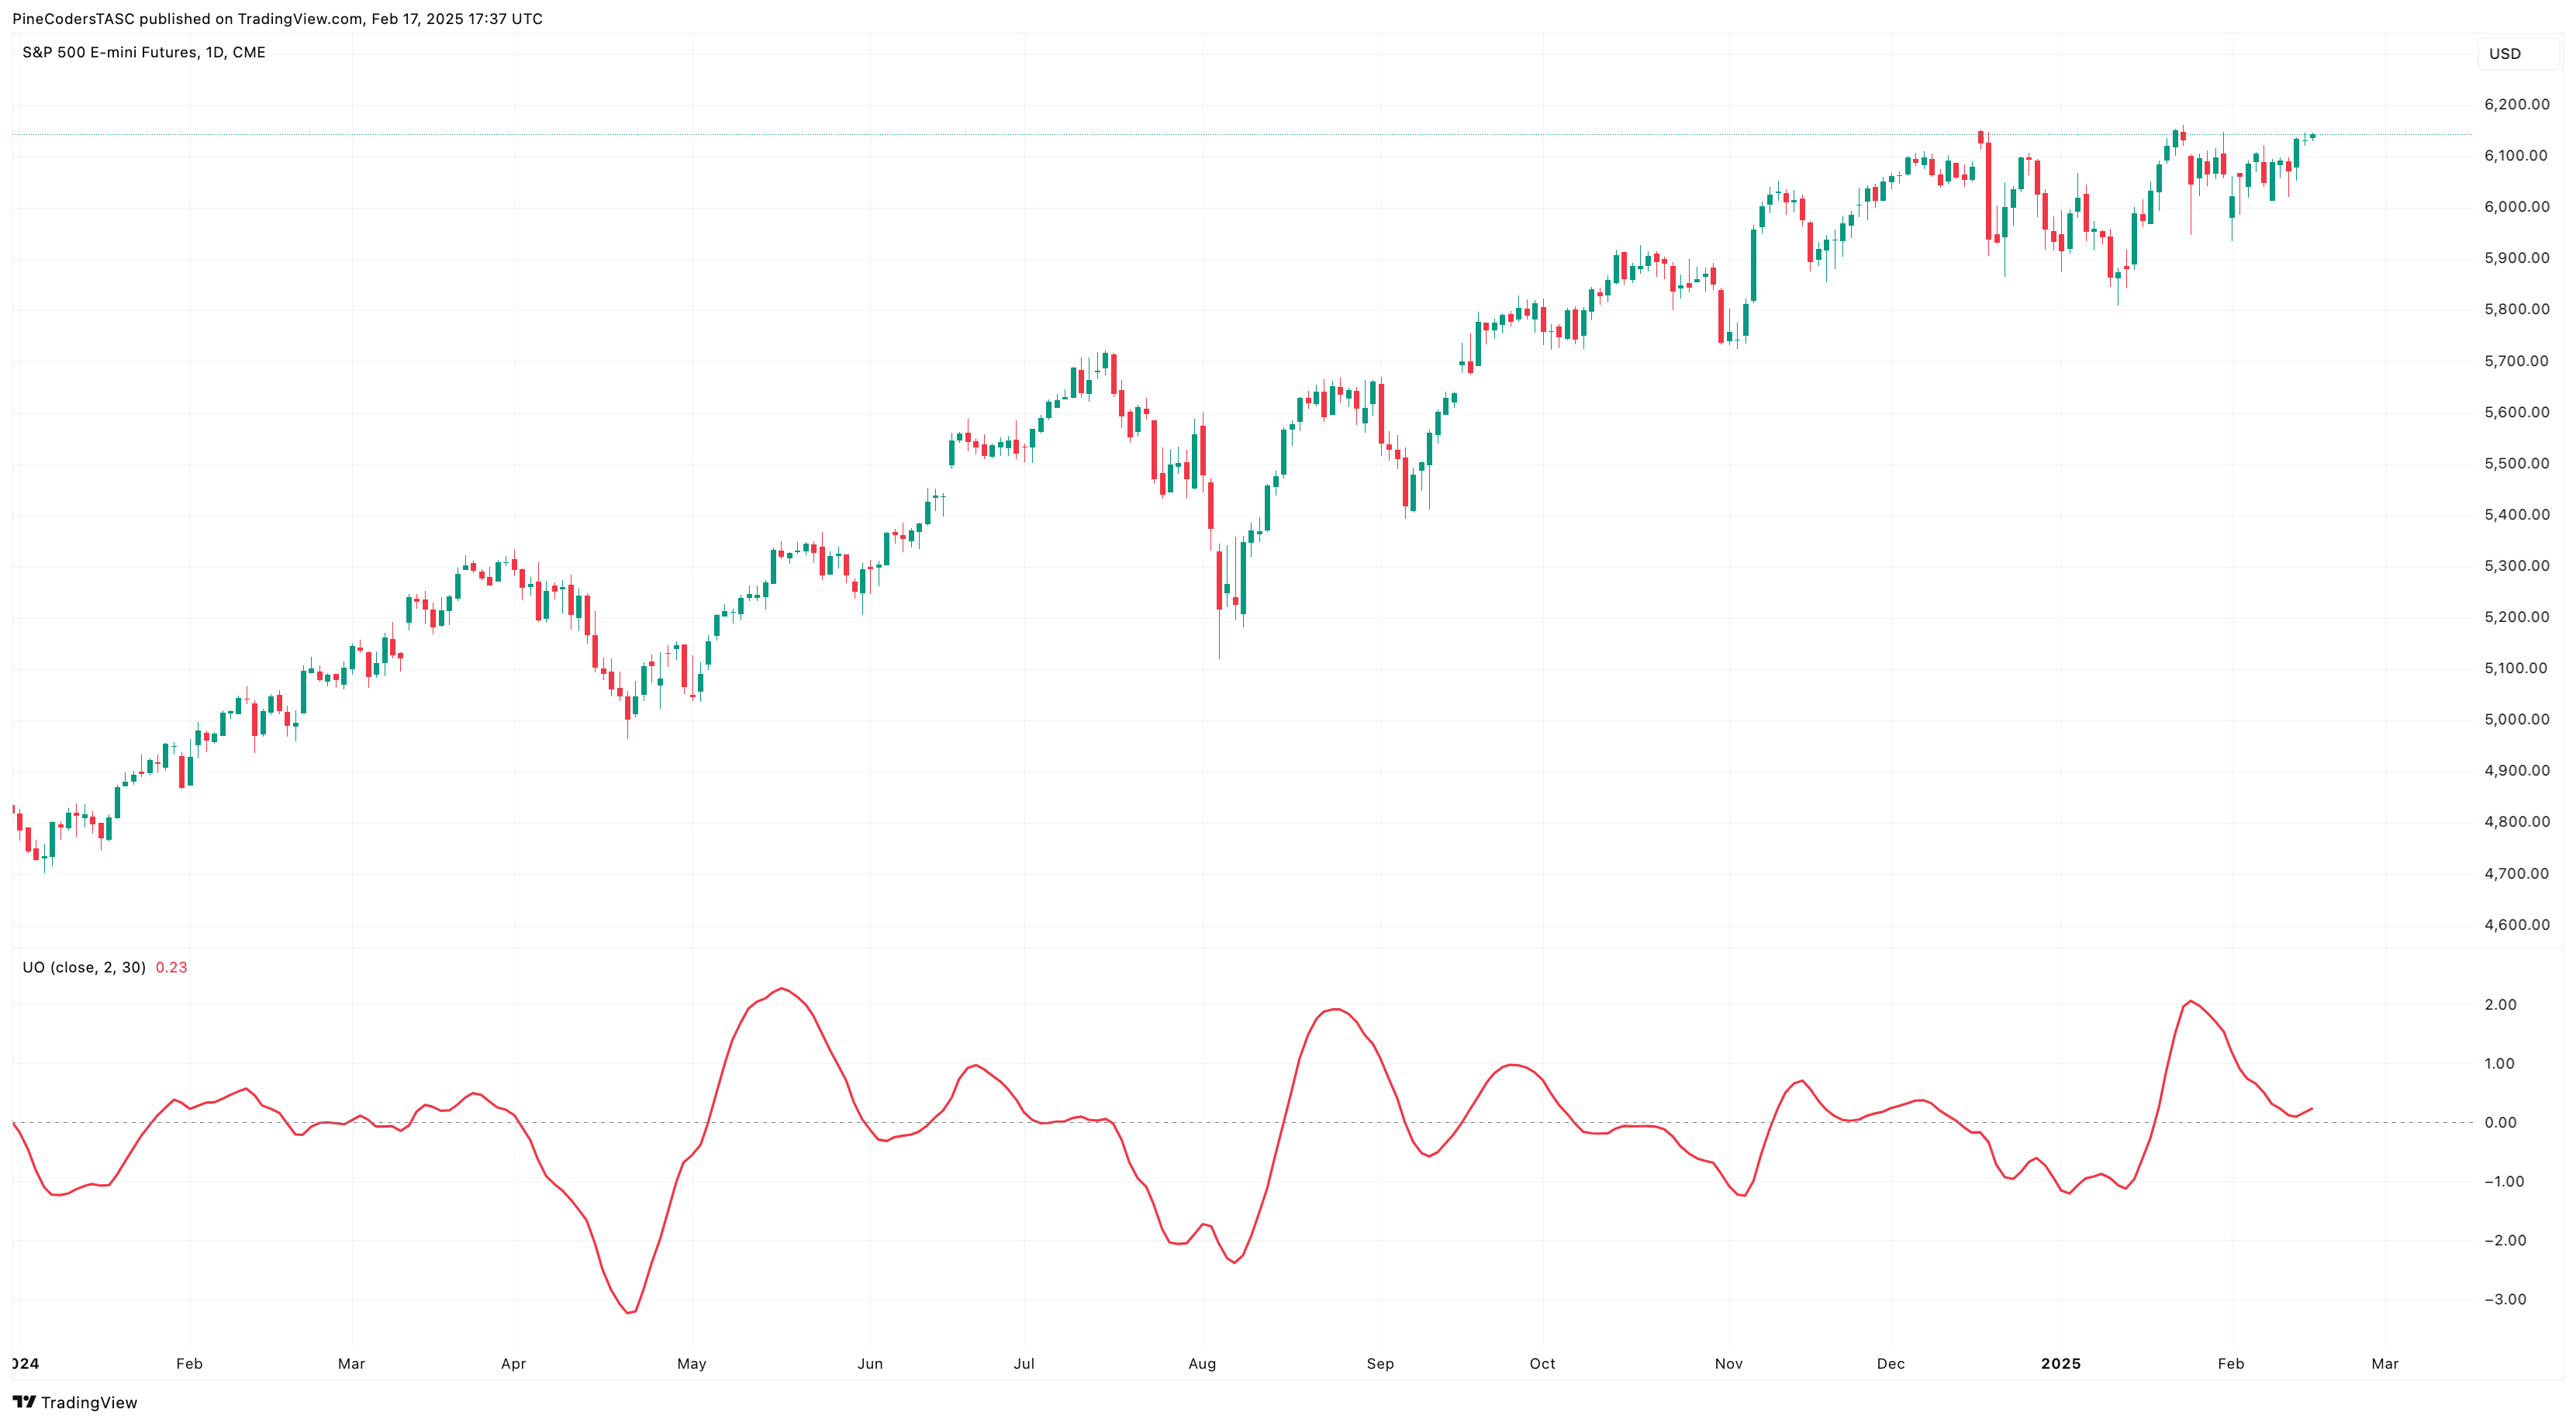
FIGURE 5: TRADINGVIEW. Here you an example of the UltimateOscillator on a chart of the emini S&P 500 futures (ES).
—PineCoders, for TradingView
www.TradingView.com
BACK TO LIST

Neuroshell Trader: April 2025
The UltimateOscillator indicator introduced in John Ehlers’ article in this issue can be easily implemented in NeuroShell Trader using NeuroShell Trader’s ability to call external dynamic linked libraries. Dynamic linked libraries can be written in C, C++ and Power Basic.
After moving the code given in the article to your preferred compiler and creating a DLL, you can insert the resulting indicator as follows:
- Select “New Indicator …” from the insert menu.
- Choose the External Program & Library Calls category.
- Select the appropriate External DLL Call indicator.
- Setup the parameters to match your DLL.
- Select the finished button.
Users of NeuroShell Trader can go to the Stocks & Commodities section of the NeuroShell Trader free technical support website to download a copy of this or any previous Traders’ Tips.

FIGURE 6: NEUROSHELL TRADER. This example NeuroShell Trader chart shows the UltimateOscillator indicator on a chart of the emini S&P 500.
—Ward Systems Group, Inc.
sales@wardsystems.com
www.neuroshell.com
BACK TO LIST

The Zorro Project: April 2025
In his article in this issue, “The Ultimate Oscillator,” John Ehlers introduces his UltimateOscillator, which is an indicator that seeks to have the lag removed. It is built from the difference of two highpass filters, and the author presents it to indicate the market direction with almost no lag.
The highpass function below is a straightforward conversion of the EasyLanguage code in Ehlers’ article to C:
var HighPass3(vars Data,int Period)
{
  var a1 = exp(-1.414*PI / Period);
  var c2 = 2*a1*cos(1.414*PI/2 / Period);
  var c3 = -a1*a1;
  var c1 = (1.+c2-c3) / 4;
  vars HP = series(0,3);
  return HP[0] = c1*(Data[0]-2*Data[1]+Data[2])
    + c2*HP[1] + c3*HP[2];
}
We’ve named the function HighPass3 in Zorro because we already have three other highpass filters in the Zorro indicator library, all with different code. Ehlers’ UltimateOscillator is the difference of two highpass filters with different periods, and scaled by its root mean square for converting the output to standard deviations. Since Zorro has already a sum of squares function, the code is somewhat simpler than in Ehlers’ article:
var UltimateOsc(vars Data,int Edge,int Width)
{
  vars Signals = series(HighPass3(Data,Width*Edge)-HighPass3(Data,Edge));
  var RMS = sqrt(SumSq(Signals,100)/100);
  return Signals[0]/fix0(RMS);
}
For comparing lag and smoothing power, we can apply the UltimateOscillator to an S&P 500 chart from 2024 using the following code:
void run()
{
  BarPeriod = 1440;
  StartDate = 20240101;
  EndDate = 20241231;
  asset("SPX500");
  plot("UltOsc", UltimateOsc(seriesC(),20,2),LINE,RED);
}
The resulting chart (Figure 7) replicates Ehlers’ chart in his article. The oscillator output is the red line. We can see that the UltimateOscillator reproduces the market trend well and with no visible lag.
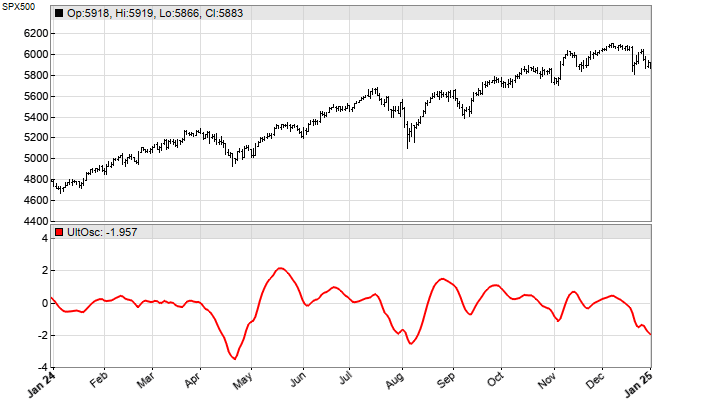
FIGURE 7: ZORRO. Here is an example of the UltimateOscillator plotted on a chart of the S&P 500 index. The oscillator is the red line.
The code can be downloaded from the 2025 script repository on https://financial-hacker.com. The Zorro platform can be downloaded from https://zorro-project.com.
—Petra Volkova
The Zorro Project by oP group Germany
https://zorro-project.com
BACK TO LIST
Python: April 2025
Here is Python code based on John Ehlers’ article in this issue, “The Ultimate Oscillator.” An example chart plotting the UltimateOscillator is shown in Figure 8.
#
# import required python libraries
#
import pandas as pd
import numpy as np
import matplotlib.pyplot as plt
import yfinance as yf
import math

#
# Retrieve S&P 500 daily price data from Yahoo Finance
#

symbol = '^GSPC'
#symbols = ['^IXIC']
ohlcv = yf.download(symbol, start="2000-01-01", end="2025-02-21", group_by="Ticker")ohlcv = ohlcv[symbol]                 # un-comment for older versions of yf  module
ohlcv


#
# Python code for highpass, rms and ultimate oscillator functions highlighted in the article
#

def calc_highpass(price, period):

    a1 = np.exp(-1.414 * np.pi / period)
    b1 = 2 * a1 * np.cos(math.radians(1.414 * 180 / period))
    c2 = b1
    c3 = -a1 * a1
    c1 = (1 + c2 - c3)/4

    out_values = []
    for i in range(len(price)):
        if i >= 4:
            out_values.append(
                c1*(price[i] - 2*price[i-1] + price[i-2]) + c2*out_values[i-1] + c3*out_values[i-2]
            )
        else:
            out_values.append(price[i])

    return out_values


def calc_rms(price):

    length = len(price)
    sum_sq = 0
    for count in range(length):
        sum_sq += price[count] * price[count]
    return np.sqrt(sum_sq / length)


def calc_ultimate_oscillator(close, band_edge, band_width):

    df = close.to_frame('Close')
    df['HP1'] = calc_highpass(df['Close'], band_width * band_edge)
    df['HP2'] = calc_highpass(df['Close'], band_edge)
    df['Signal'] = df['HP1'] - df['HP2']
    df['RMS'] = df['Signal'].rolling(100).apply(calc_rms)
    df['UO'] = df['Signal']/df['RMS']

    return df['UO']

#
# S&P500 applying EMA and Ultimate Oscillator
#

band_edge=30
band_width=2
length = band_edge

df = ohlcv.copy()
df['EMA'] = calc_ema(df['Close'], period=length)
df['UO'] = calc_ultimate_oscillator(df['Close'], band_edge, band_width)

# Plot using MatPlotLib python package
plot_uo(df['2024':'2024'])
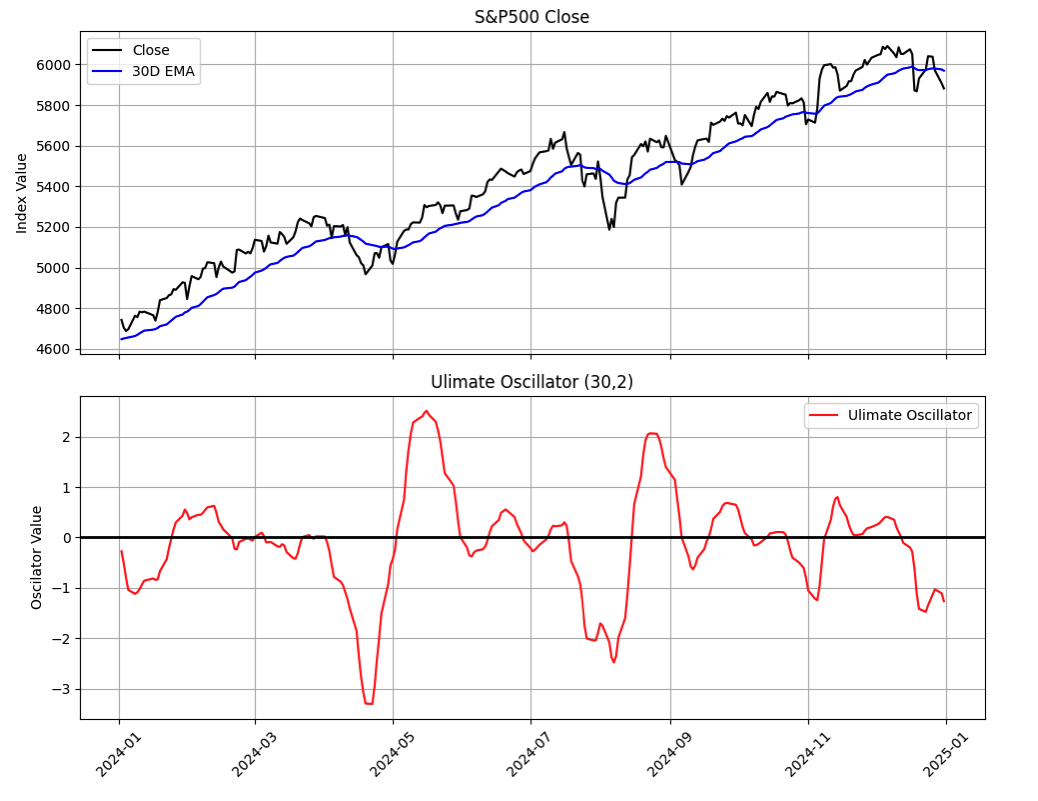
FIGURE 8: PYTHON. The UltimateOscillator is shown plotted on a daily chart of the S&P 500 index. The chart replicates John Ehlers’s chart in his article, using (30, 2) as the input parameters, meaning that one highpass has a critical period of 30 and the other has a critical period of 60.
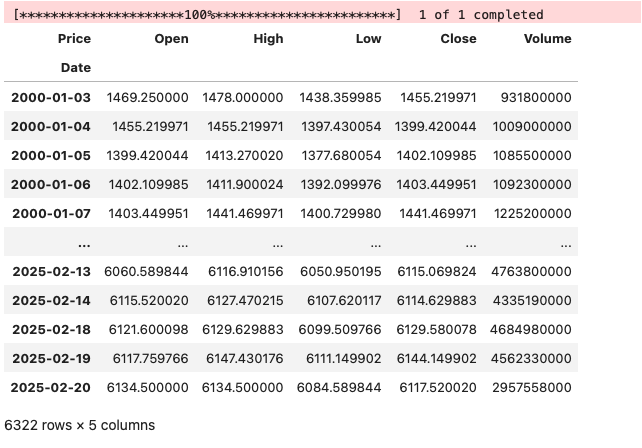
FIGURE 9: PYTHON. S&P 500 daily price data is retrieved from Yahoo Finance using Python code and Python libraries.
—Rajeev Jain
jainraje@yahoo.com
BACK TO LIST
Microsoft Excel: April 2025
In “The Ultimate Oscillator” in this issue, John Ehlers builds on his UltimateSmoother indicator to create an oscillator with very minimal lag. The result is an oscillator that is very sensitive to shifts in momentum (see Figure 10).

FIGURE 10: EXCEL. The UltimateOscillator is seen on a chart of ES. This chart is similar to Figure 1 from John Ehlers’ article in this issue.
In his article, Ehlers suggests that one can find exact turning points by applying rate of change (ROC) to the UltimateOscillator and use the ROC zero crossings to pinpoint UltimateOscillator turning points. (See Figure 11.)

FIGURE 11: EXCEL. Here you see rate-of-change (ROC) zero crossings and corresponding turning points in the UltimateOscillator.
To download this spreadsheet: The spreadsheet file for this Traders’ Tip can be downloaded here. To successfully download it, follow these steps:
- Right-click on the Excel file link, then
- Select “save as” (or “save target as”) to place a copy of the spreadsheet file on your hard drive.
Additional note: This spreadsheet also contains an updated repairs mechanism. See the “Traders Tips Repairs” tab for details.
—Ron McAllister
Excel and VBA programmer
rpmac_xltt@sprynet.com
BACK TO LIST
Originally published in the April 2025 issue of
Technical Analysis of STOCKS & COMMODITIES magazine.
All rights reserved. © Copyright 2025, Technical Analysis, Inc.


