TRADERS’ TIPS
December 2024
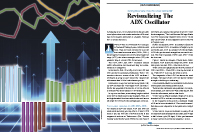
For this month’s Traders’ Tips, the focus is Neil Jon Harrington’s article in the October 2024 issue, “Revisualizing The ADX Oscillator.” Here, we present the December 2024 Traders’ Tips code with possible implementations in various software.
You can right-click on any chart to open it in a new tab or window and view it at it’s originally supplied size, often much larger than the version printed in the magazine.
The Traders’ Tips section is provided to help the reader implement a selected technique from an article in this issue or another recent issue. The entries here are contributed by software developers or programmers for software that is capable of customization.

TradeStation: December 2024
In his October 2024 article in Technical Analysis of Stocks & Commodities magazine, “Revisualizing The ADX Oscillator,” Neil Jon Harrington presents an enhanced ADX oscillator based on the original ADX and DMI indicators created by J. Welles Wilder in the 1970s. The Harrington ADX Oscillator applies smoothing and includes a color-coded histogram for a more perceptive display of trend direction and strength.
Indicator: Ultimate Strength Index (USI)

{
	TASC DEC 2024
	Harrington ADX Oscillator
	Copyright: Neil Jon Harrington, NJH Group
 	© Copyright 2024

  	Description: Display the ADX and DMI information
  	as a histogram above or below zero. The color
  	reflects the direction, slope, and location of
  	the ADX. The histogram is above zero when
  	DMI+ > DMI-, and vice versa. Tradeable when the
  	ADX is above/below the Low Threshold and sloping
  	in the direction of the Trend.
}

inputs:
	ADXLength( 10 ),
	ADXLowThreshold( 15 ),
	ADXHighThreshold( 40 ),
	ADXSmoothLength( 1 ),
	OBUpColor( Cyan ),
	OBWeakUpColor( DarkCyan ),
	UpColor( Green ),
	WeakUpColor( DarkGreen ),
	NeutralUpColor( DarkGray ),
	NeutralDownColor( Black ),
	WeakDownColor( DarkRed ),
	DownColor( Red ),
	OSWeakDownColor( DarkMagenta ),
	OSDownColor( Magenta );

variables:
	oDMIPlus( 0 ),
	oDMIMinus( 0 ),
	oDMI( 0 ),
	oADX( 0 ),
	oADXR( 0 ),
	oVolty( 0 ),
	NegativeADX( 0 ),
	SmoothedPlus( 0 ),
	SmoothedMinus( 0 ),
	NetDMI( 0 ),
	ADXColor( White ),
	TrendColor( White );

Value1 = DirMovement(High, Low, Close, ADXLength,
 oDMIPlus, oDMIMinus, oDMI, oADX, oADXR, oVolty);
NegativeADX = -oADX;
SmoothedPlus = Average(oDMIPlus, ADXSmoothLength);
SmoothedMinus = Average(oDMIMinus, ADXSmoothLength);
NetDMI = SmoothedPlus - SmoothedMinus;

if oADX > oADX[1] then
	ADXColor = NeutralUpColor;
if oADX < oADX[1] then
	ADXColor = NeutralDownColor;

switch( NetDMI )
begin
	case >= 0:
		if (oADX >= ADXHighThreshold) then
		begin
			if (oADX > oADX[1]) then
				ADXColor = OBUpColor;
			if (oADX < oADX[1]) then
				ADXColor = OBWeakUpColor;
		end;

		if (oADX >= ADXLowThreshold)
		 and (oADX <= ADXHighThreshold) then
		begin
			if (oADX > oADX[1]) then
				ADXColor = UpColor;
			if (oADX < oADX[1]) then
				ADXColor = WeakUpColor;
		end;

		Plot1 (oADX,"ADXO", ADXColor);

	case < 0:
		if(oADX >= ADXHighThreshold) then
		begin
			if(oADX > oADX[1]) then
				ADXColor = OSDownColor;
			if(oADX < oADX[1]) then
				ADXColor = OSWeakDownColor;
		end;

		if (oADX >= ADXLowThreshold)
		 and (oADX <= ADXHighThreshold) then
		begin
			if (oADX > oADX[1]) then
				ADXColor = DownColor;
			if (oADX < oADX[1]) then
				ADXColor = WeakDownColor;
		end;

		Plot1 (NegativeADX,"ADXO",ADXColor);

end; // Switch NetDMI

Plot2( ADXHighThreshold, "HiThresh" );
Plot3( ADXLowThreshold, "LoThresh" );
Plot4( 0, "Zero");
Plot5( -ADXLowThreshold, "-LoThresh" );
Plot6( -ADXHighThreshold, "-HiThresh" )
A sample chart is shown in Figure 1.
FIGURE 1: TRADESTATION. This shows a daily chart of the continuous emini NASDAQ-100 futures contract with the indicator applied and the DMI indicator applied above it.
This article is for informational purposes. No type of trading or investment recommendation, advice, or strategy is being made, given, or in any manner provided by TradeStation Securities or its affiliates.
—John Robinson
TradeStation Securities, Inc.
www.TradeStation.com
BACK TO LIST

NinjaTrader: December 2024
The indicator introduced in Neil Jon Harrington’s October 2024 article in Technical Analysis of Stocks & Commodities magazine, “Revisualizing The ADX Oscillator,” is now available for download at the following link for NinjaTrader 8:
Once the file is downloaded, you can import the indicator into NinjaTrader 8 from within the control center by selecting Tools → Import → NinjaScript Add-On and then selecting the downloaded file for NinjaTrader 8.
You can review the source code in NinjaTrader 8 by selecting the menu New → NinjaScript Editor → Indicators folder from within the control center window and selecting the indicator file.
A sample chart displaying the indicator is shown in Figure 2.
FIGURE 2: NINJATRADER. This shows the indicator displayed on a daily chart of the emini Nasdaq-100 futures (NQ).
NinjaScript uses compiled DLLs that run native, not interpreted, to provide you with the highest performance possible.
—Chelsea Bell
NinjaTrader, LLC
www.ninjatrader.com
BACK TO LIST

MetaStock: December 2024
Neil Jon Harrington’s article in the October 2024 issue, “Revisualizing The ADX oscillator,” introduces a reimagining of the ADX indicator. Here is the formula to add that indicator to MetaStock.
Please note that the suggested colors are in comments and will not change the display. MetaStock 19 will prompt you for the input values when you plot the indicator in your chart. Click the color/style tab to set the color and tell MetaStock to display the indicator lines as histograms. If you click the defaults button at the bottom of that tab, you can save your settings as the default, so you do not have to adjust the line style or colors when you add the indicator to other charts.
Dynamic ADX Histogram:

{aka. Harrington ADX Oscillator}
pds:= Input("ADX length", 2, 50, 10);
loth:= Input("Low Threshold", 5, 30, 15);
hith:= Input("High Threshold", 30, 60, 40);
spds:= Input("Smooth Length", 1, 5, 1);

base:= ADX(pds);
smpdi:= Mov(PDI(pds), spds, s);
smmdi:= Mov(MDI(pds), spds, s);
netdmi:= smpdi - smmdi;

{OB up - Cyan}
if(netdmi > 0 AND base >= hith and base > Ref(base, -1), base, 0);
{OB weak up - Dark Cyan}
if(netdmi > 0 AND base >= hith and base <= Ref(base, -1), base, 0);
{up - Green}
if(netdmi > 0 AND base >= loth AND base < hith AND base > Ref(base, -1), base, 0);
{weak up - Dark Green}
if(netdmi > 0 AND base >= loth AND base < hith AND base <= Ref(base, -1), base, 0);
{neutral up - Dark Gray}
if(netdmi > 0 AND base < loth, base, 0);
{neutral down - Black}
if(netdmi <= 0 AND base < loth, -base, 0);
{weak down - Dark Red}
if(netdmi <= 0 AND base >= loth AND base < hith AND base <= Ref(base, -1), -base, 0);
{down - Red}
if(netdmi <= 0 AND base >= loth AND base < hith AND base > Ref(base, -1), -base, 0);
{OS weak down - Dark Magenta}
if(netdmi <= 0 AND base >= hith and base <= Ref(base, -1), -base, 0);
{OS down - Magenta}
if(netdmi <= 0 AND base >= hith and base > Ref(base, -1), -base, 0);
—William Golson
MetaStock Technical Support
www.MetaStock.com
BACK TO LIST

Wealth-Lab.com: December 2024
Neil Jon Harrington, in his October 2024 article in Technical Analysis of Stocks & Commodities magazine titled “Revisualizing The ADX Oscillator,” introduces a technique in which he reenvisions the classic ADX indicator developed in the 1970s by J. Welles Wilder to create what he feels is a more useful and intuitive indicator for traders. We have now prepared this indicator for use in Wealth-Lab for Wealth-Lab users.
Users will find this new multicolored ADX indicator as “ADXHist” in our “TASC Indicator library.” You can drag and drop it onto a chart and use it as you would any other indicator in strategies that you may wish to create. For a demonstration of this, see Figure 3, which shows an example strategy based on this new indicator, using the convenient Building Blocks feature in Wealth-Lab to set up the strategy rules without having to write code.
FIGURE 3: WEALTH-LAB. Users can take advantage of the convenient Building Blocks feature in Wealth-Lab to set up strategy rules to develop a strategy without the need for the user to write code. Here you see an example strategy.
In our example strategy, note that even without any sort of optimization, the simple two-indicator strategy shown in Figure 4 for demonstration purposes approximates the QQQ’s buy and hold return over the same period, with far less risk and exposure.
FIGURE 4: WEALTH-LAB. This sample chart demonstrates the multicolored indicator on a chart of the daily QQQ.
—Robert Sucher
Wealth-Lab team
www.wealth-lab.com
BACK TO LIST

TradingView: December 2024
The TradingView Pine Script code presented here implements the dynamic ADX histogram indicator that is introduced by Neil Jon Harrington in his article in the October 2024 issue, “Revisualizing The ADX Oscillator.”
//  TASC Issue: December 2024
//     Article: Revisualizing The ADX Oscillator
//  Article By: Neil Jon Harrington
//    Language: TradingView's Pine Script™ v5
// Provided By: PineCoders, for tradingview.com


//@version=5
title ='TASC 2024.11 Dynamic ADX Histogram'
stitle = 'DADX'
indicator(title, stitle, false)


int ADX_Length = input.int(10)
int ADX_THLo = input.int(15)
int ADX_THHi = input.int(40)
int ADX_Smooth = input.int(15)


string gu = 'Colors, Up:'
string gn = 'Neutral:'
string gd = 'Down:'
color col_OBUp = input.color(#00ffff, gu, inline=gu)
color col_OBWUp = input.color(#008b8b, '', inline=gu)
color col_Up = input.color(#09ff00, '', inline=gu)
color col_WUp = input.color(#048000, '', inline=gu)
color col_NUp = input.color(#383838, gn, inline=gn)
color col_Ndn = input.color(#000000, '', inline=gn)
color col_Wdn = input.color(#680000, gd, inline=gd)
color col_dn = input.color(#ff0000, '', inline=gd)
color col_OSWdn = input.color(#5c001f, '', inline=gd)
color col_OSdn = input.color(#ff00aa, '', inline=gd)


[DIP, DIN, DIA] = ta.dmi(ADX_Length, ADX_Smooth)
float NADX = -DIA
float SP = math.avg(DIP, ADX_Smooth - ADX_Length)
float SM = math.avg(DIN, ADX_Smooth - ADX_Length)
float NET = SP - SM


bool isDIAup = DIA > DIA[1]
bool isDIAdn = DIA < DIA[1]


color col = color(na)
if isDIAup
    col := col_NUp
if isDIAdn
    col := col_Ndn


float hp = na
float hn = na
switch
    NET >= 0 =>
        if DIA >= ADX_THHi
            if isDIAup
                col := col_OBUp
            if isDIAdn
                col := col_OBWUp
        if DIA >= ADX_THLo and DIA <= ADX_THHi
            if isDIAup
                col := col_Up
            if isDIAdn
                col := col_WUp
        hp := DIA
    NET < 0 =>
        if DIA >= ADX_THHi
            if isDIAup
                col := col_OSdn
            if isDIAdn
                col := col_OSWdn
        if DIA >= ADX_THLo and DIA <= ADX_THHi
            if isDIAup
                col := col_dn
            if isDIAdn
                col := col_Wdn
        hn := NADX


plot(hp, "ADXO", col, 1, plot.style_columns)
plot(hn, 'ADXO', col, 1, plot.style_columns)


hline(ADX_THHi, 'High Threshold')
hline(ADX_THLo, 'Low Threshold')
hline(0, 'Zero')
hline(-ADX_THLo, 'Low Threshold')
hline(-ADX_THHi, 'High Threshold')
The script is available on TradingView from the PineCodersTASC account: https://www.tradingview.com/u/PineCodersTASC/#published-scripts.
An example chart is shown in Figure 5.
—PineCoders, for TradingView
www.TradingView.com
BACK TO LIST

Neuroshell Trader: December 2024
The new dynamic ADX histogram oscillator introduced by Neil Jon Harrington in his October 2024 article in Technical Analysis of Stocks & Commodities magazine, “Revisualizing The ADX Oscillator,” can be easily implemented in NeuroShell Trader. Simply select “new indicator” from the insert menu and use the indicator wizard in NeuroShell Trader to set up the indicators as follows:
ADX:		ADX(High,Low,Close,10,10),
NetDMI:		Sub(Avg(PlusDI(High,Low,Close,10),5),Avg(MinusDI(High,Low,Close,10),5))
Dynamic ADX:	IfThenElse(A>B(NetDMI,0), ADX, Neg(ADX))
FIGURE 6: NEUROSHELL TRADER. This NeuroShell Trader chart demonstrates the oscillator on the emini Nasdaq-100.
Users of NeuroShell Trader can go to the Stocks & Commodities section of the NeuroShell Trader free technical support website to download a copy of this or any previous Traders’ Tips.
—Ward Systems Group, Inc.
sales@wardsystems.com
www.neuroshell.com
BACK TO LIST

AIQ: December 2024
The importable AIQ EDS file based on Neil Jon Harrington’s article in the October 2024 issue of Technical Analysis of Stocks & Commodities magazine, titled “Revisualizing The ADX Oscillator,” can be obtained on request via rdencpa@gmail.com. The code is also shown here:
!DMI & ADX indicators
!Coded by Rich Denning, 10/14/24

Dailyrange is [high]-[low].
Ycloseh is abs(val([close],1)-[low]).
Yclosel is abs(val([close],1)-[high]).
Trange1 is Max(Dailyrange,Ycloseh).
Trange is Max(Trange1,Yclosel).

define HarringtonLength 10.
define sLen 5.
define ADXlow 15.
define ADXHigh 40.

!To convert Wilder averaging to exponential averaging use this formula:
!ExponentialPeriods = 2 * WilderPeriod - 1.

days is 2 * HarringtonLength - 1.

!+DM CODE:
yhigh is val([high],1).
ylow is val([low],1).
rhigh is ([high]-yhigh).
rlow is (ylow-[low]).
DMplus is iff(rhigh > 0 and rhigh > rlow, rhigh, 0).
DMminus is iff(rlow > 0 and rlow >= rhigh, rlow, 0).

AvgPlusDM is expAvg(DMplus,days).
AvgMinusDM is expavg(DMminus,days).

!AVERAGE TRUE RANGE:
ATR is expAvg(Trange,Days).
!DMI CODE:
PlusDMI is (AvgPlusDM/ATR)*100.
sPlusDMI is simpleavg(PlusDMI,sLen).
MinusDMI is AvgMinusDM/ATR*100.
sMinusDMI is simpleavg(MinusDMI,sLen).

!PLOT sDIdiff as historigram:
  sDIdiff is sPlusDMI-sMinusDMI.
  ZERO if sPlusDMI = 0 and sMinusDMI = 0.
  sDIsum is sPlusDMI+sMinusDMI.
  sDX is iff(ZERO,100,abs(sDIdiff)/sDIsum*100).
!PLOT ADX as single line indicator with support at 15:
  sADX is ExpAvg(sDX,days).

Green if sDIdiff > 0 and sADX > ADXlow.
Red if sDIdiff <= 0 and sADX <= ADXlow.
Code for the author’s indicator is set up in the AIQ EDS code file. Figure 7 demonstrates the indicator on a daily chart of the QQQ. Note that I did not implement here all of the colors the author uses. I implemented the strong up (green), strong down (red) and neutral (yellow).
FIGURE 7: AIQ. The indicator is displayed on a chart of the NASDAQ-100 ETF (QQQ).
—Richard Denning
rdencpa@gmail.com
for AIQ Systems
BACK TO LIST

Trade Navigator: December 2024
A downloadable file has now been created to make it easy for Trade Navigator users to implement the indicator introduced in Neil Jon Harrington’s October 2024 article, “Revisualizing The ADX Oscillator.”
The downloadable library filename is “SC202412.” To download it, click on the blue telephone button, select “download special file,” then erase the word “upgrade” in the dialog box and type in “SC202412.” Then click the start button. When prompted to upgrade, click the yes button. If prompted to close all software, click continue. Your library file will then download.
The template can be inserted onto your chart by opening the charting drop-down menu, then selecting the templates command, then selecting the “Revisualizing The ADX Oscillator” template.
An example chart is shown in Figure 8.
FIGURE 8: TRADE NAVIGATOR. The indicator is displayed on a daily chart of the emini Nasdaq-100 futures (NQ).
If you need technical support with using the indicators and/or template, call 719 284-1616 or click on the live chat tool located under Trade Navigator’s help menu and at the top of our homepage, www.TradeNavigator.com. Support hours are M–F 8am–5pm US Mountain Time. Happy trading!
—Genesis Financial Data
Tech support 719 884-0245
www.TradeNavigator.com
BACK TO LIST
Microsoft Excel: December 2024
In “Revisualizing The ADX Oscillator” in the October 2024 issue of Technical Analysis of Stocks & Commodities magazine, Neil Jon Harrington introduces a new version of the classic ADX that he developed. He starts with a standard ADX “strength of trend” indicator and adds a simple approach to demonstrating trend direction using intermediate values derived as part of the standard ADX calculation.
Step 1 of Harrington’s technique takes the difference between the DMI+ and DMI− values to determine trend direction and thus project the ADX value above or below zero. The envelope shown in the bottom subchart of Figure 9 matches (and reflects) the ADX tracing shown in the middle panel of the chart.
Step 2 of Harrington’s technique builds a histogram of the ADX with bars above zero designating a local uptrend, or below zero designating a local downtrend.
Then Harrington takes his indicator a couple of very beneficial steps further. First, he sets thresholds that separate histogram bars (up or down) into three strength ranges (total of six ranges), as follows:
- ADX values from zero to the low threshold are considered nontrending. These values would not be a contributor to trend-based trading decisions.
- ADX values from the low threshold to the high threshold are considered directional and trending. These values are strong enough to be considered in trend-based trading decisions.
- ADX values above the high threshold are considered to be directional and overbought or oversold.
Next, Harrington formulates a way to display a final layer of the larger ADX trend and finer bar-to-bar movement by color-coding the histogram bars. The low trend strength ranges are assigned a color group taken from greens and blues. The high trend strength ranges are assigned a color group taken from reds and oranges. ADX values closer to zero are assigned black or gray.
Within a range, a bar that is further from zero than the previous bar (gaining trend strength) is assigned the base color for that threshold range.
A bar that is closer to zero than the previous bar (declining trend strength) is assigned a slightly darker shade of the base color for that threshold range.
See Figure 9 for an implementation of this in Excel.
FIGURE 10: Microsoft Excel. Comparing USI at different lengths.
So there you have it—a colorful, quick boost from Harrington to an old indicator friend, the ADX oscillator.
To download this spreadsheet: The spreadsheet file for this Traders’ Tip can be downloaded here. To successfully download it, follow these steps:
- Right-click on the Excel file link, then
- Select “save as” (or “save target as”) to place a copy of the spreadsheet file on your hard drive.
Problem and fix notice:
Early on the morning of Saturday, September 7, 2024, the spreadsheets that I developed for Traders’ Tips began displaying the following error message:
tatus(4) - Get Prices Error: Symbol (A) "401 - Unauthorized"
While fixing that situation, I accidentally messed up handling stock splits when they were present in the history download.
The changes necessary to make my November 2024 spreadsheet functional were extensive.
The splits problem, by comparison, wasn’t nearly as difficult to fix.
In any case, the REPAIRS tab of the spreadsheet I am providing for this issue containing Harrington’s ADX histogram can deal with both of these problems.
—Ron McAllister
Excel and VBA programmer
rpmac_xltt@sprynet.com
BACK TO LIST
Originally published in the December 2024 issue of
Technical Analysis of STOCKS & COMMODITIES magazine.
All rights reserved. © Copyright 2024, Technical Analysis, Inc.