TRADERS’ TIPS
February 2016

For this month’s Traders’ Tips, the focus is Vitali Apirine’s article in this issue, “Higher Highs & Lower Lows.” Here, we present the February 2016 Traders’ Tips code with possible implementations in various software.
Code for implementing the HHS/LLS for MetaStock as well as for Microsoft Excel is already provided in the article, which S&C subscribers will find in the Subscriber Area of our website here.
The Traders’ Tips section is provided to help the reader implement a selected technique from an article in this issue or another recent issue. The entries here are contributed by software developers or programmers for software that is capable of customization.

TC2000 VERSION 16: FEBRUARY 2016
The higher highs and lower lows stochastic described by Vitali Apirine in his article in this issue, “Higher Highs & Lower Lows,” can be easily applied in TC2000 version 16.
In Figure 1, we show a daily chart of INTC with the HHS and LLS plots along with horizontal lines at 10 (red), 50 (yellow), and 60 (green).
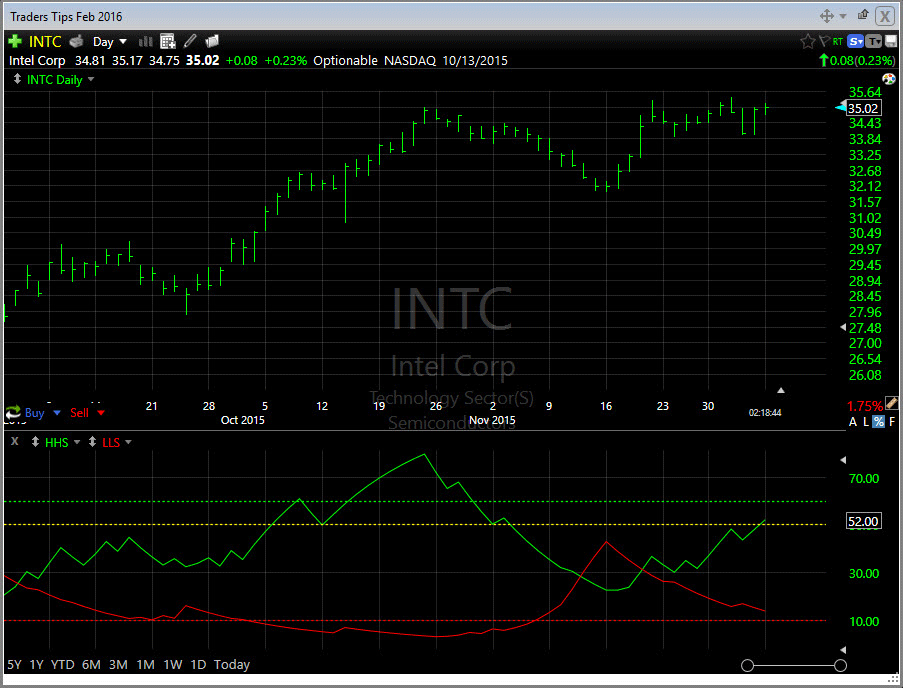
FIGURE 1: TC2000. Here are sample HHS and LLS plots along with the 10, 50, and 60 levels on a TC2000 version 16 chart.
To recreate the HHS, right-click on the chart and select add plot, then select custom PCF indicator from the list. Click on the plot name then click edit. Set the color to green, the period to 20, and the formula to:
100 * ABS(H > H1) * (H - MINH20) / (MAXH20 - MINH20)
Repeat for LLS using the following formula:
100 * ABS(L < L1) * (MAXL20 - L) / (MAXL20 - MINL20)
This will give you two plots in different panes. Move the LLS plot into the same pane and scale with HHS. To add the horizontal levels at 10, 50, and 60, click on HHS and select horizontal lines.
If you want to use a period other than 20, change the periods on each indicator and also the max and min periods in each formula.
If you would like a copy of this chart to use in your TC2000 software, simply send an email to support@TC2000.com and we’ll send it to you.
—Patrick Argo
Worden Brothers, Inc.
www.Worden.com
BACK TO LIST

TRADESTATION: FEBRUARY 2016
In “Higher Highs & Lower Lows” in this issue, author Vitali Apirine presents a momentum indicator–based system that he describes as a tool to help traders determine the direction of a trend. The indicator is made up of two separate calculations: the HHS or higher high stochastic, and the LLS or lower low stochastic, which together comprise the HHLLS. Here, we are providing the TradeStation EasyLanguage code for the HHLLS indicator.
Indicator: _HHLLS
// Indicator: HHLLS
// Author: Vitali Apirine
// Technical Analysis of Stocks
// and Commodities Feb 2016

inputs:
	Length( 20 ),
	Threshold( 50 ),
	OverBought( 60 ),
	OverSold( 10 ) ;

variables:
	HHH( 0 ),
	LLL( 0 ),
	HHS( 0 ),
	LLS( 0 ) ;

HHH = iff( High > High[1],
	( High - Lowest( High, Length ) ) /
	( Highest( High, 20 )
	- Lowest( High, Length ) ), 0 ) ;


LLL = iff( Low < Low[1],
	( Highest( Low, Length ) - Low ) /
	( Highest( Low, Length )
	- Lowest( Low, Length ) ), 0 ) ;

HHS = XAverage( HHH, Length ) * 100 ;
LLS = XAverage( LLL, Length ) * 100 ;

Plot1( HHS, "HHS" ) ;
Plot2( LLS, "LLS" ) ;

// Ref Lines
Plot3( OverSold, "OverSold" ) ;
Plot4( Threshold, "Threshold" ) ;
Plot5( OverBought, "OverBought" ) ;

// Alerts
if AlertEnabled then
	begin
	if HHS crosses over Threshold then
		Alert( "HHS crossing over Threshold" )
	else if LLS crosses over Threshold then
		Alert( "LLS crossing over Threshold" ) ;
	end ;
To download this EasyLanguage code, please visit our TradeStation and EasyLanguage support forum. The code shown here can be found at https://community.tradestation.com/Discussions/Topic.aspx?Topic_ID=142776. The ELD filename is “TASC_FEB2016.ELD.”
For more information about EasyLanguage in general, please see https://www.tradestation.com/EL-FAQ.
A sample chart is shown in Figure 2.

FIGURE 2: TRADESTATION. Here is an example TradeStation chart with the HHLLS indicator applied to a daily chart of the Dow Jones Industrial Index (DJIA).
This article is for informational purposes. No type of trading or investment recommendation, advice, or strategy is being made, given, or in any manner provided by TradeStation Securities or its affiliates.
—Doug McCrary
TradeStation Securities, Inc.
www.TradeStation.com
BACK TO LIST

eSIGNAL: FEBRUARY 2016
For this month’s Traders’ Tip, we’ve provided the study HighH_LowL.efs based on the formula described in Vitali Apirine’s article in this issue, “Higher Highs & Lower Lows.” In the article, the author presents a method of determining the direction of the trend.
The study contains formula parameters that may be configured through the edit chart window (right-click on the chart and select “edit chart”). A sample chart is shown in Figure 3.

FIGURE 3: eSIGNAL. Here is an example of the study plotted on a daily chart of $SPX.
To discuss this study or download a complete copy of the formula code, please visit the EFS Library discussion board forum under the forums link from the support menu at www.esignal.com or visit our EFS KnowledgeBase at https://www.esignal.com/support/kb/efs/. The eSignal formula script (EFS) is also available for copying & pasting here:
/*********************************

Provided By:

    Interactive Data Corporation (Copyright 2015)

    All rights reserved. This sample eSignal Formula Script (EFS)

    is for educational purposes only. Interactive Data Corporation

    reserves the right to modify and overwrite this EFS file with

    each new release.


Description:

    Higher Highs & Lower Lows by Vitali Apirine


Formula Parameters:                     Default:

Highest/Lowest Lookback                 20

Average Length                          20

Overbought Level                        60

Oversold Level                          10


Version:            1.00  12/05/2015


Notes:

    The related article is copyrighted material. If you are not a subscriber

    of Stocks & Commodities, please visit www.traders.com.


**********************************/


var fpArray = new Array();


function preMain(){

    setPriceStudy(false);

    setStudyTitle("Higher Highs & Lower Lows");

    setCursorLabelName("HHS",0);

    setCursorLabelName("LLS",1);

    setDefaultBarFgColor(Color.RGB(0,148,255),0);

    setDefaultBarFgColor(Color.RGB(255,155,0),1);


    var x=0;

    fpArray[x] = new FunctionParameter("Lookback", FunctionParameter.NUMBER);

	with(fpArray[x++]){

        setName("Highest/Lowest Lookback");

        setLowerLimit(1);

        setDefault(20);

    }

    fpArray[x] = new FunctionParameter("Length", FunctionParameter.NUMBER);

	with(fpArray[x++]){

        setName("Avgerage Length");

        setLowerLimit(1);

        setDefault(20);

    }

    fpArray[x] = new FunctionParameter("OB", FunctionParameter.NUMBER);

	with(fpArray[x++]){

        setName("Overbought Level");

        setLowerLimit(0);

        setUpperLimit(100);

        setDefault(60);

    }

    fpArray[x] = new FunctionParameter("OS", FunctionParameter.NUMBER);

	with(fpArray[x++]){

        setName("Oversold Level");

        setLowerLimit(0);

        setUpperLimit(100);

        setDefault(10);

    }

}


var xHS_LS = null;

var xHHS = null;

var xLLS = null;

var bVersion = null;


function main(Lookback, Length, OB, OS){


    if (bVersion == null) bVersion = verify();

    if (bVersion == false) return;


    if(getBarState() == BARSTATE_ALLBARS){

        xHS_LS = efsInternal("calc", Lookback);

        xHHS = ema(Length, getSeries(xHS_LS,0));

        xLLS = ema(Length, getSeries(xHS_LS,1));

        addBand(OB,PS_SOLID,1,Color.lightgrey,"OB");

        addBand(OS,PS_SOLID,1,Color.lightgrey,"OS");

    }


    var nHHS = xHHS.getValue(0);

    var nLLS = xLLS.getValue(0);


    if(nHHS == null || nLLS == null) return;


    return [nHHS, nLLS]

}


var xHigh = null;

var xLow = null;

var xHighestH = null;

var xLowestH = null;

var xHighestL = null;

var xLowestL = null;

var bInit = false;


function calc(Lookback){


    if(!bInit){

        xHigh = high();

        xLow = low();

        xHighestH = hhv(Lookback, xHigh);

        xLowestH = llv(Lookback, xHigh);

        xHighestL = hhv(Lookback, xLow);

        xLowestL = llv(Lookback, xLow);

        bInit = true;

    }


    var nHigh = xHigh.getValue(0);

    var nHigh_1 = xHigh.getValue(-1);

    var nLow = xLow.getValue(0);

    var nLow_1 = xLow.getValue(-1);

    var nHighestH = xHighestH.getValue(0);

    var nLowestH = xLowestH.getValue(0);

    var nHighestL = xHighestL.getValue(0);

    var nLowestL = xLowestL.getValue(0);


    if(nHigh_1 == null || nLow_1 == null || nHighestH == null || nLowestH == null ||

       nHighestL == null || nLowestL == null)

        return;


    var HS = nHigh > nHigh_1? (nHigh-nLowestH)/(nHighestH-nLowestH)*100: 0;

    var LS = nLow < nLow_1? (nHighestL-nLow)/(nHighestL-nLowestL)*100: 0;


    return [HS,LS]

}


function verify(){

    var b = false;

    if (getBuildNumber() < 3742){


        drawTextAbsolute(5, 35, "This study requires version 12.1 or later.",

            Color.white, Color.blue, Text.RELATIVETOBOTTOM|Text.RELATIVETOLEFT|Text.BOLD|Text.LEFT,

            null, 13, "error");

        drawTextAbsolute(5, 20, "Click HERE to upgrade.@URL=https://www.esignal.com/download/default.asp",

            Color.white, Color.blue, Text.RELATIVETOBOTTOM|Text.RELATIVETOLEFT|Text.BOLD|Text.LEFT,

            null, 13, "upgrade");

        return b;

    }

    else

        b = true;


    return b;

}
—Eric Lippert
eSignal, an Interactive Data company
800 779-6555, www.eSignal.com
BACK TO LIST

THINKORSWIM: FEBRUARY 2016
In “Higher Highs & Lower Lows” in this issue, author Vitali Apirine uses ideas he discovered while studying the stochastic oscillator and Williams’ %R to form a new indicator based on consecutive highs and lows.
We have built his higher high & lower low stochastics together in one study using our proprietary scripting language, thinkscript. We have made the loading process extremely easy: simply click on the link https://tos.mx/NCImLq and choose save script to thinkorswim. Choose to rename your study “HHLLS.” You can adjust the parameters of this study within the edit studies window to fine-tune your variables.
In the example shown in Figure 4, you see a chart of SPX, which is the S&P 500 index, with the HHLLS study added. The green line indicates higher highs and the red line indicates lower lows.

FIGURE 4: THINKORSWIM. The SPX is shown with the HHLLS study added. The green line indicates higher highs and the red line indicates lower lows.
For more details about the strategy, refer to Apirine’s article in this issue.
—thinkorswim
A division of TD Ameritrade, Inc.
www.thinkorswim.com
BACK TO LIST

WEALTH-LAB: FEBRUARY 2016
According to Vitali Apirine’s article in this issue, “Higher Highs & Lower Lows,” the momentum indicator-based system HHLLS (higher high, lower low stochastic) can help to spot emerging trends, define correction periods, and anticipate reversals. As with many indicators, HHLLS signals can also be generated by looking for divergences and crossovers. Because the HHLLS is an oscillator, it can also be used to identify overbought & oversold levels.
This month, we explore HHS/LLS crossovers. The HHLLS is made up of two separate indicators: the higher high stochastic (HHS) and lower low stochastic (LLS). In Figure 5, they’re visible as green and red lines, respectively. As it seems that the indicators can produce whipsaws, we thought it could be a nice idea to smooth them with a simple moving average. As it turned out, this resulted in fewer losing trades.

FIGURE 5: WEALTH-LAB. This sample Wealth-Lab chart illustrates application of the system’s rules on a daily chart of RUT (Russell 2000 Index).
After updating the TASCIndicators library to v2016.01 or later, HHS and LLS indicators can be found under the TASC Magazine Indicators group. They can be plotted on a chart and also be used as an entry or exit condition in a rule-based strategy without having to program any code yourself.
The included Wealth-Lab strategy is set to configure the HHS, LLS lookback period and HHLLS smoothing period interactively through the parameter sliders on the bottom left of the screen.
Wealth-Lab 6 strategy code (C#):

using System;
using System.Collections.Generic;
using System.Text;
using System.Drawing;
using WealthLab;
using WealthLab.Indicators;
using TASCIndicators;

namespace WealthLab.Strategies
{
	public class TASC201602 : WealthScript
	{
		private StrategyParameter slider1;
		private StrategyParameter slider2;
		private StrategyParameter slider3;

		public TASC201602()
		{
			slider1 = CreateParameter("HHS Period",20,10,100,10);
			slider2 = CreateParameter("LLS Period2",20,10,100,10);
			slider3 = CreateParameter("Smooth HHLLS",3,1,10,1);
		}

		protected override void Execute()
		{
			var hhs = SMA.Series( HHS.Series(Bars,slider1.ValueInt), slider3.ValueInt);
			var lls = SMA.Series( LLS.Series(Bars,slider2.ValueInt), slider3.ValueInt);
			hhs.Description = "Smoothed HHS"; lls.Description = "Smoothed LLS";

			for(int bar = GetTradingLoopStartBar(20); bar < Bars.Count; bar++)
			{
				if (IsLastPositionActive)
				{
					if( CrossUnder(bar,hhs,lls))
						SellAtMarket(bar+1, LastPosition);
				}
				else
				{
					if( CrossOver(bar,hhs,lls))
						BuyAtMarket(bar+1);
				}
			}
			ChartPane paneHHLLS1 = CreatePane(40,true,true);
			PlotSeries(paneHHLLS1,hhs,Color.Green,LineStyle.Solid,1);
			PlotSeries(paneHHLLS1,lls,Color.Red,LineStyle.Solid,1);
			HideVolume();

		}
	}
}
—Eugene, Wealth-Lab team
MS123, LLC
www.wealth-lab.com
BACK TO LIST

AMIBROKER: FEBRUARY 2016
In “Higher Highs & Lower Lows” in this issue, author Vitali Apirine presents his higher high lower low stochastic indicator. A ready-to-use formula for AmiBroker based on Apirine’s article is shown here. To use it, enter the code into the formula editor and press the apply indicator button. You can adjust the indicator period by right-clicking on the chart and selecting the parameters window.
LISTING 1.
// uncomment line below if you want to
// calculate the indicator always using
// SP500 or whatever fixed symbol you wish
// SetForeign("^GSPC" );
hh = High;
ll = Low;

period = Param("period", 20, 10, 100 );

hhh = IIf( hh > Ref( hh, -1 ),
          (hh - LLV( hh, period ))/( HHV( hh, 20 ) - LLV( hh, 20 ) ),
          0 );

hhs = 100 * EMA( hhh, period );

lll = IIf( ll < Ref( ll, -1 ),
          (HHV( ll, period ) - ll)/( HHV( ll, 20 ) - LLV( ll, 20 ) ),
          0 );

lls = 100 * EMA( lll, period );

Plot( hhs, "HHS" + period, colorBrightGreen );
Plot( lls, "LLS" + period, colorRed );
A sample chart is shown in Figure 6.
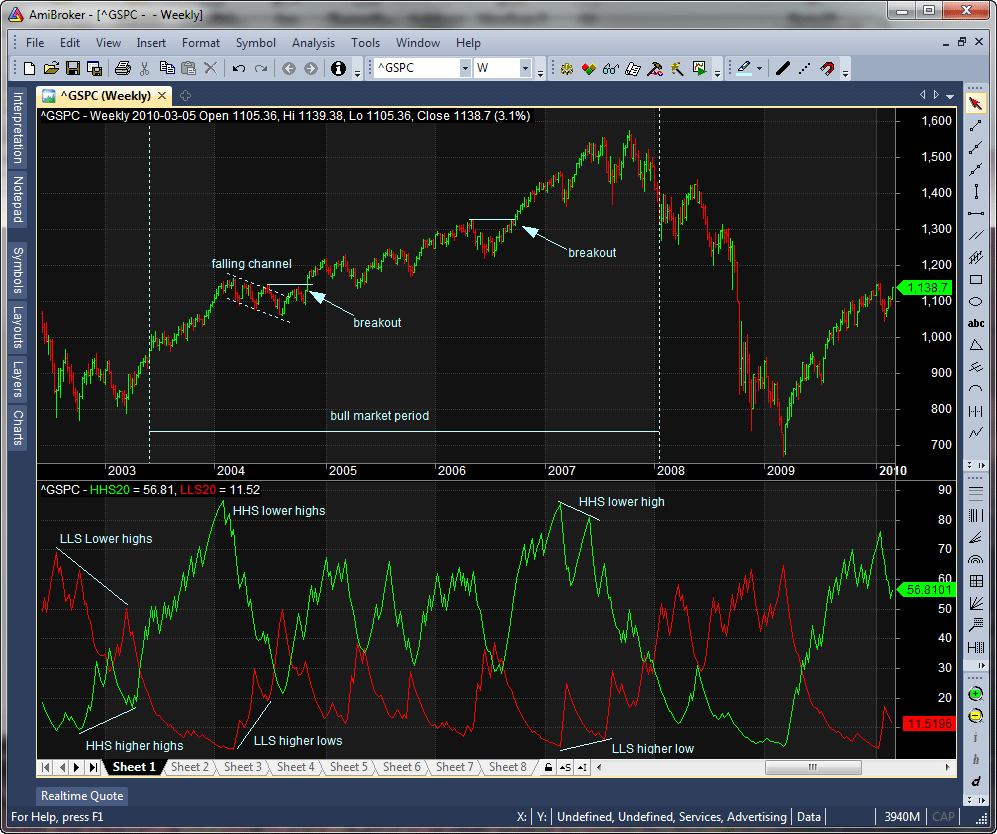
FIGURE 6: AMIBROKER. Here is a weekly chart of GSPC with the HHS and LLS indicators shown.
—Tomasz Janeczko, AmiBroker.com
www.amibroker.com
BACK TO LIST

NEUROSHELL TRADER: FEBRUARY 2016
The higher high lower low stochastic indicators described by Vitali Apirine in his article in this issue, “Higher Highs & Lower Lows,” can be easily implemented with a few of NeuroShell Trader’s 800+ indicators. Simply select “new indicator” from the insert menu and use the indicator wizard to set up the following indicators:
HHS:	ExpAvg(IfThenElse(A>B(High,Lag(High,1)),Stoch%K(High,High,High,20),0),20)
LLS:  	ExpAvg(IfThenElse(A<B(Low,Lag(Low,1)),%R(Low,Low,Low,20),0),20)
Users of NeuroShell Trader can go to the Stocks & Commodities section of the NeuroShell Trader free technical support website to download a copy of this or any previous Traders’ Tips.
A sample chart is shown in Figure 7.

FIGURE 7: NEUROSHELL TRADER. This NeuroShell Trader chart displays the HHS and LLS on the S&P 500 index.
—Marge Sherald, Ward Systems Group, Inc.
301 662-7950, sales@wardsystems.com
www.neuroshell.com
BACK TO LIST

AIQ: FEBRUARY 2016
The AIQ code based on Vitali Apirine’s article in this issue, “Higher Highs & Lower Lows,” is shown here and is also provided at www.TradersEdgeSystems.com/traderstips.htm.
The code provided computes the indicator values for the HHS and LLS indicators as well as allowing us to plot the indicator on a chart.
Figure 8 shows the indicator on a chart of Align Technology (ALGN).

FIGURE 8: AIQ. Here, the HHS and LLS indicators are shown on a chart of ALGN.
Again, the code and EDS file can be downloaded from www.TradersEdgeSystems.com/traderstips.htm and is also shown below.
!HIGHER HIGHS AND LOWER LOWS

!Author: Vitali Aprine, TASC Feb 2016

!Coded by: Richard Denning, 12/09/2015

!TradersEdgeSystems.com


! ABBREVIATIONS:

C is [close].

C1 is valresult(C,1).

H is [high].

H1 is valresult(H,1).

L is [low].

L1 is valresult(L,1).

O is [open].


!INPUTS:

len is 20.


!INDICATOR CODE:

LH is lowresult(H,len).

HH is highresult(H,len).

HS is iff(H>H1,(H-LH)/(HH-LH),0).


LL is lowresult(L,len).

HL is highresult(L,len).

LS is iff(L<L1,(Hl-L)/(HL-LL),0).


HHS is expavg(HS,len)*100. !PLOT

LLS is expavg(LS,len)*100. !PLOT
—Richard Denning
info@TradersEdgeSystems.com
for AIQ Systems
BACK TO LIST

TRADERSSTUDIO: FEBRUARY 2016
The TradersStudio code based on Vitali Apirine’s article in this issue, “Higher Highs & Lower Lows,” is provided at www.TradersEdgeSystems.com/traderstips.htm.
The following code files are provided in the download:
- Function HHSLLS_Stoch: Computes the indicator values HHS and LLS
- Indicator plot HHS_LLS_IND: Plots the two lines HHS and LLS on a single indicator
window.
Figure 9 shows the indicator on a chart of the S&P 500 full-size futures contract (SP using data from Pinnacle Data Corp.).

FIGURE 9: TRADERSSTUDIO. Here, the HHS and LLS indicators are plotted on a chart of the S&P 500 futures contract (SP).
The code is also shown here:
'HIGHER HIGHS AND LOWER LOWS

'Author: Vitali Aprine, TASC Feb 2016

'Coded by: Richard Denning, 12/10/2015

'TradersEdgeSystems com


'Function to compute HHS & LLS:

Function HHSLLS_Stoch(stochLen,ByRef LLS)

Dim LH,HH,HS,HHS

LH = Lowest(H,stochLen)

HH = Highest(H,stochLen)

If (HH-LH)<>0 Then HS = IIF(H>H[1],(H-LH)/(HH-LH),0)


Dim LL,HL,LS

LL = Lowest(L,stochLen)

HL = Highest(L,stochLen)

If (HL-LL)<>0 Then LS = IIF(L<L[1],(HL-L)/(HL-LL),0)


HHS = XAverage(HS,stochLen)*100

LLS = XAverage(LS,stochLen)*100

HHSLLS_Stoch = HHS

End Function

'----------------------------------------------------

'For plotting the HHS LLS indicator:

Sub HHS_LLS_IND(stochLen)

Dim HHS,LLS

HHS = HHSLLS_Stoch(stochLen,LLS)

plot1(HHS)

plot2(LLS)

End Sub
—Richard Denning
info@TradersEdgeSystems.com
for TradersStudio
BACK TO LIST

NINJATRADER: FEBRUARY 2016
The higher high lower low stochastics indicator, as presented in “Higher Highs & Lower Lows” by Vitali Apirine in this issue, is available for download at www.ninjatrader.com/SC/February2016SC.zip.
Once you have it downloaded, from within the NinjaTrader Control Center window, select the menu File → Utilities → Import NinjaScript and select the downloaded file. This file is for NinjaTrader Version 7.
You can review the indicator’s source code by selecting the menu Tools → Edit
NinjaScript → Indicator from within the NinjaTrader Control Center window
and selecting the HigherHighLowerLowStochastics file.
NinjaScript uses compiled DLLs that run native, not interpreted, which provides you with the highest performance possible.
A sample chart demonstrating the indicator is shown in Figure 10.

FIGURE 10: NINJATRADER. The HigherHighLowerLowStochastics indicator is displayed both on the S&P 500 index and on the DJIA using daily data.
—Raymond Deux & Cody Brewer
NinjaTrader, LLC
www.ninjatrader.com
BACK TO LIST

UPDATA: FEBRUARY 2016
Our Traders’ Tip for this month is based on “Higher Highs & Lower Lows” by Vitali Apirine in this issue.
In the article, the author proposes a momentum indicator to define trend directions based on exponentially smoothed ratios of high prices relative to their previous period high and low values, and exponentially smoothed low prices relative to their previous period high and low values. Two stochastic lines are created, whose crossovers and divergences with underlying prices indicate reversals and trend continuations.
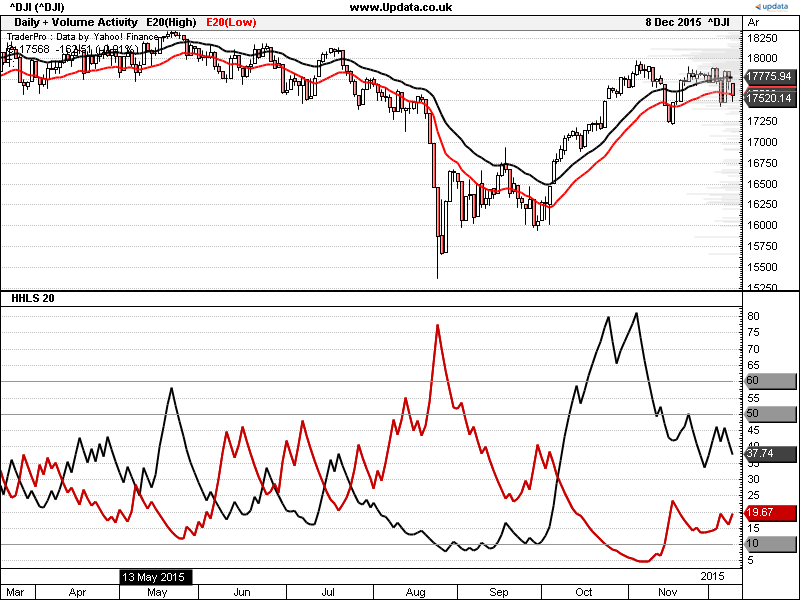
FIGURE 11: UPDATA. The 20-period HHLLS indicator is applied to the daily Dow Jones Industrial Average.
The Updata code for this article is in the Updata library and may be downloaded by clicking the custom menu and indicator library. Those who cannot access the library due to a firewall may paste the code shown here into the Updata custom editor and save it.
PARAMETER "Period" #PERIOD=20
DISPLAYSTYLE 5LINES
INDICATORTYPE CHART
PLOTSTYLE THICK2 RGB(0,0,0)
PLOTSTYLE2 THICK2 RGB(200,0,0)
PLOTSTYLE3 LINE RGB(150,150,150)
PLOTSTYLE4 LINE RGB(150,150,150)
PLOTSTYLE5 LINE RGB(150,150,150)
NAME HHLLS
@PeriodHiHigh=0
@PeriodLoHigh=0
@PeriodHiLow=0
@PeriodLoLow=0
@HS=0
@LS=0
FOR #CURDATE=#PERIOD TO #LASTDATE
   'CREATE RATIOS
   @PeriodHiHigh=PHIGH(HIGH,#PERIOD,1)
   @PeriodLoHigh=PLOW(HIGH,#PERIOD,1)
   @PeriodHiLow=PHIGH(LOW,#PERIOD,1)
   @PeriodLoLow=PLOW(LOW,#PERIOD,1)
   'PLACE IN % TERMS WHEN HIGH GREATER THAN PRIOR HIGH
   IF HIGH>HIGH(1)
      @HS=100*(HIGH-@PeriodLoHigh)/(@PeriodHiHigh-@PeriodLoHigh)
   ELSE
      @HS=0
   ENDIF
   'PLACE IN % TERMS WHEN LOW LESS THAN PRIOR LOW
   IF LOW<LOW(1)
      @LS=100*(@PeriodHiLow-LOW)/(@PeriodHiLow-@PeriodLoLow)
   ELSE
      @LS=0
   ENDIF
   'EXPONENTIAL SMOOTHING
   @PLOT=SGNL(@HS,#PERIOD,E)
   @PLOT2=SGNL(@LS,#PERIOD,E)
   'LEVELS AT 10,50,60
   @PLOT3=10
   @PLOT4=50
   @PLOT5=60
NEXT
—Updata support team
support@updata.co.uk
www.updata.co.uk
BACK TO LIST

TRADE NAVIGATOR: FEBRUARY 2016
A special file has been created based on “Higher Highs & Lower Lows” by
Vitali Apirine in this issue to make it easy to download a library for this
technique in Trade Navigator. The filename is “SC201602.” This library
contains two indicators, HHS and LLS, and a template named “higher high lower low.”
Users can download this file via the blue telephone button. Type in the filename “SC201602” (without the quotes), then click the start button. When prompted to upgrade, click the yes button. If prompted to close all software, click on the continue button. Your library will now download.
For your convenience, we have added a template in the library that allows you to modify your chart with a prebuilt indicator package and settings. Open the charting pulldown menu, select the templates command, then on the submenu that opens, select the “higher high lower low” template. If you are prompted to “save the current chart settings as template,” your answer will depend on whether you have made any changes to your current chart template that you would like to keep. If you choose “no,” these changes will be discarded, and a “yes” choice will save the changes into the prior template on your chart before switching the template to the “higher high lower low” template.
TradeSense code for the indicators:
HHS:
&HH := High Of "$SPX"
&HHH := IFF (&HH > (&HH).1 , (&HH - Lowest (&HH , 20)) / (Highest (&HH , 20) - Lowest (&HH , 20)) , 0)
MovingAvgX (&HHH , 20) * 100

LLS:
&LL := Low Of "$SPX"
&LLL := IFF (&LL < (&LL).1 , (Highest (&LL , 20) - &LL) / (Highest (&LL , 20) - Lowest (&LL , 20)) , 0)
MovingAvgX (&LLL , 20) * 100
MANUALLY CREATING INDICATORS
If you would like to create these indicators manually, click on the edit dropdown menu and open the trader’s toolbox (or use CTRL+T) and click on the functions tab. Click on the new button and a new function dialog will open. In its text box, type in the code for the above highlight bar. Ensure that there are no extra spaces at the end of each line. When completed, click on the verify button. You may be presented with an add inputs popup message if there are variables in the code. If so, click the yes button, then enter a value in the default value column. If all is well, when you click on the function tab, the code you entered will convert to italic font. Now click on the save button and type a name for the indicator.
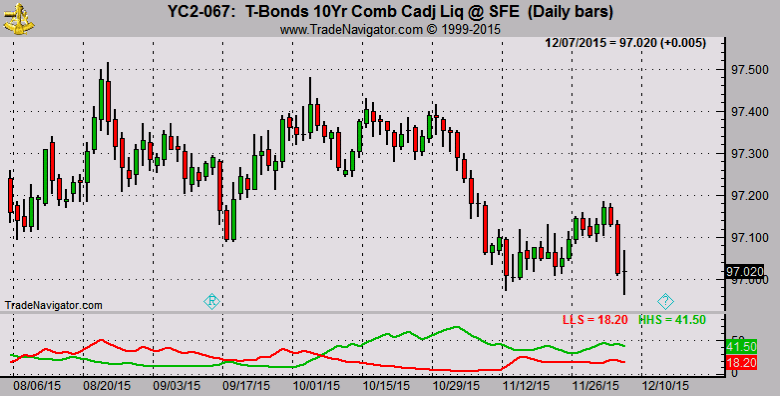
FIGURE 12: TRADE NAVIGATOR, LLS & HHS
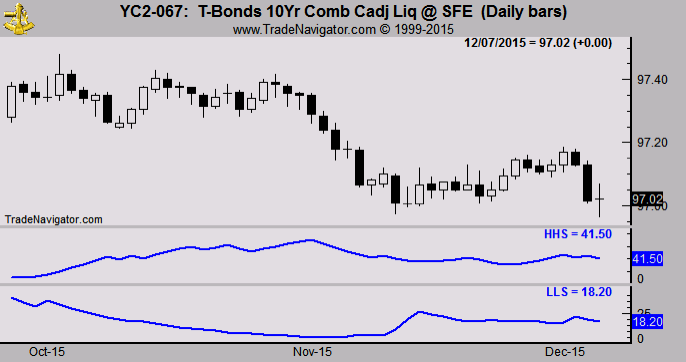
FIGURE 13: TRADE NAVIGATOR, HHS & LLS
ADDING TO YOUR CHART
Once completed, you can insert these indicators onto your chart (Figures 12 & 13) by opening the charting dropdown menu, selecting the add to chart command, then on the indicators tab, find your named indicator, select it, and click the add button. Repeat this procedure for additional indicators if you wish.
If you have difficulty creating or using the indicators and/or template, our friendly technical support staff is happy to help. Either call 719 884-0245 or click on the live chat tool under the help menu. Support hours are M-F, 6am–7pm Mountain Time. Happy trading!
—Genesis Financial Technologies
www.TradeNavigator.com
BACK TO LIST
MICROSOFT EXCEL: FEBRUARY 2016
In “Higher Highs & Lower Lows” in this issue, author Vitali Apirine presents a pair of stochastic indicators that, when used in combination, can assist with recognition of trend direction and even anticipate trend turning points.
Apirine also suggests usages that include overbought and oversold tests, indicator crossovers as trade signals, and indicator vs. price divergences as signals.
Figure 14 replicates Figure 2 from Apirine’s article showing an extended uptrend.

FIGURE 14: EXCEL, UPTREND. This chart is similar to Figure 2 from Vitali Apirine’s article in this issue.
Figure 15 looks at emerging trends similar to Figure 6 from the article. To reduce the level of chart clutter for this multiyear-long interval, Apirine used weekly data for this chart.

FIGURE 15: EXCEL. Looking at emerging trends with weekly data.
Yahoo history retrievals (see the InputPriceData tab) can provide daily, weekly, or monthly bar data on request. Weekly bars generally use Monday dates, which means we have six-day gaps between the dates of bars in our weekly history data. And we have the possibility of larger gaps for intervals, which include Monday holidays.
For those who have not used weekly or monthly data with a Traders’ Tips spreadsheet previously, see the notes tab of this spreadsheet for a brief step-by-step to retrieving these data types.
Picking dates without reference to a calendar led to my guessing dates that were not necessarily Mondays. And they were definitely not the dates on any weekly bars for this time period.
Figure 16 shows the results of one of my guesses as to the appropriate end-point dates to replicate Figure 6 from the article. The #NA values indicate that the dates are not found in the data. Since these turned out to be Thursday and Friday dates, one certainly could apply a bit of finger counting to adjust these forward or backward to Monday dates.

FIGURE 16: EXCEL, WILD GUESS. Here’s an example of a wild guess at weekly bar dates from a couple of years ago.
But there still might be a problem if the oldest date in the downloaded history is newer than the user-specified dates, even when the dates are manually adjusted to the Monday nearest our original guess.
To speed things up a bit, the Traders’ Tip spreadsheet template now has a “Resolve #NA errors” button to drive a macro designed to resolve #NA situations. The macro will check the user-specified date that is causing the #NA (date not found) and take one of three paths:
- If the user-specified date is less (older) than the oldest date on the input data tab, then the date specification will be set forward to the date of the oldest available bar.
- If the user-specified date is younger (more recent) than the youngest date on the input data tab, then the date specification will be set back to the date of the newest available bar.
- If neither of the first two choices applies, then the user-specified date falls somewhere between dates that do exist on the input data tab.
For daily data, this could be the result of the user specifying a weekend, holiday, or any other date where the market was closed. For weekly or monthly data, we know for sure that there will be significant date gaps between bars.
As a fix for this case, I am using logic based on the Excel match function to locate and return the closest existing date that is newer (younger) than the user-specified date.
To arrive at Figure 15, I used the new “Resolve...” button to
clear the #NA problems shown in Figure 16. Then I used the “I would like
to chart...” button to finish replicating Figure 6 from the article.
The spreadsheet file for this Traders’ Tip can be downloaded here. To successfully download it, follow these steps:
- Right-click on the Excel file link, then
- Select “save as” (or “save target as”) to place a copy of the spreadsheet file on your hard drive.
NOTE: Spreadsheet updated 03/29/16
—Ron McAllister
Excel and VBA programmer
rpmac_xltt@sprynet.com
BACK TO LIST
Originally published in the February 2016 issue of
Technical Analysis of STOCKS & COMMODITIES magazine.
All rights reserved. © Copyright 2016, Technical Analysis, Inc.


