TRADERS’ TIPS
June 2015

For this month’s Traders’ Tips, the focus is Kevin Luo’s article in this issue, “The RSI & Price Trends.” Here, we present the June 2015 Traders’ Tips code with possible implementations in various software.
The Traders’ Tips section is provided to help the reader implement a selected technique from an article in this issue or another recent issue. The entries here are contributed by software developers or programmers for software that is capable of customization.

TRADESTATION: JUNE 2015
In “The RSI & Price Trends” in this issue, author Kevin Luo describes several new approaches to trading with the well-known relative strength index (RSI) indicator. One of the author’s approaches is to only trade with the prevailing trend. He has defined a trend change as occurring when there is a 20% retracement from the extreme price of the current trend. A second approach Luo describes is to only select stocks for trading that exhibit shorter trend lengths.
For convenience, we are providing code for a TradeStation strategy based on the author’s ideas. In addition to the strategy code, we are providing two accompanying indicators. The first, TrendInfo, can be placed in the chart along with the strategy to assist in visualizing the trends and trend changes. The second, TrendLength, is intended to be used in the TradeStation Scanner to assist in identifying average trend length of a list of stocks. From the Scanner results, a symbol list can be generated and then backtested as a portfolio using the TradeStation Portfolio Maestro application.
To download the EasyLanguage code, please visit our TradeStation and EasyLanguage support forum. The code for this article can be found here: https://www.tradestation.com/TASC-2015. The ELD filename is “TASC_JUN2015.ELD.” The code is also shown here:
Strategy: RSI with Trend

// Tasc Jun 2015
// RSI and Price Trends
// Strategy


inputs:
	Price( Close ) ,
	RSILength( 14 ),
	OverBought( 70 ),
	Oversold( 30 ),
	RetracePct( 20 ),
	ExitOnTrendChange( true ),
	UseTrendFilter( true ),
	DrawTrendLines( true ),
	LineColor( Yellow ),
	LineWidth( 1 );

variables:
	NewSwingPrice( 0 ),
	SwingPrice( Price ),
	SwingDate( Date ),
	SwingTime( Time ),
	TLDir( 0 ),
	RetraceFctrUp( 1 + RetracePct * .01 ),
	RetraceFctrDn( 1 - RetracePct * .01 ),
	SaveSwing( false ),
	AddTL( false ),
	UpdateTL( false ),
	TLRef( 0 ),
	RSIValue( 0 ),
	TrendOK( false ) ;

NewSwingPrice = SwingHigh( 1, Price, 1, 2 ) ;

if NewSwingPrice  <> -1 then
	begin
	if TLDir <= 0 and NewSwingPrice >= SwingPrice
		* RetraceFctrUp then
		begin
		SaveSwing = true ;
		AddTL = true ;
		TLDir = 1 ;
		end
	else if TLDir = 1 and NewSwingPrice >= SwingPrice then
		begin
		SaveSwing = true ;
		UpdateTL = true ;
		end ;
	end
else
	begin
	NewSwingPrice = SwingLow( 1, Price, 1, 2 ) ;
	if NewSwingPrice <> -1 then
		begin
		if TLDir >= 0 and NewSwingPrice <= SwingPrice
			* RetraceFctrDn then
			begin
			SaveSwing = true ;
			AddTL = true ;
			TLDir = -1 ;
			end
		else if TLDir = -1 and NewSwingPrice <= SwingPrice then
			begin
			SaveSwing = true;
			UpdateTL = true ;
			end ;
		end ;
	end ;

if SaveSwing then
	begin
	SwingPrice = NewSwingPrice ;
	SwingDate = Date[1] ;
	SwingTime = Time[1] ;
	SaveSwing = false ;
	end ;

if DrawTrendLines = true then
	begin
	if AddTL then
		begin
		TLRef = TL_New( SwingDate, SwingTime, SwingPrice,
		SwingDate[1], SwingTime[1], SwingPrice[1] ) ;
		TL_SetExtLeft( TLRef, false ) ;
		TL_SetExtRight( TLRef, false ) ;
		TL_SetSize( TLRef, LineWidth ) ;
		TL_SetColor( TLRef, LineColor ) ;
		AddTL = false ;
		end
	else if UpdateTL then
		begin
		TL_SetEnd( TLRef, SwingDate, SwingTime, SwingPrice ) ;
		UpdateTL = false ;
		end ;
	end ;

RSIValue = RSI( Price, RSILength ) ;

if UseTrendFilter = false then
	TrendOK = true
else
	TrendOK = TLDir = 1 ;

if RSIValue crosses under OverSold and TrendOK then
	Buy ( "RSI LE" )next bar at Market
else if RSIValue crosses over OverBought then
	Sell ( "RSI LX" ) next bar at Market ;

if ExitOnTrendChange and TLDir = -1 then
	Sell ( "Trend LX" ) next bar at Market ;


Indicator: TrendInfo

// Tasc Jun 2015
// RSI and Price Trends
// Chart indicator used to show trend changes
// and trend statistics


using elsystem ;
using elsystem.collections ;

inputs:
	Price( Close ) ,
	RetracePct( 20 ) ,
	LineColor( Yellow ),
	LineWidth( 1 ),
	DrawTrendLines( true )  ;

variables:
	NewSwingPrice( 0 ),
	SwingPrice( Price ),
	SwingDate( Date ),
	SwingTime( Time ),
	TLDir( 0 ),
	RetraceFctrUp( 1 + RetracePct * .01 ),
	RetraceFctrDn( 1 - RetracePct * .01 ),
	SaveSwing( false ),
	AddTL( false ),
	UpdateTL( false ),
	TLRef( 0 ),
	AvgTrendLength( 0 ),
	LastTrendChgBar( 0 ),
	vector TrendLength( NULL ) ;

once
	begin
	TrendLength = new Vector ;
	end ;

NewSwingPrice = SwingHigh( 1, Price, 1, 2 ) ;

if NewSwingPrice  <> -1 then
	begin
	if TLDir <= 0 and NewSwingPrice >= SwingPrice
		* RetraceFctrUp then
		begin
		SaveSwing = true ;
		AddTL = true ;
		TLDir = 1 ;
		end
	else if TLDir = 1 and NewSwingPrice >= SwingPrice then
		begin
		SaveSwing = true ;
		UpdateTL = true ;
		end ;
	end
else
	begin
	NewSwingPrice = SwingLow( 1, Price, 1, 2 ) ;
	if NewSwingPrice <> -1 then
		begin
		if TLDir >= 0 and NewSwingPrice <= SwingPrice
			* RetraceFctrDn then
			begin
			SaveSwing = true ;
			AddTL = true ;
			TLDir = -1 ;
			end
		else if TLDir = -1 and NewSwingPrice <= SwingPrice then
			begin
			SaveSwing = true;
			UpdateTL = true ;
			end ;
		end ;
	end ;

if SaveSwing then
	begin
	SwingPrice = NewSwingPrice ;
	SwingDate = Date[1] ;
	SwingTime = Time[1] ;
	SaveSwing = false ;
	end ;

if DrawTrendLines = true then
	begin
	if AddTL then
		begin
		TLRef = TL_New( SwingDate, SwingTime, SwingPrice,
		SwingDate[1], SwingTime[1], SwingPrice[1] ) ;
		TL_SetExtLeft( TLRef, false ) ;
		TL_SetExtRight( TLRef, false ) ;
		TL_SetSize( TLRef, LineWidth ) ;
		TL_SetColor( TLRef, LineColor ) ;
		AddTL = false ;
		end
	else if UpdateTL then
		begin
		TL_SetEnd( TLRef, SwingDate, SwingTime, SwingPrice ) ;
		UpdateTL = false ;
		end ;
	end ;

if LastTrendChgBar = 0 and TLDir <> TLDir[1] then
	begin
	LastTrendChgBar = CurrentBar ;
	TrendLength.push_back( LastTrendChgBar astype int ) ;
	end
else if TLDir <> TLDir[1] then
	begin
	TrendLength.push_back( CurrentBar - LastTrendChgBar astype int ) ;
	LastTrendChgBar = CurrentBar ;
	end ;

if LastBarOnChartEx and TrendLength.Count > 0 then
	AvgTrendLength = Average( TrendLength, TrendLength.Count ) ;

Plot1( TLDir ) ;
Plot2( " AvgTrendLength : " +  NumToStr( AvgTrendLength, 0 )
		+ " Bars", "AvgTrendLen", Yellow ) ;
Plot3( " Num Trends : " + NumToStr( TrendLength.Count, 0 ),
		"Num Trends",Yellow ) ;


Indicator: TrendLength

// Tasc Jun 2015
// RSI and Price Trends
// The indicator is intended to be used in scanner
// to calculate average trend length for each symbol
//    in a symbol list.
// Be sure to load additional data based on the period
//    that you want to analyze


using elsystem ;
using elsystem.collections ;

inputs:
	Price( Close ) ,
	RetracePct( 20 ) ;

variables:
	NewSwingPrice( 0 ),
	SwingPrice( Price ),
	SwingDate( Date ),
	SwingTime( Time ),
	TLDir( 0 ),
	RetraceFctrUp( 1 + RetracePct * .01 ),
	RetraceFctrDn( 1 - RetracePct * .01 ),
	SaveSwing( false ),
	AddTL( false ),
	UpdateTL( false ),
	TLRef( 0 ),
	AvgTrendLength( 0 ),
	LastTrendChgBar( 0 ),
	vector TrendLength( NULL ) ;

once
	begin
	TrendLength = new Vector ;
	end ;

NewSwingPrice = SwingHigh( 1, Price, 1, 2 ) ;

if NewSwingPrice  <> -1 then
	begin
	if TLDir <= 0 and NewSwingPrice >= SwingPrice
		* RetraceFctrUp then
		begin
		SaveSwing = true ;
		AddTL = true ;
		TLDir = 1 ;
		end
	else if TLDir = 1 and NewSwingPrice >= SwingPrice then
		begin
		SaveSwing = true ;
		UpdateTL = true ;
		end ;
	end
else
	begin
	NewSwingPrice = SwingLow( 1, Price, 1, 2 ) ;
	if NewSwingPrice <> -1 then
		begin
		if TLDir >= 0 and NewSwingPrice <= SwingPrice
			* RetraceFctrDn then
			begin
			SaveSwing = true ;
			AddTL = true ;
			TLDir = -1 ;
			end
		else if TLDir = -1 and NewSwingPrice <= SwingPrice then
			begin
			SaveSwing = true;
			UpdateTL = true ;
			end ;
		end ;
	end ;

if SaveSwing then
	begin
	SwingPrice = NewSwingPrice ;
	SwingDate = Date[1] ;
	SwingTime = Time[1] ;
	SaveSwing = false ;
	end ;

if LastTrendChgBar = 0 and TLDir <> TLDir[1] then
	begin
	LastTrendChgBar = CurrentBar ;
	TrendLength.push_back( LastTrendChgBar astype int ) ;
	end
else if TLDir <> TLDir[1] then
	begin
	TrendLength.push_back( CurrentBar - LastTrendChgBar astype int ) ;
	LastTrendChgBar = CurrentBar ;
	end ;

if LastBarOnChartEx and TrendLength.Count > 0 then
	AvgTrendLength = Average( TrendLength, TrendLength.Count ) ;

Plot1(  AvgTrendLength,  " TrendLen" ) ;
For more information about EasyLanguage in general, please see https://www.tradestation.com/EL-FAQ.
A sample chart is shown in Figure 1.
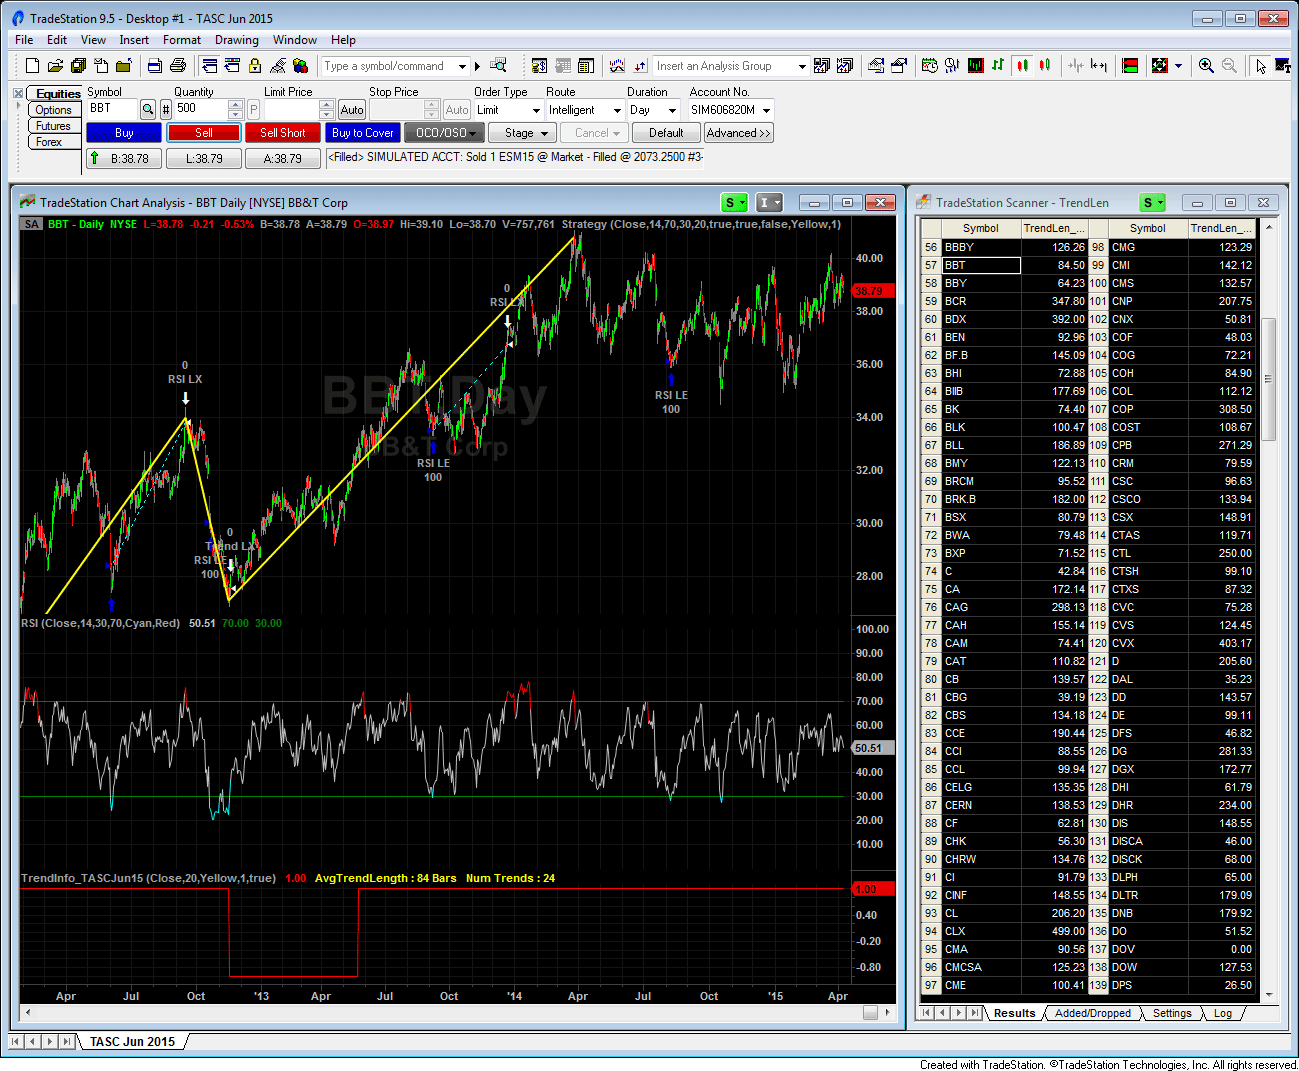
FIGURE 1: TRADESTATION, RSI WITH TREND. Here is an example of the custom RSI strategy and TrendInfo indicator applied to a daily chart of BBT along with the average TrendLength indicator as used with the TradeStation Scanner.
This article is for informational purposes. No type of trading or investment recommendation, advice, or strategy is being made, given, or in any manner provided by TradeStation Securities or its affiliates.
—Doug McCrary
TradeStation Securities, Inc.
www.TradeStation.com
BACK TO LIST

eSIGNAL: JUNE 2015
For this month’s Traders’ Tip, we’re providing the formula StrategyRSI.efs based on the formula described in Kevin Luo’s article in this issue, “The RSI & Price Trends.”
This formula takes long trades only and is back-testable by using the show backtest feature in the program.
The study contains formula parameters that may be configured through the edit chart window (right-click on the chart and select “edit chart”). A sample chart implementing this study is shown in Figure 2.
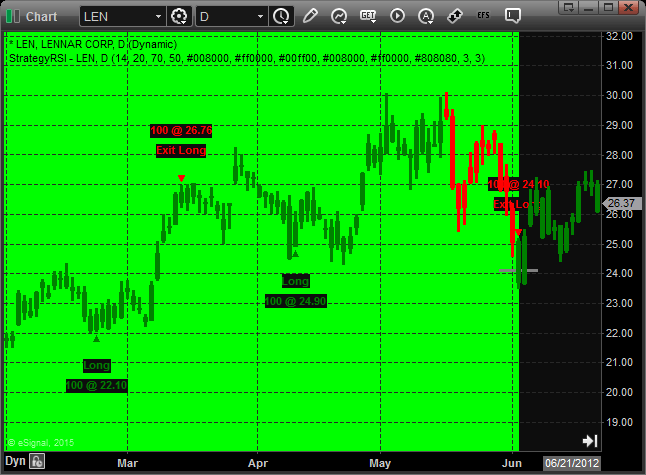
FIGURE 2: eSIGNAL. Here is an example of the study implemented on a chart of Lennar Corp. (LEN), based on Kevin Luo’s article in this issue.
To discuss this study or download a complete copy of the formula code, please visit the EFS Library Discussion Board forum under the forums link from the support menu at www.esignal.com or visit our EFS KnowledgeBase at https://www.esignal.com/support/kb/efs/. The eSignal formula script (EFS) is also available here:
/*********************************

Provided By:

    Interactive Data Corporation (Copyright –í© 2015)

    All rights reserved. This sample eSignal Formula Script (EFS)

    is for educational purposes only. Interactive Data Corporation

    reserves the right to modify and overwrite this EFS file with

    each new release.


Description:

    The RSI & Price Trends


Formula Parameters:                     Default:

Length RSI                              14

Price Change, %                         20

RSI Upper Bound                         70

RSI Lower Bound                         50

Confirmed Long Zone                     lime

Long Trend Color                        green

Short Trend Color                       red

Long Position Color                     green

Short Position Color                    red

Nick Color                              grey

Nick Extension                          3

Nick Thickness                          3


Version:            1.00  04/09/2015


Notes:

    The related article is copyrighted material. If you are not a subscriber

    of Stocks & Commodities, please visit www.traders.com.


**********************************/


var fpArray = new Array();


function preMain(){


    setStudyTitle("StrategyRSI");

    setPriceStudy(true);

    setColorPriceBars(true);

    setComputeOnClose(true);


    var x = 0;


    fpArray[x] = new FunctionParameter("fpLength", FunctionParameter.NUMBER);

    with(fpArray[x++]){


        setName("Length RSI");

        setLowerLimit(1);

        setDefault(14);

    };


    fpArray[x] = new FunctionParameter("fpChange", FunctionParameter.NUMBER);

    with(fpArray[x++]){


        setName("Price Change, %");

        setLowerLimit(0);

        setUpperLimit(100);

        setDefault(20);

    };


    fpArray[x] = new FunctionParameter("fpRSIHighBorder", FunctionParameter.NUMBER);

    with(fpArray[x++]){


        setName("RSI Upper Bound");

        setLowerLimit(0);

        setUpperLimit(100);

        setDefault(70);

    };


    fpArray[x] = new FunctionParameter("fpRSILowBorder", FunctionParameter.NUMBER);

    with(fpArray[x++]){


        setName("RSI Lower Bound");

        setLowerLimit(0);

        setUpperLimit(100);

        setDefault(50);

    };


    fpArray[x] = new FunctionParameter("fpZoneColor", FunctionParameter.COLOR);

    with(fpArray[x++]){


        setName("Confirmed Long Zone");

        setDefault(Color.lime);

    };


    fpArray[x] = new FunctionParameter("fpLongTrendColor", FunctionParameter.COLOR);

    with(fpArray[x++]){


        setName("Long Trend Color");

        setDefault(Color.green);

    };


    fpArray[x] = new FunctionParameter("fpShortTrendColor", FunctionParameter.COLOR);

    with(fpArray[x++]){


        setName("Short Trend Color");

        setDefault(Color.red);

    };


    fpArray[x] = new FunctionParameter("fpLongPosColor", FunctionParameter.COLOR);

    with(fpArray[x++]){


        setName("Long Position Color");

        setDefault(Color.green);

    };


    fpArray[x] = new FunctionParameter("fpShortPosColor", FunctionParameter.COLOR);

    with(fpArray[x++]){


        setName("Short Position Color");

        setDefault(Color.red);

    };


    fpArray[x] = new FunctionParameter("fpNickColor", FunctionParameter.COLOR);

    with(fpArray[x++]){


        setName("Nick Color");

        setDefault(Color.grey);

    };


    fpArray[x] = new FunctionParameter("fpExtNick", FunctionParameter.NUMBER);

    with(fpArray[x++]){


        setName("Nick Extension");

        setLowerLimit(0);

        setDefault(3);

    };


    fpArray[x] = new FunctionParameter("fpThicNick", FunctionParameter.NUMBER);

    with(fpArray[x++]){


        setName("Nick Thickness");

        setLowerLimit(1);

        setUpperLimit(10)

        setDefault(3);

    };

}


var bInit = false;

var bVersion = null;


var xOpen = null;

var xHigh = null;

var xLow = null;


var xRSI = null;


var nChange = null;

var nHighLim = null;

var nLowLim = null;

var nDefLotSize = null;


var nTagID = 0;


var bIsTrend = false;

var bLongTrend = false;

var bShortTrend = false;

var aHignest = {};

var aLowest = {};


function main(fpLength, fpChange,

              fpRSIHighBorder, fpRSILowBorder,

              fpLongTrendColor, fpShortTrendColor,

              fpZoneColor, fpLongPosColor, fpShortPosColor,

              fpNickColor, fpExtNick, fpThicNick){


    if (bVersion == null) bVersion = verify();

    if (bVersion == false) return;


    if (!bInit){


    	xOpen = open();

        xHigh = high();

        xLow = low();


    	xRSI = rsi(fpLength);


        nChange = fpChange / 100;

        nHighLim = 1 + nChange;

        nLowLim = 1 - nChange;


        nDefLotSize = Strategy.getDefaultLotSize();


        bInit = true;

    };


    if (getBarState() == BARSTATE_ALLBARS){

        nTagID = 0;

        bIsTrend = false;

        bLongTrend = false;

        bShortTrend = false;

        aHighest = {};

        aLowest = {};

    }


    var bReverseThisBar = false;


    var nNextOpen = xOpen.getValue(1);

    var nOpen = xOpen.getValue(0);

    var nHigh = xHigh.getValue(0);

    var nLow = xLow.getValue(0);

    var nPrevHigh = xHigh.getValue(-1);

    var nPrevLow = xLow.getValue(-1);


    var nRSI = xRSI.getValue(0);


    if (nPrevHigh == null || nPrevLow == null)

        return;


    var nCurrentBarNumber = getCurrentBarCount();


    if (bShortTrend || !bIsTrend){


        if (nPrevLow < aLowest[0] || aLowest[0] == null){

            aLowest[0] = nPrevLow;

            aLowest[1] = nCurrentBarNumber - 1;

        }


        if (bIsTrend) setPriceBarColor(fpShortTrendColor);


        if (nHigh >= nHighLim * aLowest[0]){


            recalculate(nCurrentBarNumber - aLowest[1] + 1, function(){

                setPriceBarColor(fpLongTrendColor);

            })


            drawLineRelative(-fpExtNick, nHighLim * aLowest[0], fpExtNick, nHighLim * aLowest[0],

                             null, fpThicNick, fpNickColor, nTagID++);


            if (!bIsTrend) bIsTrend = true;

            bLongTrend = true;

            bShortTrend = false;

            bReverseThisBar = true;

            aHighest[0] = nHigh;

            aHighest[1] = nCurrentBarNumber;

        }

    }


    if (bLongTrend || !bIsTrend){


        if (bIsTrend) setPriceBarColor(fpLongTrendColor);


        if ((nPrevHigh > aHighest[0] || aHighest[0] == null) && !bReverseThisBar ){

            aHighest[0] = nPrevHigh;

            aHighest[1] = nCurrentBarNumber - 1;

        }


        if (nLow <= nLowLim * aHighest[0] && !bReverseThisBar){


            recalculate(nCurrentBarNumber - aHighest[1] + 1, function(){

                setPriceBarColor(fpShortTrendColor);

            })


            if (bIsTrend) drawLineRelative(-fpExtNick, nLowLim * aHighest[0], fpExtNick, nLowLim * aHighest[0],

                          null, fpThicNick, fpNickColor, nTagID++);


            if (!bIsTrend) bIsTrend = true;

            bLongTrend = false;

            bShortTrend = true;

            aLowest[0] = nLow;

            aLowest[1] = nCurrentBarNumber;


            var nExitPrice = Math.min(nOpen, nLowLim * aHighest[0]);


            if (Strategy.isLong()){

                Strategy.doSell("Exit Long", Strategy.LIMIT, Strategy.THISBAR, Strategy.DEFAULT, nExitPrice);

                drawShapeRelative(0, AboveBar1, Shape.DOWNTRIANGLE, null, fpShortPosColor,

                Text.PRESET, nTagID++);

                drawTextRelative(0, AboveBar2, "Exit Long", fpShortPosColor, null,

                Text.PRESET|Text.CENTER|Text.BOLD, null, null, nTagID++);

                drawTextRelative(0, AboveBar3, nDefLotSize + " @ " + formatPriceNumber(nExitPrice), fpShortPosColor, null,

                Text.PRESET|Text.CENTER|Text.BOLD, null, null, nTagID++);

            }

        }

        else if (bIsTrend){


            setBarBgColor(fpZoneColor);


            if (nRSI == null)

                return;


            if (nRSI < fpRSILowBorder && !Strategy.isLong()){

                Strategy.doLong("Long", Strategy.MARKET, Strategy.NEXTBAR, Strategy.DEFAULT);

                drawShapeRelative(1, BelowBar1, Shape.UPTRIANGLE, null, fpLongPosColor,

                Text.PRESET, nTagID++);

                drawTextRelative(1, BelowBar2, "Long", fpLongPosColor, null,

                Text.PRESET|Text.CENTER|Text.BOLD, null, null, nTagID++);

                drawTextRelative(1, BelowBar3, nDefLotSize + " @ " + formatPriceNumber(nNextOpen), fpLongPosColor, null,

                Text.PRESET|Text.CENTER|Text.BOLD, null, null, nTagID++);

            }


            if (nRSI > fpRSIHighBorder && Strategy.isLong()){

                Strategy.doSell("Exit Long", Strategy.MARKET, Strategy.NEXTBAR, Strategy.DEFAULT);

                drawShapeRelative(1, AboveBar1, Shape.DOWNTRIANGLE, null, fpShortPosColor,

                Text.PRESET, nTagID++);

                drawTextRelative(1, AboveBar2, "Exit Long", fpShortPosColor, null,

                Text.PRESET|Text.CENTER|Text.BOLD, null, null, nTagID++);

                drawTextRelative(1, AboveBar3, nDefLotSize + " @ " + formatPriceNumber(nNextOpen), fpShortPosColor, null,

                Text.PRESET|Text.CENTER|Text.BOLD, null, null, nTagID++);

            }

        }

    }

}


function verify(){


    var b = false;

    if (getBuildNumber() < 3435){


        drawTextAbsolute(5, 35, "This study requires version 11.8 or later.",

            Color.white, Color.blue, Text.RELATIVETOBOTTOM|Text.RELATIVETOLEFT|Text.BOLD|Text.LEFT,

            null, 13, "error");

        drawTextAbsolute(5, 20, "Click HERE to upgrade.@URL=https://www.esignal.com/download/default.asp",

            Color.white, Color.blue, Text.RELATIVETOBOTTOM|Text.RELATIVETOLEFT|Text.BOLD|Text.LEFT,

            null, 13, "upgrade");

        return b;

    }

    else

        b = true;


    return b;

}
—Eric Lippert
eSignal, an Interactive Data company
800 779-6555, www.eSignal.com
BACK TO LIST

METASTOCK: JUNE 2015
Kevin Luo’s article in this issue, “The RSI & Price Trends,” discusses ways to improve on the traditional RSI buy & sell signals. The MetaStock formulas given here are one possible method of using these ideas.
Buy Order:

peakbars(1, c, 20) > troughbars(1,c,20) AND
barssince(c>trough(1,c,20) < troughbars(1, c, 20) AND cross(RSI(14), 50)


Sell Order:

peakbars(1, c, 20) < troughbars(1,c,20) AND
Cross(troughbars(1, c, 20), C)
—William Golson
MetaStock Technical Support
www.metastock.com
BACK TO LIST

WEALTH-LAB: JUNE 2015
RSI is many a technical analyst’s darlin’, one of industry-standard indicators that has served as a playground for many modifications. In his article in this issue, “The RSI & Price Trends,” Kevin Luo demonstrates that RSI classic countertrend trading rules can be traded profitably and without modifications. According to the author, buying at the close when RSI falls below 30 and selling when it surges above 70 works.
Here is one caveat that should not be overlooked: Out of the 10-year backtest period, 80% of the time was spent in a major bull market. In the last 10 years, “correctional movements,” as the author calls them, of 2008, 2010, and 2011 in the Russell 2000 or S&P 500 indexes accounted for just two years in sum. In such a market, trading the corrections is natural and easy; but for how long will the bubble last?
To improve trading results, the author investigates modifying the RSI trading rules using a couple of logical and simple filters. First, it’s possible to get rid of the less-probable trades by making entries only during uptrends. An uptrend is defined with a trailing filter that is activated when prices move up by more than 20% from a low (and vice versa for downtrend). This should help reduce the number of trades during a downtrend. Another tweak is to close positions when a 20% uptrend reverses, that is, when prices decline 20% or greater from the last uptrend’s peak.
Finally, trades can be taken when the RSI appears stronger and crosses above 50 rather than 30. From our observations, it’s this rising RSI requirement that has the salient effect on the system’s profitability.
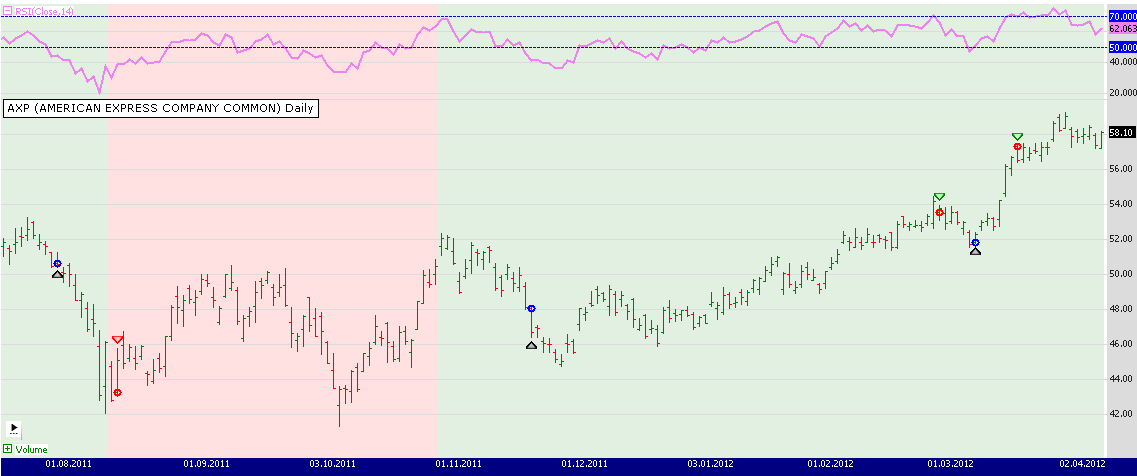
FIGURE 3: WEALTH-LAB. This Wealth-Lab 6 chart illustrates the sample system’s performance on a daily chart of American Express (AXP).
Figure 3 demonstrates the application of two filters: exiting a position when price falls below 20% from a trend’s peak, and subsequent entries made in an uptrend when the RSI declined below 50. In the resulting RSI trading system written in C# for Wealth-Lab 6, all the options can be activated individually. The code is as follows:
using System;
using System.Collections.Generic;
using System.Text;
using System.Drawing;
using WealthLab;
using WealthLab.Indicators;
using Community.Indicators;

namespace WealthLab.Strategies
{
	public class TASCJune2015 : WealthScript
	{
		private StrategyParameter paramRSI;
		private StrategyParameter paramMult;
		private StrategyParameter paramUseTF;
		private StrategyParameter paramUseRisingRSI;
		private StrategyParameter paramCloseOnReverse;

		public TASCJune2015()
		{
			paramRSI = CreateParameter("RSI Period", 14, 2, 30, 2);
			paramMult = CreateParameter("% Reversal", 20, 5, 50, 5);
			paramUseTF = CreateParameter("Trend filter?", 0, 0, 1, 1);
			paramUseRisingRSI = CreateParameter("Rising RSI?", 0, 0, 1, 1);
			paramCloseOnReverse = CreateParameter("Close on reverse?", 0, 0, 1, 1);
         }

		protected override void Execute()
		{
			double Mult = paramMult.Value;
			bool trendFilter = paramUseTF.ValueInt == 1 ? true : false;

			// Entering when the RSI is moving up and crossing above 50.
			bool risingRSI = paramUseRisingRSI.ValueInt == 1 ? true : false;

			// Closing positions when uptrend reverses, that is, prices move down by more than 20% from the high of prior uptrend.
            bool closeOnTrendReverse = paramCloseOnReverse.ValueInt == 1 ? true : false;
			double ob = 70, os = risingRSI ? 50 : 30;

			NRTR_Percent trendLine = NRTR_Percent.Series( Bars, Mult );
			//PlotSeries( PricePane, trendLine, Color.Blue, LineStyle.Solid, 2 );

			int rsiPeriod = paramRSI.ValueInt;
			RSI rsi = RSI.Series( Close, rsiPeriod );
			ChartPane rsiPane = CreatePane( 30,true,true );
			PlotSeries( rsiPane, rsi, Color.Violet, LineStyle.Solid, 2 );
			DrawHorzLine( rsiPane, ob, Color.Blue, LineStyle.Dashed, 1 );
			DrawHorzLine( rsiPane, os, Color.Blue, LineStyle.Dashed, 1 );
            for(int bar = GetTradingLoopStartBar(20); bar < Bars.Count; bar++)
			{
				//	Entering trades only during uptrends, that is, when prices move up by more than 20% from low of prior uptrend.
				bool uptrend = Close[bar] > trendLine[bar];
				SetBackgroundColor( bar, Color.FromArgb( 30, uptrend ? Color.Green : Color.Red ) );

				if (IsLastPositionActive)
				{
					if( closeOnTrendReverse )
					{
						if( !uptrend )
							SellAtMarket(bar+1, LastPosition, "Uptrend reversed" );
					}

					if( CrossOver( bar, rsi, ob ) )
					{
						SellAtMarket(bar+1, LastPosition, "RSI" );
					}
				}
				else
				{
					if( CrossUnder( bar, rsi, os ) )
					{
						if( ( trendFilter && uptrend ) || !trendFilter )
							BuyAtMarket(bar+1, Bars.FormatValue(rsi[bar]) );
					}
				}
			}
		}
	}
}
—Eugene, Wealth-Lab team
MS123, LLC
www.wealth-lab.com
BACK TO LIST

AMIBROKER: JUNE 2015
In “The RSI & Price Trends” in this issue, author Kevin Luo presents a simple trading system based on RSI signals filtered with a trend indicator. A ready-to-use formula based on Luo’s system is shown here for AmiBroker. It can be applied either on a chart or in the analysis window for backtesting.
A sample chart is shown in Figure 4.
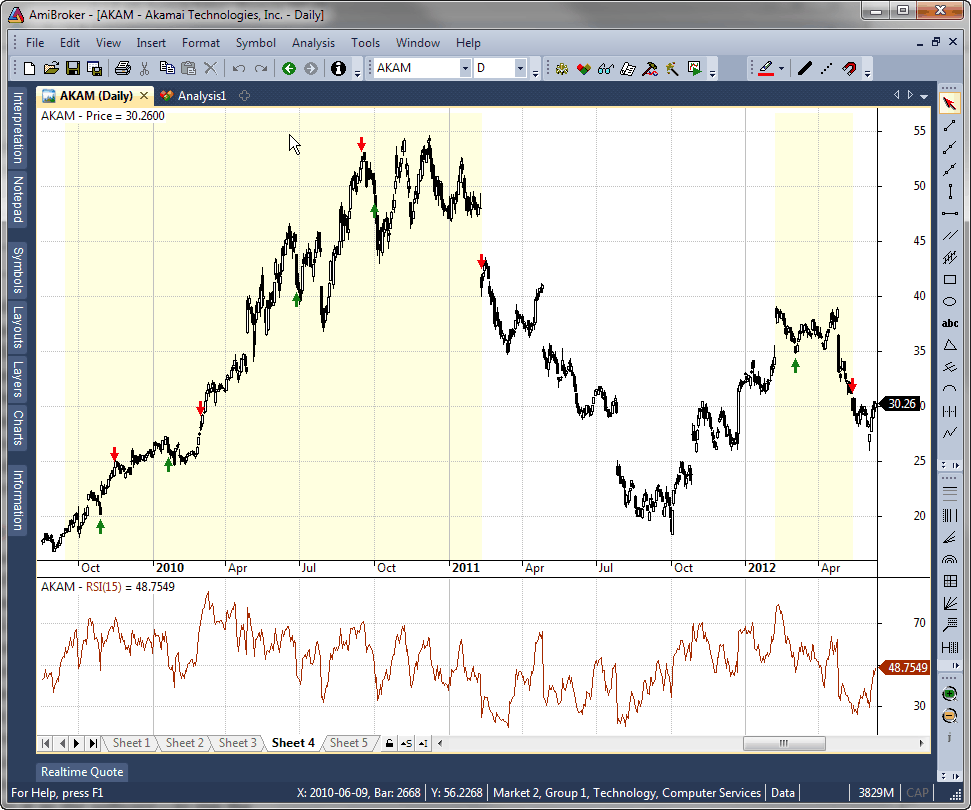
FIGURE 4: AMIBROKER. In this daily chart of AKAM, uptrend periods are shown using a pale yellow background. Also shown are buy/sell signals generated using 50/70 RSI crossovers during those uptrend periods.
AmiBroker formula language
// uptrend defined as moving 20% above
// one year lowest low
// downtrend defined as moving 20% below
// one year highest high

YearlyLow = LLV( C, 252 );
YearlyHigh = HHV( C, 252 );

UpTrendBegin = Close > 1.2 * YearlyLow;
DownTrendBegin = Close < 0.8 * YearlyHigh;

InUpTrend = Flip( UpTrendBegin, DownTrendBegin );

// open new long positions only in uptrend
Buy = InUpTrend AND Cross( 50, RSI( 14 ) );
// sell when uptrend ended or RSI cross
Sell = NOT InUpTrend OR Cross( RSI( 14 ), 70 );

// remove excessive signals
Buy = ExRem( Buy, Sell );
Sell = ExRem( Sell, Buy );

Plot( C, "Price", colorDefault, styleCandle );

Plot( InUpTrend, "", colorLightYellow, styleArea | styleOwnScale | styleNoLabel, 0, 1, 0, -2 );

PlotShapes( Buy * shapeUpArrow, colorGreen, 0, L );
PlotShapes( Sell * shapeDownArrow, colorRed, 0, H );
—Tomasz Janeczko, AmiBroker.com
www.amibroker.com
BACK TO LIST

NEUROSHELL TRADER: JUNE 2015
The RSI price trends method described by Kevin Luo in his article in this issue, “The RSI & Price Trends,” can be easily implemented with a few of NeuroShell Trader’s 800+ indicators and one indicator from the Turning Points add-on for NeuroShell Trader that implements Luo’s trend condition.
The Turning Point Percent indicator computes the percent change in price between two arbitrary turning points.
BUY LONG CONDITIONS: 			RSI > 50
    (both conditions must be true)	TURNING POINT PERCENT  > 10
					(value adjusted for example stock)

SELL LONG CONDITION:			TURNING POINT PERCENT < 10
Users of NeuroShell Trader can go to the Stocks & Commodities section of the NeuroShell Trader free technical support website to download a copy of this or any previous Traders’ Tips.
A sample chart is shown in Figure 5.
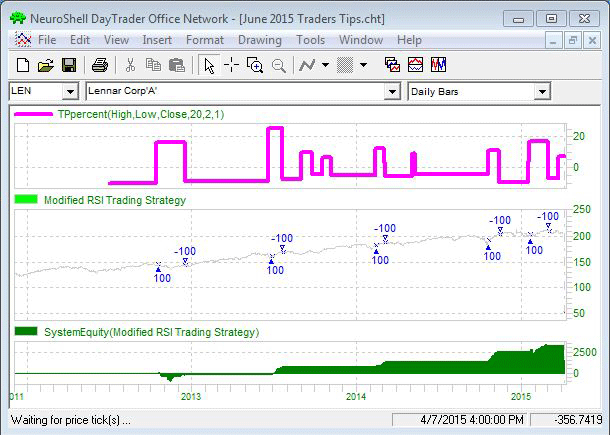
FIGURE 5: NEUROSHELL TRADER. This NeuroShell Trader chart displays the combined RSI and price trends trading system described by Kevin Luo in his article in this issue.
—Marge Sherald, Ward Systems Group, Inc.
301 662-7950, sales@wardsystems.com
www.neuroshell.com
BACK TO LIST

NINJATRADER: JUNE 2015
In “The RSI & Price Trends” in this issue, author Kevin Luo presents a strategy based on the relative strength index. We are making available for download a strategy based on the article named “RSIandPriceTrends” at www.ninjatrader.com/SC/June2015SC.zip.
Once you have downloaded it, from within the NinjaTrader Control Center window, select the menu File → Utilities → Import NinjaScript and select the downloaded file. This file is for NinjaTrader version 7 or greater.
You can review the strategy source code by selecting the menu Tools → Edit NinjaScript → Strategy from within the NinjaTrader Control Center window and selecting the “RSIandPriceTrends” file.
A sample chart implementing the strategy is shown in Figure 6.
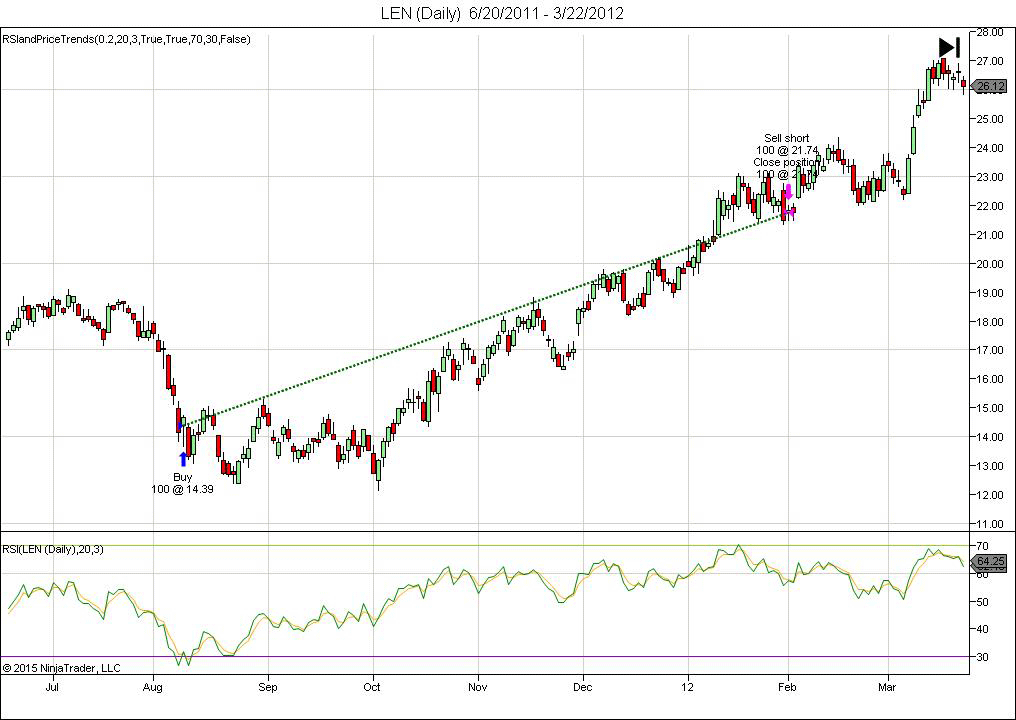
FIGURE 6: NINJATRADER. This screenshot shows the strategy applied to a daily chart of LEN in NinjaTrader.
—Raymond Deux & Patrick Hodges
NinjaTrader, LLC, www.ninjatrader.com
BACK TO LIST

UPDATA: JUNE 2015
Our Traders’ Tips for this month is based on “The RSI & Price Trends” by Kevin Luo. In the article, Luo returns to a technical analysis classic—the relative strength index (RSI)—and overlays some bespoke trading rules based on observations of price trend and RSI levels. The author proposes that stocks with a shorter trend improve the performance of the RSI.
The stock index subset selection can be done in the scan section of the Updata terminal prior to running the system code.
A sample chart is shown in Figure 7.
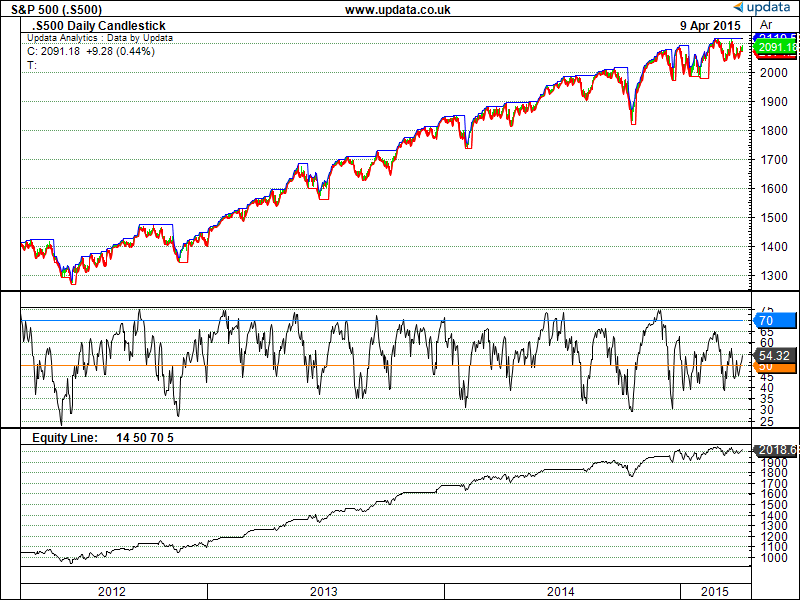
FIGURE 7: UPDATA. This chart shows the trading rules as applied to S&P 500 index data of daily resolution, with 5% trends.
We are making the Updata code for this article available in the Updata library. It may be downloaded by clicking the custom menu and system library. Those who cannot access the library due to a firewall may paste the code shown below into the Updata custom editor and save it.
PARAMETER "RSI Period" #PERIOD=14
PARAMETER "Buy Level" #BUYLEVEL=50
PARAMETER "Sell Level" #SELLLEVEL=70
PARAMETER "% Move Mode" @PCT=20
DISPLAYSTYLE 5LINES
INDICATORTYPE TOOL
INDICATORTYPE3 CHART
COLOUR RGB(0,0,255)
COLOUR2 RGB(255,0,0)
COLOUR4 RGB(0,0125,255)
COLOUR5 RGB(255,125,0)
NAME "" ""
@RSI=0
@MODE=1
@LOWPRICE=0
@HIGHPRICE=0
FOR #CURDATE=#PERIOD TO #LASTDATE
   @RSI=RSI(#PERIOD)
   'KEEPS TRACK OF HIGH/LOW POINT IN TREND
   IF @MODE=1 AND HIST(@MODE,1)=1
      @HIGHPRICE=MAX(HIGH,@HIGHPRICE)
      @LOWPRICE=LOW
      IF 100*(@HIGHPRICE-LOW)/@HIGHPRICE>@PCT
         @MODE=-1
      ENDIF
    ELSEIF @MODE=1 AND HIST(@MODE,1)!=1
      @HIGHPRICE=HIGH
   ENDIF
   IF @MODE=-1 AND HIST(@MODE,1)=-1
      @LOWPRICE=MIN(LOW,@LOWPRICE)
       @HIGHPRICE=HIGH
      IF 100*(HIGH-@LOWPRICE)/@LOWPRICE>@PCT
         @MODE=1
      ENDIF
      @LOWPRICE=LOW
   ENDIF
   'ENTRY RULES
   IF @MODE=-1 AND @RSI<#BUYLEVEL
      COVER CLOSE
   ENDIF
   IF @MODE=1 AND @RSI>#SELLLEVEL
      SELL CLOSE
   ENDIF
   IF @MODE=1 AND @RSI<#BUYLEVEL
      BUY CLOSE
   ENDIF
   IF @MODE=-1 AND @RSI>#SELLLEVEL
      SHORT CLOSE
   ENDIF
   @PLOT=@HIGHPRICE
   @PLOT2=@LOWPRICE
   @PLOT3=@RSI
   @PLOT4=#SELLLEVEL
   @PLOT5=#BUYLEVEL
NEXT
—Updata support team
support@updata.co.uk, www.updata.co.uk
BACK TO LIST

AIQ: JUNE 2015
The AIQ code I am providing this month is based on Kevin Luo’s article in this issue, “The RSI & Price Trends.” The code provides a long-only trading system suggested by Luo in his article. It has the following rules:
- Enter trades only during uptrends, that is, when highest high since the lowest low is at least equal to X% from the low of the lowest low in the long-term lookback and when the highest high since the lowest low is at least equal to Y% from the low of the lowest low in the short-term lookback, and
- Enter when the RSI is moving up and crossing above 50
- Close positions when the uptrend reverses, that is, prices move down by more than 20% from the high of the prior uptrend, or
- Close when the RSI crosses down from above 70.
Figure 8 shows the equity curve and key metrics for the system trading the NASDAQ 100 list of stocks from 1/3/2000 to 4/21/2015. Commission and slippage have been subtracted. The system nicely beats the NDX index over the same time period both in return and maximum drawdown.
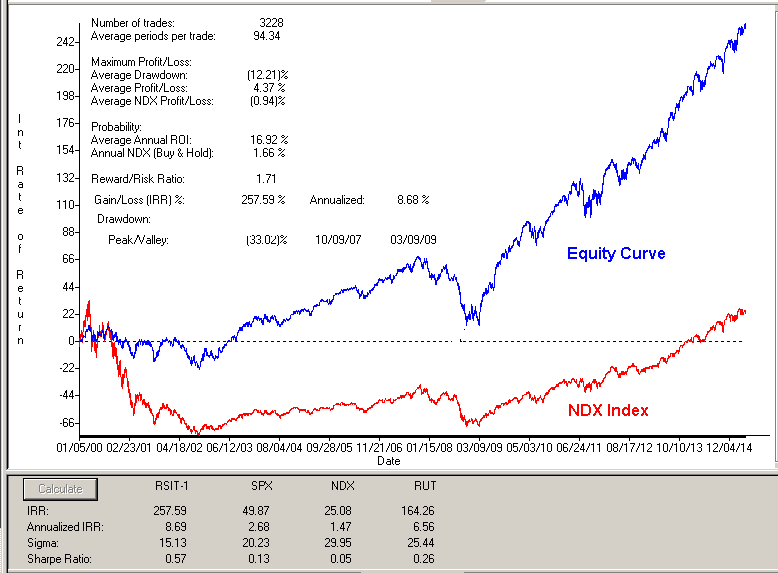
FIGURE 8: AIQ. This shows the equity curve and key metrics for the system trading the NASDAQ 100 list of stocks from 1/3/2000 to 4/21/2015
The code and EDS file can be downloaded from www.TradersEdgeSystems.com/traderstips.htm.
The code is as follows:
!RSI & PRICE TRENDS

!Author: Kevin Luo, TASC June 2015

!Coded by: Richard Denning 4/21/2015

!www.TradersEdgeSystems.com


!INPUTS

! PARAMETERS:

! ***********Entry Setup Parameters***************

rsiLen 	is 	14.	! rsi length

buyLvl 	is 	50.	! level for rsi to get a buy setup

LLlen1  is      250.    ! long term lookbakc for lowest low

LLlen2  is      20.     ! short term lookback for lowest low

minPctUp1 is 	20.     ! percent up from lowest low in lookback to make an uptrend

minPctUp2 is 	5.     ! percent up from lowest low in lookback to make an uptrend


!************Exit Parameters***********************

exitLvl	  is 	70.	! level for rsi to get a buy setup

!**************INDICATOR CODE****************************

!! RSI WILDER

!To convert Wilder Averaging to Exponential Averaging use this formula:

!ExponentialPeriods = 2 * WilderPeriod - 1.


	U 	is [close]-val([close],1).

	D 	is val([close],1)-[close].


	W1	is rsiLen.

	rsiLen1	is 2 * W1 - 1.

	AvgU 	is ExpAvg(iff(U>0,U,0),rsiLen1).

	AvgD 	is ExpAvg(iff(D>=0,D,0),rsiLen1).

	rsi 	is 100-(100/(1+(AvgU/AvgD))).

!SYSTEM CODE:

LL1 is loval([low],LLlen1).

LL2 is loval([low],LLlen2).

OSD is offsettodate(month(),day(),year()).

BarsSinceLL1 is scanany([low] = ^LL1,LLlen1) then OSD.

BarsSinceLL2 is scanany([low] = ^LL2,LLlen2) then OSD.

HHsinceLL1 is hival([high],^BarsSinceLL1).

HHsinceLL2 is hival([high],^BarsSinceLL2).

TrendUpLT if (HHsinceLL1 / LL1 - 1)*100 >= minPctUp1.

TrendUpST if (HHsinceLL2 / LL2 - 1)*100 >= minPctUp2.


Buy if TrendUpLT and TrendUpST

	and rsi>buyLvl and valrule(rsi<buyLvl,1).

ExitBuy if (HHsinceLL1 / LL1 - 1)*100 <= minPctUp1

	!or (HHsinceLL2 / LL2 - 1)*100 <= minPctUp2

	or (rsi<exitLvl and valrule(rsi>=exitLvl,1)).

	!or countof(rsi < buyLvl,3,1)=3.

RoC1 is (HHsinceLL1 / LL1 - 1)*100.
—Richard Denning
info@TradersEdgeSystems.com
for AIQ Systems
BACK TO LIST

TRADERSSTUDIO: JUNE 2015
The TradersStudio code for Kevin Luo’s article “RSI & Price Trends” can be found at:
The following code files are contained in the download from the websites:
- System: RSITREND - a long only system that uses daily data and buys stocks in the session list that meet the folloing entry and exit criteria:
- Enter trades only during uptrends, that is, when highest high since the lowest low is at least equal to X% from low of the lowest low in long term lookback and when when the highest high since the lowest low is at least equal to Y% from low of the lowest low in short term lookback and
- Entering when the RSI is moving up and crossing above 50.
- Closing positions when uptrend reverses, that is, prices move down by more than 20% from the high of prior uptrend or
- Closing when the the RSI crosses down from above 70.
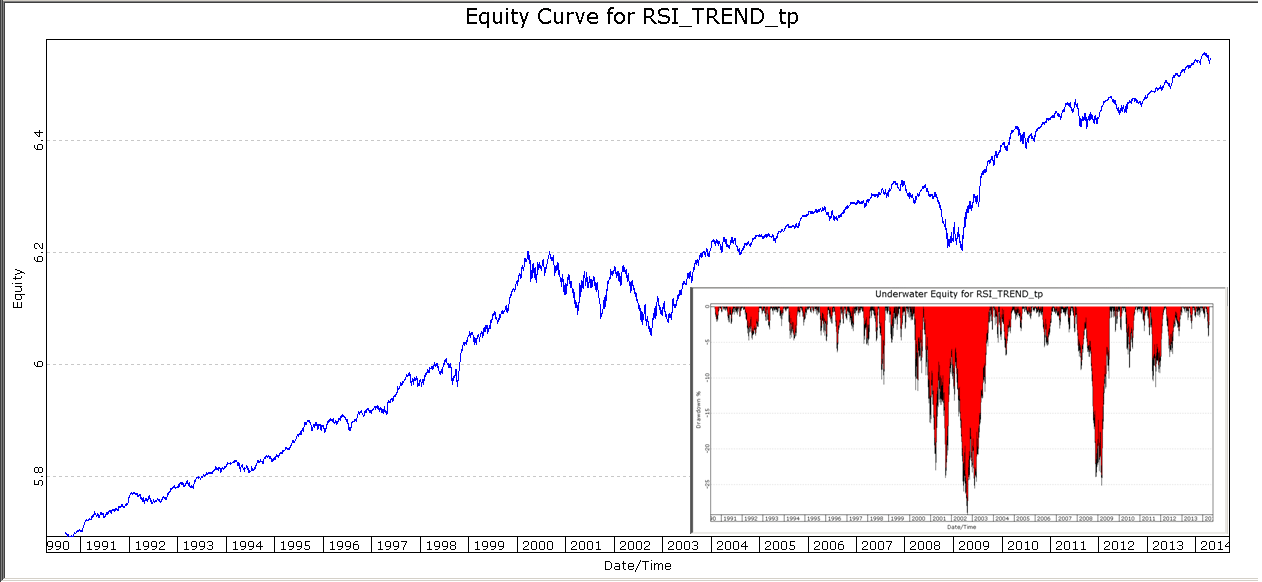
FIGURE 9: LOG EQUITY CURVE AND UNDERWATER EQUITY CURVE FOR THE RSI TREND SYSTEM. Run on the EQUALDOLLAR tradeplan using the NASDAQ 100 list of stocks for the years 1991 through 2014.
Using the NASDAQ 100 list of stocks, I ran the EQUALDOLLAR tradeplan that comes with TradersStudio. Figure 9 shows the log chart of the equity curve for the years 1991 through 2014. Also in the same figure is the underwater equity curve. The system returned about 9% compounded over the period with two of the largest draw downs occurring during the 2000 to 2003 (29%) and the 2007 to 2009 (25%) bear market. Otherwise the draw downs run around 5% – 10%.
The code is also shown here:
'RSI & PRICE TRENDS

'Author: Kevin Luo, TASC June 2015

'Coded by: Richard Denning 4/22/2015

'www.TradersEdgeSystems.com


Sub RSITREND(rsiLen,buyLvl,LLlen1,LLlen2,minPctUp1,minPctUp2,exitLvl)

'rsiLen=14,buyLvl=50,LLlen1=250,LLlen2=20,minPctUp1=20,minPctUp2=5,exitLvl=70

Dim theRSI As BarArray

theRSI = rsi(C,rsiLen,0)

'Dim LL1 As BarArray

'Dim LL2 As BarArray

Dim LL1, LL2, barsSinceLL1, barsSinceLL2,  HHsinceLL1, HHsinceLL2, RoC1, RoC2

Dim trendUpLT As BarArray

Dim trendUpST As BarArray

LL1 = Lowest(L,LLlen1,0)

LL2 = Lowest(L,LLlen2,0)

barsSinceLL1 = MRO(L = LL1,LLlen1,1)

barsSinceLL2 = MRO(L = LL2,LLlen2,1)

HHsinceLL1 = Highest(H,barsSinceLL1,0)

HHsinceLL2 = Highest(H,barsSinceLL2,0)

RoC1 = (HHsinceLL1 / LL1 - 1) * 100

RoC2 = (HHsinceLL2 / LL2 - 1) * 100

trendUpLT = RoC1 >= minPctUp1

trendUpST = RoC2 >= minPctUp2

If trendUpLT And trendUpST And theRSI>buyLvl And theRSI[1]<= buyLvl Then

    Buy("LE",1,0,Market,Day)

End If

If RoC1 < minPctUp1 Then ExitLong("LX_trend","",1,0,Market,Day)

If theRSI<exitLvl And theRSI[1]>=exitLvl Then ExitLong("LX_rsi","",1,0,Market,Day)

End Sub
Richard Denning
info@TradersEdgeSystems.com
for TradersStudio
BACK TO LIST

THINKORSWIM: JUNE 2015
In his article titled “The RSI & Price Trends”, Kevin Luo attempts to build a winning strategy around an old technical analysis tool RSI. We have built his RSITrend Strategy using our proprietary scripting language, thinkscript. We have made the loading process extremely easy, simply click on the link here https://tos.mx/PKDtbn and choose Backtest in thinkorswim, then choose to rename your Strategy to RSITrend. You can adjust the parameters of these within the Edit Studies window to fine tune your variables.
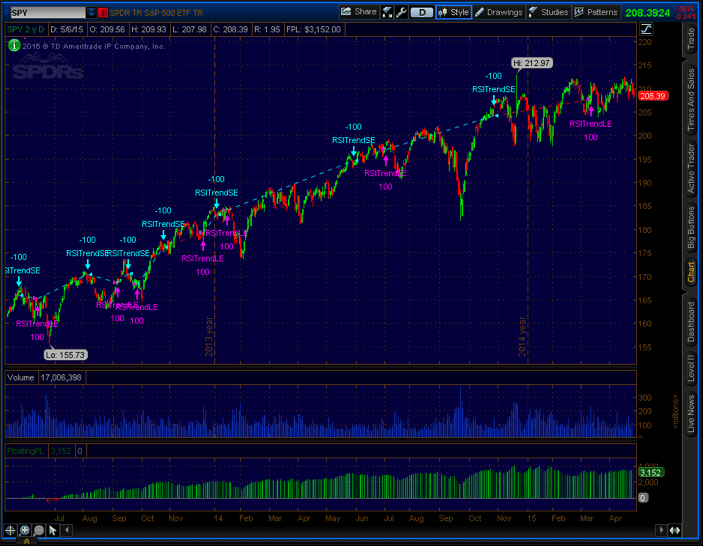
FIGURE 10: THINKORSWIM.
In the example above (Figure 10) we see entry and exit points based on the logic which the article defined. This is for symbol SPY, and you can see the green historgram below the volume displays the profit based on this strategy. For a detailed description see the article in Technical Analysis of STOCKS & COMMODITIES Magazine.
—thinkorswim
A division of TD Ameritrade, Inc.
www.thinkorswim.com
BACK TO LIST
Originally published in the June 2015 issue of
Technical Analysis of STOCKS & COMMODITIES magazine.
All rights reserved. © Copyright 2015, Technical Analysis, Inc.