TRADERS’ TIPS
May 2015
For this month’s Traders’ Tips, the focus is Giorgos Siligardos’ article
in this issue, “Filtering Price Movement.” Here, we present the
May 2015 Traders’ Tips code with possible implementations in various
software.
Code for MetaStock is already provided by Siligardos in his article, which
S&C subscribers will find in the Subscriber Area of our website here.
The Traders’ Tips section is provided to help the reader implement
a selected technique from an article in this issue or another recent issue.
The entries here are contributed by software developers or programmers for
software that is capable of customization.

TRADESTATION: MAY 2015
In “Filtering Price Movement” in this issue, author Giorgos Siligardos
describes a process to analyze historical market data. He begins by describing
a concept that he refers to as perceptually important points (PIPs),
which he uses to identify price extremes. From these, he creates an indicator
he calls zzTOP that identifies these points and then connects them using trendlines.
For convenience, we’re providing the code for a TradeStation indicator
based on the author’s description.
using elsystem;
using elsystem.collections ;
using elsystem.drawingobjects ;
using elsystem.drawing ;

inputs:
int Iterations( 3 );

variables:
	Vector BarData ( NULL ), // Bar DTP
	Vector Segments ( NULL ); // of Rounds of Pairs

method void CreateTL ( DTPoint Begin_DTP,
	DTPoint End_DTP )
	variables: TrendLine New_TL ;
	begin
	New_TL = TrendLine.Create( Begin_DTP, End_DTP ) ;
	New_TL.ExtLeft = false ;
	New_TL.ExtRight = false ;
	New_TL.Persist = true ;
	New_TL.Color = Color.Aquamarine ;
	DrawingObjects.Add( New_TL ) ;
	end ;

method void LoadBarDataVector ()
	begin
	if BarData <> NULL then
		BarData.Push_Back(
			DTPoint.Create( BarDateTime, Close ) astype DTPoint ) ;
	end ;

method DTPoint BisectPairs ( Vector DTPPair )
	variables: DTPoint BegDTP, DTPoint EndDTP,
			DTPoint MidDTP,
			int BarDataStartIndex, int BarDataEndIndex,
			int BarDataCnt,
			int HighDiffIndex, double HighDiff,
			int Count, double TL_Val  ;
	begin
	HighDiffIndex = 0 ;
	HighDiff = -999999 ;

	BegDTP = DTPPair.Items[0] astype DTPoint ;
	EndDTP = DTPPair.Items[1] astype DTPoint ;

	for Count = 0 to BarData.Count - 1
		begin
		if (BarData.Items[Count] astype DTPoint).DateTimeOfBar =
			BegDTP.DateTimeOfBar then
			BarDataStartIndex = Count ;
		if (BarData.Items[Count] astype DTPoint).DateTimeOfBar =
			EndDTP.DateTimeOfBar then
			BarDataEndIndex = Count ;
		end ;

	BarDataCnt = BarDataEndIndex - BarDataStartIndex ;
	if BarDataCnt = 0
		then BarDataCnt +=1 ;
	for Count = BarDataStartIndex to BarDataEndIndex
		begin
		// Find TL Value
		TL_Val = (BarData.Items[BarDataStartIndex]
			astype DTPoint).Price astype double +
			(( BarData.Items[BarDataEndIndex] astype DTPoint).Price astype double -
			(BarData.Items[BarDataStartIndex] astype DTPoint).Price astype double )
			* ( ( Count ) / BarDataCnt ) ;
		if AbsValue( TL_Val - (BarData.Items[Count] astype DTPoint).
			Price astype double ) > HighDiff then
			begin
			HighDiff = AbsValue( TL_Val -
				(BarData.Items[Count] astype DTPoint).Price astype double ) ;
			HighDiffIndex = Count ;
			end ;
		end ;
	MidDTP = BarData.Items[HighDiffIndex] astype DTPoint ;
	return MidDTP ;
	end;

method void findDiffBisect( )
	variables: Vector RecursRound, Vector NewRound,
				Vector NewPairR, Vector NewPairL,
				int Count, bool OKToUse,
				DTPoint BegDTP, DTPoint EndDTP,  DTPoint MidDTP ;
	begin
	NewRound = new Vector ;
	RecursRound = new Vector ;
	OKToUse = false ;
	RecursRound = segments.Items[Segments.Count -1] astype Vector ;
	for Count = 0 to RecursRound.Count -1
		begin
			begin
			MidDTP = BisectPairs( RecursRound.Items[Count] astype Vector ) ;
			NewPairL = new Vector ;
			NewPairL.Push_Back( (RecursRound.Items[Count]
				astype Vector).Items[0] astype DTPoint ) ;
			NewPairL.Push_Back(  MidDTP astype DTPoint ) ;
			NewRound.Push_Back( NewPairL astype Vector ) ;
			NewPairR = new Vector ;
			NewPairR.Push_Back(  MidDTP astype DTPoint ) ;
			NewPairR.Push_Back( (RecursRound.Items[Count]
				astype Vector).Items[1] astype DTPoint ) ;
			NewRound.Push_Back( NewPairR astype Vector ) ;
			end ;
		end ;
	Segments.push_back( NewRound ) ;
	end ;

method void SeedSegmentsVector()
	variables: Vector RecursRound, Vector Pair ;
	begin
	Pair = new Vector ;
	RecursRound = new Vector ;
	Pair.Push_Back( BarData.Items[0] astype DTPoint ) ;
	Pair.Push_Back( BarData.Items[BarData.Count -1] astype DTPoint ) ;
	RecursRound.Push_Back( Pair astype Vector ) ;
	Segments.Push_Back( RecursRound astype Vector ) ;
	end ;

method void DrawAllTLs( )
	variables: Vector RecursRound, Vector Pair, int Count ;
	begin
	Pair = new Vector ;
	RecursRound = new Vector ;
	RecursRound = Segments.Items[Segments.Count -1] astype vector ;
	Print( "TLStart" ) ;
	for Count = 0 to RecursRound.Count -1
		begin
		Pair = RecursRound.Items[Count] astype Vector ;
		CreateTL( Pair.Items[0] astype DTPoint, Pair.Items[1] astype DTPoint );
		end ;
	end ;

once
	begin
	ClearPrintLog ;
	BarData = new Vector ;
	Segments = new Vector ;
	end ;

if BarStatus( DataNum + 1 ) = 2	then
	LoadBarDataVector () ;

once ( LastBarOnChartEx )
	begin
	SeedSegmentsVector( ) ;
	For Value1 = 1 to Iterations
		begin
		findDiffBisect(  ) ;
		end ;
	DrawAllTLs( ) ;
	end ;
To download the EasyLanguage code, please visit our TradeStation and EasyLanguage
support forum. The code can be found here: https://www.tradestation.com/TASC-2015.
The ELD filename is “_TASC_ModifiedTrueRange.ELD.” For more information
about EasyLanguage in general, please see https://www.tradestation.com/EL-FAQ.
A sample chart is shown in Figure 1.
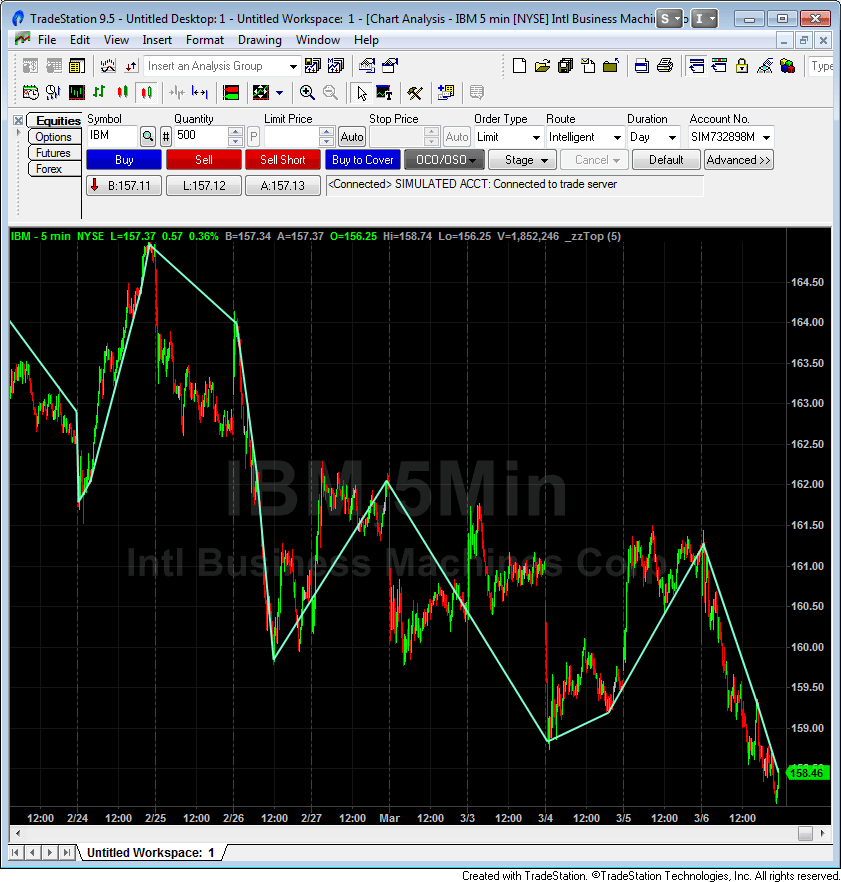
FIGURE 1: TRADESTATION. Here, the zzTop indicator is
applied to an intraday chart of IBM.
This article is for informational purposes. No type of trading or investment
recommendation, advice, or strategy is being made, given, or in any manner
provided by TradeStation Securities or its affiliates.
—Doug McCrary
TradeStation Securities, Inc.
www.TradeStation.com
BACK TO LIST

eSIGNAL:
MAY 2015
For this month’s Traders’ Tip, we’ve provided the formulas zzTOP.efs and zzTOPauto.efs based
on the formulas described in Giorgos Siligardos’ article in this issue, “Filtering
Price Movement.”
The studies contain formula parameters to set the desired period and price,
which may be configured through the edit chart window (right-click
on the chart and select “edit chart”) to set the desired period
and price. A sample chart is shown in Figure 2.
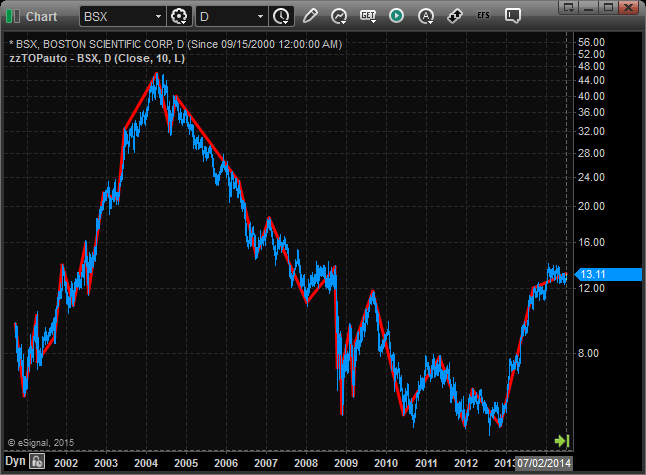
FIGURE 2: eSIGNAL. Here is an example of the study implemented
on a chart of Boston Scientific Corp. (BSX).
To discuss these studies or download a complete copy of the formulas’ code,
please visit the EFS Library Discussion Board forum under the forums link
from the support menu at www.esignal.com or
visit our EFS KnowledgeBase at https://www.esignal.com/support/kb/efs/.
The eSignal formula scripts (EFS) are also available for copying & pasting
below.
zzTOP.efs:
/*********************************
Provided By:
    Interactive Data Corporation (Copyright В© 2015)
    All rights reserved. This sample eSignal Formula Script (EFS)
    is for educational purposes only. Interactive Data Corporation
    reserves the right to modify and overwrite this EFS file with
    each new release.

Description:
    Filtering Price Movement by Giorgos E. Siligardos

Formula Parameters:                     Default:
Indicator                               Close
LegsNo                                  20
Scale                                   A

Version:            1.00  03/11/2015

Notes:
    The related article is copyrighted material. If you are not a subscriber
    of Stocks & Commodities, please visit www.traders.com.

**********************************/

var fpArray = new Array();

function preMain(){

    setStudyTitle("zzTOP");
    setPriceStudy(true);
    setComputeOnClose(true);

    var x = 0;

    fpArray[x] = new FunctionParameter("fpIndicator", FunctionParameter.STRING);
    with(fpArray[x++]){
        setName("Indicator");
        addOption("Close");
        addOption("Open");
        addOption("High");
        addOption("Low");
        setDefault("Close");
    }

    fpArray[x] = new FunctionParameter("fpLegsNo", FunctionParameter.NUMBER);
    with(fpArray[x++]){
        setName("LegsNo");
        setLowerLimit(1);
        setDefault(20);
    }

    fpArray[x] = new FunctionParameter("fpScale", FunctionParameter.STRING);
    with(fpArray[x++]){
        setName("Scale");
        addOption("A");
        addOption("L");
        setDefault("A");
    }
}

var bInit = false;
var bVersion = null;

var xSourceBase = null;
var xSource = null;

function main(fpIndicator, fpLegsNo, fpScale){

    if (!bInit){

        switch (fpIndicator){
            case "Close":
                xSourceBase = close();
                break;
            case "Open":
                xSourceBase = open();
                break;
            case "High":
                xSourceBase = high();
                break;
            case "Low":
                xSourceBase = low();
                break;
            default: return;
        }

        if (fpScale == "L")
            xSource = efsInternal("calc_Log", xSourceBase)
        else
            xSource = xSourceBase;

        bInit = true;
    }

    if (getCurrentBarCount() == (getNumBars()-1)){

        var nCountOfBars = getCurrentBarCount();

        var nLowestInd = lowest(nCountOfBars, xSourceBase, 0);

        if (fpScale == "L" && nLowestInd != null && nLowestInd <= 0){
            drawTextPixel( 10, 50, "A semilogarithmic scale is not supported for the negative values or 0.", Color.blue);
            return;
        }

        if (nLowestInd == null)
            return;

        var x1 = -(nCountOfBars - 1);
        var y1 = xSource.getValue(-(nCountOfBars - 1));
        var aFirstBar = [x1, y1];

        var x2 = 0;
        var y2 = xSource.getValue(0);
        var aLastBar = [x2, y2];

        if (y1 == null || y2 == null)
            return;

        var arrayPIPs = [];
        arrayPIPs.push(aFirstBar);
        arrayPIPs.push(aLastBar);

        while (arrayPIPs.length < fpLegsNo + 1){

            var arrayTemp = [];

            for (var i = 0; i < arrayPIPs.length - 1; i++){
                arrayTemp.push(calc_PIP(arrayPIPs[i], arrayPIPs[i+1], xSource))
            }

            var aMaxTempElement = arrayTemp.reduce(function(prevElemen, curElement){
                return prevElemen[0] >= curElement[0] ? prevElemen : curElement
            });

            var x = aMaxTempElement[1];
            var y = xSource.getValue(aMaxTempElement[1]);
            if (y == null)
                return;
            arrayPIPs.push([x, y]);

            arrayPIPs.sort(function (element1, element2){
                return element1[0] - element2[0];
            });
        }

        var tagID = 0;
        clearLines();

        for (var i = 0; i < arrayPIPs.length - 1; i++){
            x1 = arrayPIPs[i][0];
            y1 = arrayPIPs[i][1];

            x2 = arrayPIPs[i+1][0];
            y2 = arrayPIPs[i+1][1];

            if (fpScale == "L"){
                y2 = Math.exp(y2);
                y1 = Math.exp(y1);
            }

            drawLineRelative(x1, y1, x2, y2, PS_SOLID, 2, Color.red, tagID++);
        }
    }
}

function calc_Log(xSource){
    var nValue = xSource.getValue(0);

    if (nValue <= 0)
        return;

    return Math.log(nValue);
}

function calc_PIP(aFirstCoord, aSecondCoord, xSource){

    var nIndexOfFirst = aFirstCoord[0];
    var nIndexOfSecond = aSecondCoord[0];
    var nCountOfBars = Math.abs(nIndexOfFirst - nIndexOfSecond) + 1;

    var nPrevMaxDiff = 0;
    var nPrevMaxIndex  = 0;

    var aMaxValue = [];

    for (var i = 0; i < nCountOfBars; i++){

        var nIndicatorValue = xSource.getValue(nIndexOfFirst + i);
        if (nIndicatorValue == null)
            return;

        var nCrossPoint = (((i * (aSecondCoord[1] - aFirstCoord[1])) / (nCountOfBars - 1)) + aFirstCoord[1]);
        var nDiff = Math.abs(nCrossPoint - nIndicatorValue);

        aMaxValue = [];
        aMaxValue[0] = Math.max(nDiff, nPrevMaxDiff);
        aMaxValue[1] = aMaxValue[0] == nDiff ? nIndexOfFirst + i : nPrevMaxIndex;

        nPrevMaxDiff = aMaxValue[0];
        nPrevMaxIndex  = aMaxValue[1];
    }
    return aMaxValue;
}

function verify(){

    var b = false;
    if (getBuildNumber() < 779){

        drawTextAbsolute(5, 35, "This study requires version 8.0 or later.",
            Color.white, Color.blue, Text.RELATIVETOBOTTOM|Text.RELATIVETOLEFT|Text.BOLD|Text.LEFT,
            null, 13, "error");
        drawTextAbsolute(5, 20, "Click HERE to upgrade.@URL=https://www.esignal.com/download/default.asp",
            Color.white, Color.blue, Text.RELATIVETOBOTTOM|Text.RELATIVETOLEFT|Text.BOLD|Text.LEFT,
            null, 13, "upgrade");
        return b;
    }
    else
        b = true;

    return b;
}
zzTOPauto.efs:
/*********************************
Provided By:
    Interactive Data Corporation (Copyright В© 2015)
    All rights reserved. This sample eSignal Formula Script (EFS)
    is for educational purposes only. Interactive Data Corporation
    reserves the right to modify and overwrite this EFS file with
    each new release.

Description:
    Filtering Price Movement by Giorgos E. Siligardos

Formula Parameters:                     Default:
Indicator                               Close
Proximity                               20
Scale                                   A

Version:            1.00  03/11/2015

Notes:
    The related article is copyrighted material. If you are not a subscriber
    of Stocks & Commodities, please visit www.traders.com.

**********************************/

var fpArray = new Array();

function preMain(){

    setStudyTitle("zzTOPauto");
    setPriceStudy(true);
    setComputeOnClose(true);

    var x = 0;

    fpArray[x] = new FunctionParameter("fpIndicator", FunctionParameter.STRING);
    with(fpArray[x++]){
        setName("Indicator");
        addOption("Close");
        addOption("Open");
        addOption("High");
        addOption("Low");
        setDefault("Close");
    }

    fpArray[x] = new FunctionParameter("fpProximity", FunctionParameter.NUMBER);
    with(fpArray[x++]){
        setName("Proximity");
        setLowerLimit(0);
        setUpperLimit(100);
        setDefault(20);
    }

    fpArray[x] = new FunctionParameter("fpScale", FunctionParameter.STRING);
    with(fpArray[x++]){
        setName("Scale");
        addOption("A");
        addOption("L");
        setDefault("A");
    }
}

var bInit = false;
var bVersion = null;

var xSourceBase = null;
var xSource = null;

function main(fpIndicator, fpProximity, fpScale){

    if (!bInit){

        switch (fpIndicator){
            case "Close":
                xSourceBase = close();
                break;
            case "Open":
                xSourceBase = open();
                break;
            case "High":
                xSourceBase = high();
                break;
            case "Low":
                xSourceBase = low();
                break;
            default: return;
        }

        if (fpScale == "L")
            xSource = efsInternal("calc_Log", xSourceBase)
        else
            xSource = xSourceBase;

        bInit = true;
    }

    if (getCurrentBarCount() == (getNumBars()-1)){

        var nCountOfBars = getCurrentBarCount();

        var nLowestInd = lowest(nCountOfBars, xSourceBase, 0);

        if (fpScale == "L" && nLowestInd != null && nLowestInd <= 0){
            drawTextPixel( 10, 50, "A semilogarithmic scale is not supported for the negative values or 0.", Color.blue);
            return;
        }

        if (nLowestInd == null)
            return;

        var nHighest = highest(nCountOfBars, xSource, 0);
        var nLowest = lowest(nCountOfBars, xSource, 0);

        if (nHighest == null || nLowest == null)
            return;

        var nRange = nHighest - nLowest;

        var x1 = -(nCountOfBars - 1);
        var y1 = xSource.getValue(-(nCountOfBars - 1));
        var aFirstBar = [x1, y1];

        var x2 = 0;
        var y2 = xSource.getValue(0);
        var aLastBar = [x2, y2];

        if (y1 == null || y2 == null)
            return;

        var arrayPIPs = [];
        arrayPIPs.push(aFirstBar);
        arrayPIPs.push(aLastBar);

        do {
            var arrayTemp = [];

            for (var i = 0; i < arrayPIPs.length - 1; i++){
                arrayTemp.push(calc_PIP(arrayPIPs[i], arrayPIPs[i+1], xSource));
            }

            var aMaxTempElement = arrayTemp.reduce(function(prevElemen, curElement){
                return prevElemen[0] >= curElement[0] ? prevElemen : curElement
            });

            if (aMaxTempElement[0] < (nRange * fpProximity / 100))
                break;

            var x = aMaxTempElement[1];
            var y = xSource.getValue(aMaxTempElement[1]);
            if (y == null)
                return;

            arrayPIPs.push([x, y]);

            arrayPIPs.sort(function (element1, element2){
                return element1[0] - element2[0];
            });

        } while (aMaxTempElement[0] >= (nRange * fpProximity / 100));

        var tagID = 0;
        clearLines();

        for (var i = 0; i < arrayPIPs.length - 1; i++){
            x1 = arrayPIPs[i][0];
            y1 = arrayPIPs[i][1];

            x2 = arrayPIPs[i+1][0];
            y2 = arrayPIPs[i+1][1];

            if (fpScale == "L"){
                y2 = Math.exp(y2);
                y1 = Math.exp(y1);
            }

            drawLineRelative(x1, y1, x2, y2, PS_SOLID, 2, Color.red, tagID++);
        }
    }
}

function calc_Log(xSource){
    var nValue = xSource.getValue(0);

    if (nValue <= 0)
        return;

    return Math.log(nValue);
}

function calc_PIP(aFirstCoord, aSecondCoord, xSource){

    var nIndexOfFirst = aFirstCoord[0];
    var nIndexOfSecond = aSecondCoord[0];
    var nCountOfBars = Math.abs(nIndexOfFirst - nIndexOfSecond) + 1;

    var nPrevMaxDiff = 0;
    var nPrevMaxIndex  = 0;

    var aMaxValue = [];

    for (var i = 0; i < nCountOfBars; i++){

        var nIndicatorValue = xSource.getValue(nIndexOfFirst + i);
        if (nIndicatorValue == null)
            return;

        var nCrossPoint = (((i * (aSecondCoord[1] - aFirstCoord[1])) / (nCountOfBars - 1)) + aFirstCoord[1]);
        var nDiff = Math.abs(nCrossPoint - nIndicatorValue);

        aMaxValue = [];
        aMaxValue[0] = Math.max(nDiff, nPrevMaxDiff);
        aMaxValue[1] = aMaxValue[0] == nDiff ? nIndexOfFirst + i : nPrevMaxIndex;

        nPrevMaxDiff = aMaxValue[0];
        nPrevMaxIndex  = aMaxValue[1];
    }
    return aMaxValue;
}

function verify(){

    var b = false;
    if (getBuildNumber() < 779){

        drawTextAbsolute(5, 35, "This study requires version 8.0 or later.",
            Color.white, Color.blue, Text.RELATIVETOBOTTOM|Text.RELATIVETOLEFT|Text.BOLD|Text.LEFT,
            null, 13, "error");
        drawTextAbsolute(5, 20, "Click HERE to upgrade.@URL=https://www.esignal.com/download/default.asp",
            Color.white, Color.blue, Text.RELATIVETOBOTTOM|Text.RELATIVETOLEFT|Text.BOLD|Text.LEFT,
            null, 13, "upgrade");
        return b;
    }
    else
        b = true;

    return b;
}
—Eric Lippert
eSignal, an Interactive Data company
800 779-6555, www.eSignal.com
BACK TO LIST

THINKORSWIM: MAY 2015
In “Filtering Price Movement” in this issue, author Giorgos Siligardos
takes a fresh look at the old technical analysis tool zigzag. He discusses
the limitations of a traditional zigzag indicator and introduces concepts to
strengthen it.
We have recreated his zzTOP study using our proprietary scripting language thinkscript.
We have made the loading process extremely easy: Simply click on the link https://tos.mx/npjeNL and
choose “save script to thinkorswim,” then choose to rename your
study to “zzTOP.” You can adjust the parameters of these within
the edit studies window to fine-tune your variables.
In the example in Figure 3, we have added a 10-leg strategy version of the
zzTOP on a thinkorswim chart of Ball Corp. (BLL). Refer to Siligardos’ article
for a detailed description of the strategy.
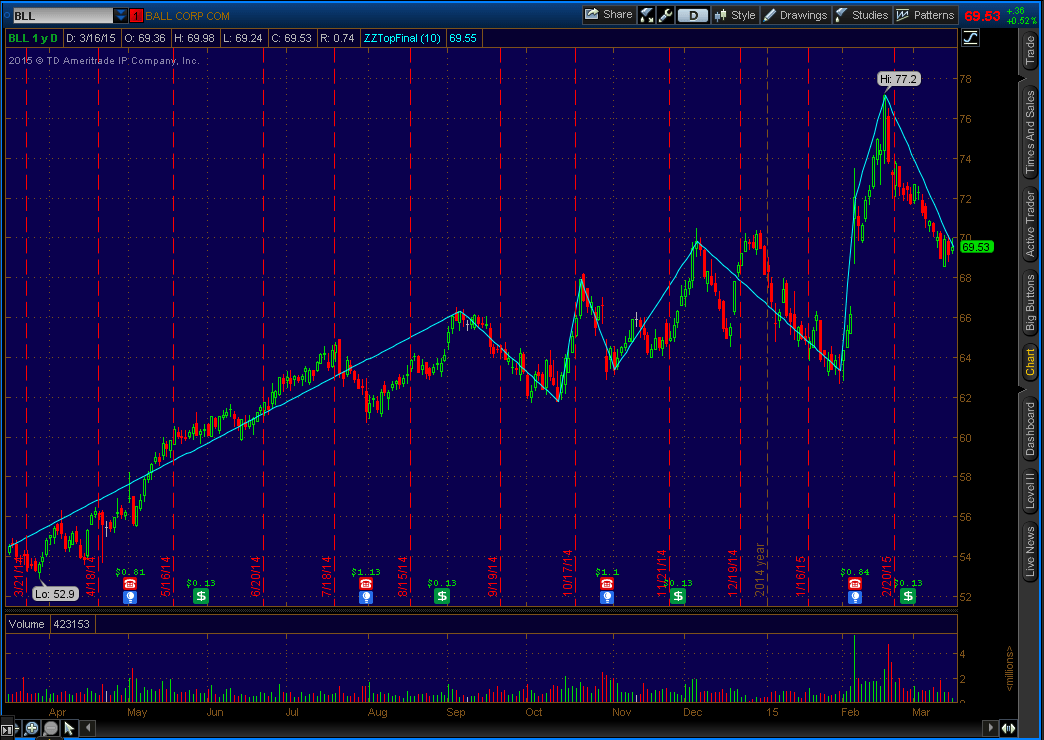
FIGURE 3: THINKORSWIM. This example chart shows a 10-leg
version of the zzTOP study on a daily chart of Ball Corp. (BLL).
—thinkorswim
A division of TD Ameritrade, Inc.
www.thinkorswim.com
BACK TO LIST

WEALTH-LAB: MAY 2015
We’ve implemented the perceptually important points (PIPs)
method introduced by Giorgos Siligardos in his article in this issue, “Filtering
Price Movement,” in a script study. The script uses a recursive call
to find the PIP having the maximum absolute value of the vertical distance
from the line connecting two PIPs previously found. The price movement plot
is based on a user-specified percentage.
As suggested by the article’s author, for a DataSeries plotted in the arithmetic scale,
the minimum vertical distance required to find a PIP is the percentage of the
DataSeries’ entire range, whereas a fixed vertical distance in a logarithmic plot
is inherently represented equally by the same percentage. For example, on a
log chart, the distance between 1 and 10 is the same as that between 10 and
100 (or for any other 1,000% price change).
Finally, note that due to the manner in which the indicator is constructed,
the zzTOP indicator must not be used for backtesting, but rather could
be useful for digitally scanning numerous charts for patterns.
The Wealth-Lab code listing is shown below.
using System;
using System.Collections.Generic;
using System.Text;
using System.Drawing;
using WealthLab;
using WealthLab.Indicators;
using Community.Components;

namespace WealthLab.Strategies
{
   internal struct PipInterval
   {
      public int X1;
      public int X2;
   }

   public class zzTOPAutoStudy : WealthScript
   {
      StrategyParameter _pct;
      StrategyParameter _thickness;
      List<int> _pipList;      // list of PIP bar numbers

      public zzTOPAutoStudy()
      {
         _pct = CreateParameter("PIP Percent", 20, 2, 50, 1);
         _thickness = CreateParameter("Line Width", 2, 1, 3, 1);
      }

      int getPipBar(DataSeries ds, PipInterval pi, double minMove, bool useLog)
      {
         int pip = 0;
         double maxDiff = 0;
         double delta, y;

         for(int bar = pi.X1; bar <= pi.X2; bar++)
         {
            if (useLog)
            {
               y = LineExtendYLog( pi.X1, ds[pi.X1], pi.X2, ds[pi.X2], bar );
               delta = Math.Abs(Math.Log(ds[bar] / y));
            }
            else
            {
               y = LineExtendY( pi.X1, ds[pi.X1], pi.X2, ds[pi.X2], bar );
               delta = Math.Abs(ds[bar] - y);
            }

            if( delta > maxDiff )
            {
               maxDiff = delta;
               pip = bar;
            }
         }

         if (maxDiff < minMove)
            pip = -1;   // invalid; no PIP in specified PipInterval

         if (pip > 0)
            _pipList.Add(pip);

         return pip;
      }

      /* Find the new PIP for each PipInterval in the List and return the new PipIntervals */
      internal List<PipInterval> zzTopAuto(List<PipInterval> piList, DataSeries ds, double minmove, bool useLog)
      {
         List<PipInterval> nextList = new List<PipInterval>();

         foreach (PipInterval pi in piList)
         {
            int bar = getPipBar(ds, pi, minmove, useLog);

            if (bar == -1)
               continue;
            else
            {
               PipInterval newinvl = new PipInterval();
               newinvl.X1 = pi.X1;
               newinvl.X2 = bar;
               nextList.Add(newinvl);

               PipInterval newinvl2 = new PipInterval();
               newinvl2.X1 = bar;
               newinvl2.X2 = pi.X2;
               nextList.Add(newinvl2);
            }
         }

         if (nextList.Count != 0)
            zzTopAuto(nextList, ds, minmove, useLog);

         return nextList;
      }

      void ZZTOP(DataSeries ds, ChartPane cp, double minPercent)
      {
         // Minimum vertical move for the arithmetic and log cases
         double minV = 0;
         if (cp.LogScale)
            minV = Math.Log(1 + minPercent/100d);
         else
         {
            int bc = Bars.Count;
            minV = minPercent / 100d * (Highest.Value(bc-1, ds, bc) - Lowest.Value(bc-1, ds, bc));
         }

         // Initialize _pipList with the first and last bar numbers
         int nbars = Bars.Count - 1;
         _pipList = new List<int>();
         _pipList.Add(0);
         _pipList.Add(nbars);

         // Initialize the first list to pass to zzTopAuto
         PipInterval interval = new PipInterval();
         interval.X1 = 0;
         interval.X2 = nbars;
         List<PipInterval> aList = new List<PipInterval>();
         aList.Add(interval);

         // Let the recursion begin!
         zzTopAuto(aList, ds, minV, cp.LogScale);

         // Sort the result to plot lines between the PIPs
         _pipList.Sort();

         int lastpip = 0;
         foreach (int pip in _pipList)
         {
            if (pip == 0) continue;
            DrawLine(cp, lastpip, ds[lastpip], pip, ds[pip], Color.Blue, LineStyle.Solid, _thickness.ValueInt);
            lastpip = pip;
         }

         int segments = _pipList.Count - 1;
         DrawLabel(cp, "Log Scale: " + cp.LogScale.ToString());
         DrawLabel(cp, "Segment Count: " + segments.ToString());
         DrawLabel(cp, "PIP: " + minPercent + "%");
         //DrawLabel(cp, "Press Go! after switch between Log and Arithmetic scales!", Color.Red);
      }


      protected override void Execute()
      {
         ZZTOP(Close, PricePane, _pct.Value);

         DataSeries rsi = RSI.Series(Close, 14);
         ChartPane rsiPane = CreatePane(40, true, true);
         PlotSeries(rsiPane, rsi, Color.Black, LineStyle.Solid, 1);
         ZZTOP(rsi, rsiPane, _pct.Value);
      }
   }
}
See Figure 4 for an example chart.
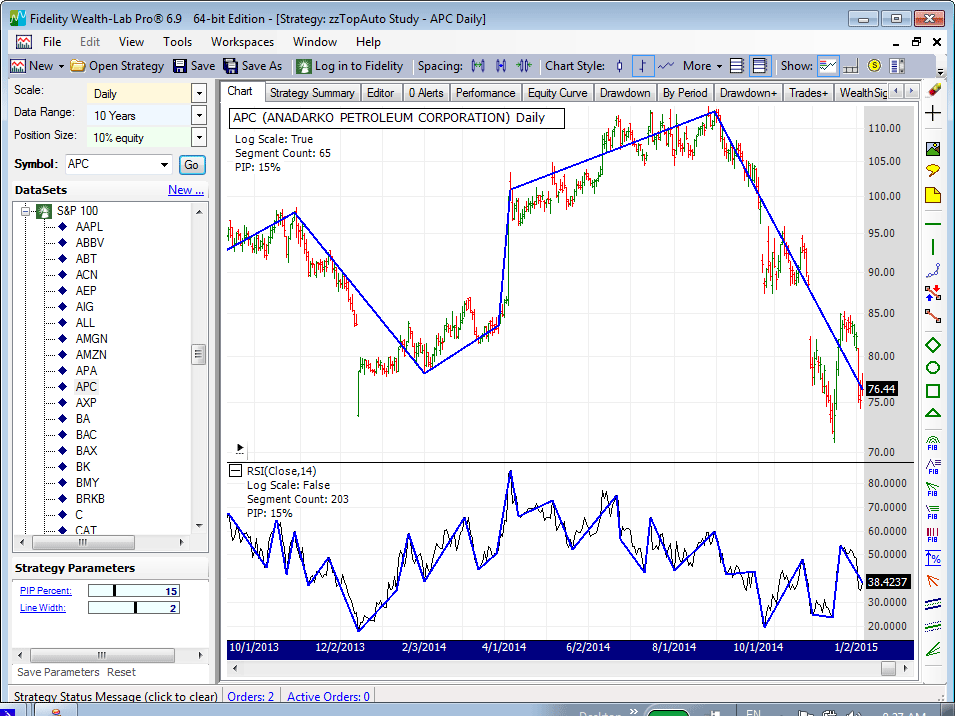
Figure 4: WEALTH-LAB. Wealth-Lab’s zzTOPauto routine
automatically adjusts for the chart pane’s log or arithmetic scale.
—Robert Sucher
Wealth-Lab, www.wealth-lab.com
BACK TO LIST

AMIBROKER: MAY 2015
In “Filtering Price Movement” in this issue, author Giorgos Siligardos
presents a new zigzag-style indicator for visual identification of price patterns,
which he calls zzTOP. Using AmiBroker’s formula language (AFL), it’s
possible to write code directly in AmiBroker in a short and concise way without
having to use an external DLL and/or external languages. The code listing follows.
LISTING 1.

SetBarsRequired( sbrAll, 0 );

function FindMiddlePIP( data, x0, x1, curdist )
{
  bi = BarIndex();

  y0 = data[ x0 ];
  y1 = data[ x1 ];

  line = y0 + ( y1 - y0 ) * ( bi - x0 ) / ( x1 - x0 );

  distance = abs(  data - line );
  maxbars = HHVBars( distance, x1 - x0 );
  pipbar = Nz( x1 - maxbars[ x1 ], -1 );

  if ( pipbar != -1 )
     VarSet( curdist, distance[ pipbar ] );

  return pipbar;
}

LogMode = ParamToggle( "Mode", "Linear|Logarithmic", 0 );
MaxLegs = Param( "MaxLegs", 20, 4, 35 );

data = Close;
// one leg first - from start to end
legs = 1;
pips = 0;
pips[ 0 ] = 1;
pips[ BarCount - 1 ] = 1;

if ( LogMode ) data = log( Data );

for ( ; legs < maxlegs; legs++ )
{
 x0 = 0;
 x1 = -1;
 oldpip = -1;
 maxdist = 0;

 for ( i = 0; i < BarCount; i++ )
 {
  if ( pips[ i ] )
  {
    x1 = i;

    if ( x1 > x0 )
    {
      curdist = 0;
      newpip = FindMiddlePIP( data, x0, x1, "curdist" );

      if ( newpip != -1 AND curdist > maxdist  )
      {
          maxdist = curdist;

          if ( oldpip != -1 )
              pips[ oldpip ] = 0; // remove smaller one

          pips[ newpip ] = 1;
          oldpip = newpip;
      }

      x0 = x1; // next leg
      x1 = -1; //
   }
  }
 }
}

// draw lines connecting pip points
x0 = 0;
x1 = -1;
zzline = Null;
for ( i = 0; i < BarCount; i++ )
{
     if ( pips[ i ] )
     {
         x1 = i;
         line = LineArray( x0, data[ x0 ], x1, data[ x1 ] );
         zzline = IIf( NOT IsNull( line ), line, zzline );
         x0 = x1;
     }
}

if ( LogMode )
     zzline = exp( zzline );

Plot( zzline, "zzTop", colorRed, styleThick );
Plot( C, "Price", colorDefault );
An example of the zzTOP indicator as implemented on an AmiBroker chart of
ASML Holdings is shown in Figure 5.
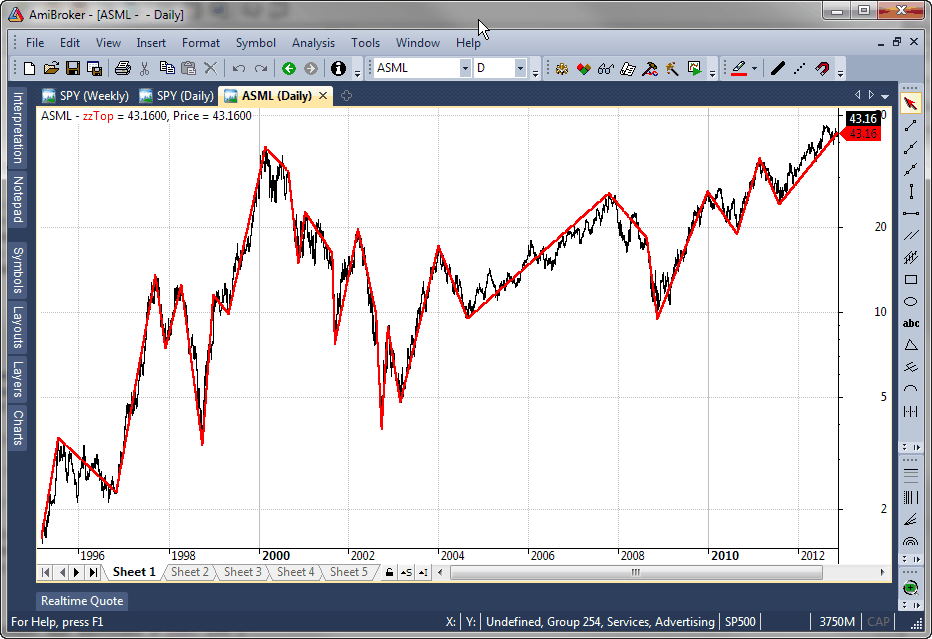
FIGURE 5: AMIBROKER. Here is a sample chart showing the
zzTop indicator applied on ASML daily data, replicating the chart from Siligardos’ article
in this issue.
—Tomasz Janeczko, AmiBroker.com
www.amibroker.com
BACK TO LIST

NEUROSHELL TRADER: MAY 2015
The PIPs (perceptually important points) method described by Giorgos
Siligardos in his article in this issue, “Filtering Price Movement,” can
be easily implemented in NeuroShell Trader using NeuroShell Trader’s
ability to call external dynamic linked libraries (DLLs). Dynamic linked libraries
can be written in C, C++, Power Basic, or Delphi.
After writing the indicator code in your preferred compiler and creating a
DLL, you can insert the resulting indicators as follows:
- Select new indicator from the insert menu
- Choose the External Program & Library Calls category
- Select the appropriate External DLL Call indicator
- Set up the parameters to match your DLL
- Select the finished button.
As noted by Siligardos in his article, these indicators “change their
historical values when new data comes in” and thus should not be
used for backtesting or automated trading, and instead should only be used “as
a digital substitution for your eyes” when scanning charts.
Users of NeuroShell Trader can go to the STOCKS & COMMODITIES section
of the NeuroShell Trader free technical support website to download a copy
of this or any previous Traders’ Tips.
A sample chart is shown in Figure 6.
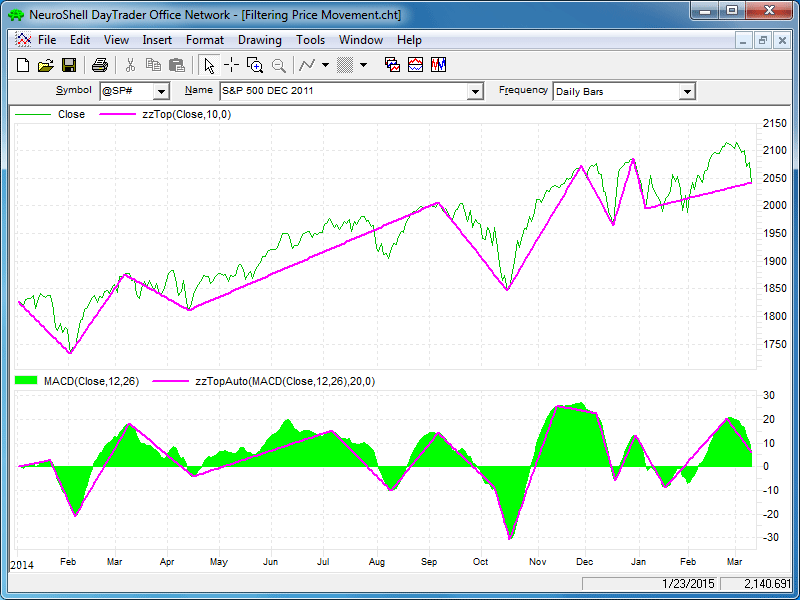
FIGURE 6: NEUROSHELL TRADER. This NeuroShell Trader chart
shows the zzTOP indicator applied to the closing price and the zzTOPauto
indicator applied to an MACD indicator.
—Marge Sherald, Ward Systems Group, Inc.
301 662-7950, sales@wardsystems.com
www.neuroshell.com
BACK TO LIST
MICROSOFT EXCEL: MAY 2015
In “Filtering Price Movement” in this issue, author Giorgos Siligardos
shows us a tool that lets us determine the level of price swing detail that
we wish to pay attention to.
Much like zooming in on a map from satellite level down to neighborhood level,
the closer we get, the more fine detail we can see. What he calls perceptually
important points (PIPs) can do that for us. When we ask for only a few
PIPs, we are highlighting the large (high-level) moves and ignoring the small
ones. As we ask for more points, we are, in effect, zooming in to highlight
the ever-finer details.
The zigzag indicator I will use here was excerpted from the spreadsheet I
built for my June 2013 Traders’ Tips submission (which readers can find
in the Traders’ Tips archive at Traders.com). I am using that indicator
as a starting point since Siligardos’ article in this issue compares
the behaviors of his zzTOP indicators to the traditional zigzag.
My implemention of the zzTOP indicator in Excel has three user controls (see
Figure 7):
- Type in the number of legs you want to see
- Click on the checkbox to toggle between arithmetic or logarithmic calculation
modes
- Click one or more times on the gray button to select the pricing column
to use in calculation of the indicator. This “tumbler” button
includes a hybrid choice of Hi:Lo Combo.
In the Hi:Lo Combo mode, both the high and low of a bar are tested
when selecting candidate points. This behavior is similar in concept to the
standard zigzag and can produce a very choppy zzTOP indicator.
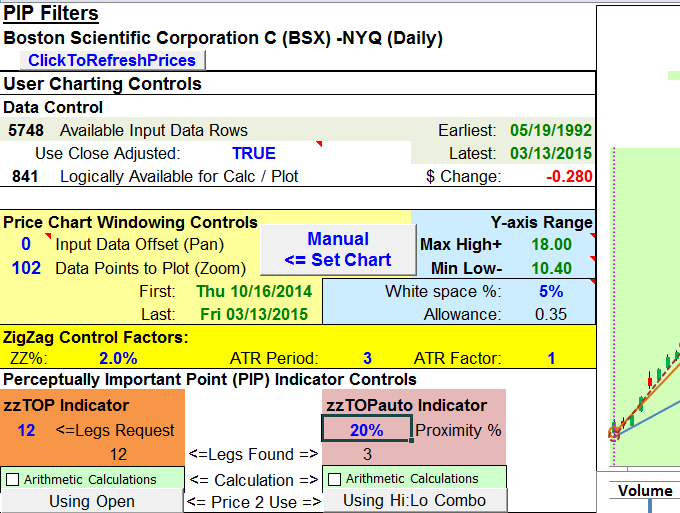
FIGURE 7: EXCEL, User Controls. Here you see the controls
implemented in the spreadsheet for the zigzag, zzTOP, and zzTOPauto indicators.
The zzTOPauto version of the indicator swaps the specific number of legs for
a proximity test, but otherwise, the controls behave the same way.
To be able to see the effects of changing the starting and ending points for
the zzTOP indicators, I have provided the ability to specify the interval of
interest via slider controls (Figure 8). These can be used to step the left
and right edges of the computation interval in or out and immediately see what
happens to the indicator.
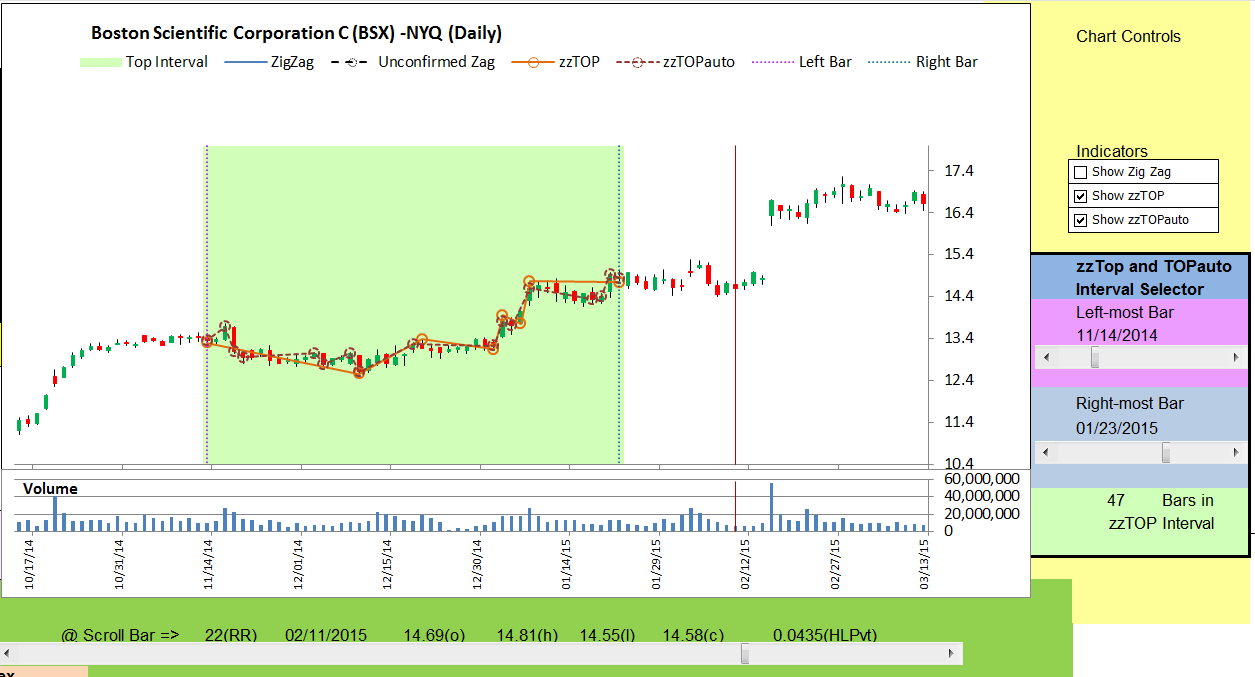
FIGURE 8: EXCEL, zzTOP Interval Controls. Slider controls
allow you to immediately see the effects of changing the starting and ending
points for the zzTOP indicator.
Use the checkboxes to select the indicator or indicators you wish to display
as a way to control chart clutter.
In Figure 9, the interval is the full chart and we can see how the zzTOP indicators
stack up against a standard zigzag over the same interval.
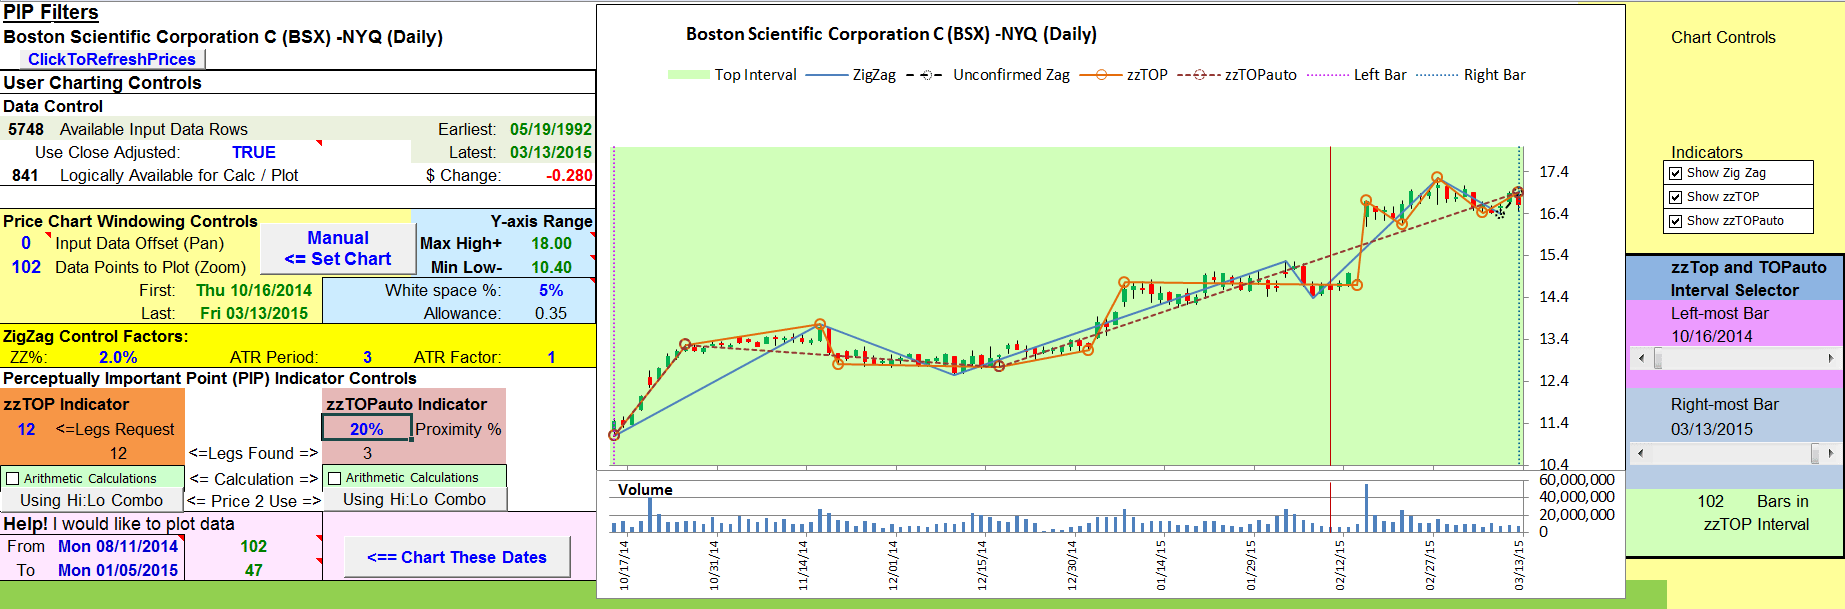
FIGURE 9: EXCEL, ZigZag and All. Here, the interval is
the full chart and we can see how the zzTOP indicators stack up against a
standard zigzag over the same interval.
ADDITIONAL
USES FOR PIPS (PERCEPTUALLY IMPORTANT POINTS)
In 2010, while Google and I were looking for discussions of pattern matching
in time series data, I came across an interesting master’s thesis written
in 2008 titled “Novel Pattern Matching Methods For Stock Data Analysis” by
Zhang Zhe, City University of Hong Kong. It’s a fairly accessible read
and proposes a three-step process for locating and identifying patterns such
as head & shoulders in a time series stream. Interested readers can access
a free PDF of the paper at https://lbms03.cityu.edu.hk/theses/abt/mphil-is-b23405983a.pdf.
The spreadsheet file for this Traders’ Tip can be downloaded here.
To successfully download it, follow these steps:
- Right-click on the Excel
file link, then
- Select “save as” (or “save target as”) to place
a copy of the spreadsheet file on your hard drive.
—Ron McAllister
Excel and VBA programmer
rpmac_xltt@sprynet.com
BACK TO LIST
Originally published in the May 2015 issue of
Technical Analysis of STOCKS & COMMODITIES magazine.
All rights reserved. © Copyright 2015, Technical Analysis, Inc.