TRADERS’ TIPS
August 2009
Here is this month’s selection of Traders’ Tips, contributed by various developers of technical analysis software to help readers more easily implement some of the strategies presented in this and other issues.
Other code appearing in articles in this issue is posted in the Subscriber Area of our website at https://technical.traders.com/sub/sublogin.asp. Login requires your last name and subscription number (from mailing label). Once logged in, scroll down to beneath the “Optimized trading systems” area until you see “Code from articles.” From there, code can be copied and pasted into the appropriate technical analysis program so that no retyping of code is required for subscribers.
You can copy these formulas and programs for easy use in your spreadsheet or analysis software. Simply “select” the desired text by highlighting as you would in any word processing program, then use your standard key command for copy or choose “copy” from the browser menu. The copied text can then be “pasted” into any open spreadsheet or other software by selecting an insertion point and executing a paste command. By toggling back and forth between an application window and the open web page, data can be transferred with ease.
This month’s tips include formulas and programs for:
- TRADESTATION: COMBINING DMI AND A MOVING AVERAGE
- eSIGNAL: DMI AND MOVING AVERAGE SYSTEM
- METASTOCK: DMI & MOVING AVERAGE SYSTEM
- WEALTH-LAB: DMI & MOVING AVERAGE STRATEGY
- AMIBROKER: DMI & MOVING AVERAGE SYSTEM
- NEUROSHELL TRADER: DMI & MOVING AVERAGE SYSTEM
- NeoTicker: DMI & MOVING AVERAGE SYSTEM
- AIQ: DMI & MOVING AVERAGE SYSTEM
- TRADERSSTUDIO: DMI & MOVING AVERAGE SYSTEM
- STRATASEARCH: DMI & MOVING AVERAGE SYSTEM
- TRADECISION: DMI & MOVING AVERAGE SYSTEM
- NINJATRADER: DMI & MOVING AVERAGE SYSTEM
- WAVE59: DMI & MOVING AVERAGE SYSTEM
- VT TRADER: DMI & MOVING AVERAGE SYSTEM
- TRADE IDEAS: 200-DAY MA STOCK-TRADING STRATEGY
- EASYLANGUAGE: COMBINING DMI AND MOVING AVERAGE FOR A EUR/USD TRADING SYSTEM
![]() TRADESTATION: COMBINING DMI AND A MOVING AVERAGE
TRADESTATION: COMBINING DMI AND A MOVING AVERAGE
Rombout Kerstens’ article in this issue, “Combining Dmi And Moving Average For A Eur/Usd Trading System,” describes a technique for long entry and exit that uses both J. Welles Wilder’s Dmi (directional movement indicator) and a moving average.
Kerstens’ article already includes strategy code in EasyLanguage in the sidebar. However, to provide signal displays on a wide group of stocks, we have coded the algorithm as an indicator that can be applied to a RadarScreen window.
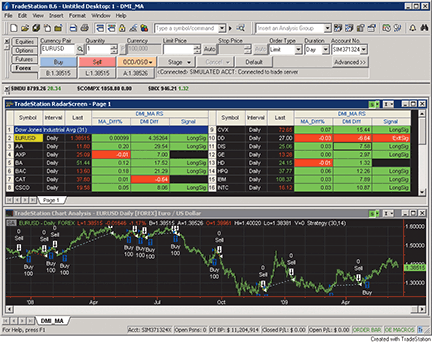
Figure 1: TRADESTATION, DMI & MOVING AVERAGE SYSTEM. In this sample TradeStation chart, Kerstens’ DMI_MA strategy is displayed on an EUR/USD chart (lower frame). A RadarScreen display of the DMI_MA system signals is shown in the upper frame.
To download the EasyLanguage code for this study, go to the TradeStation and EasyLanguage Support Forum (https://www.tradestation.com/Discussions/forum.aspx?Forum_ID=213) and search for the file “Dmi_MA.eld.”
This article is for informational purposes. No type of trading or investment recommendation, advice or strategy is being made, given or in any manner provided by TradeStation Securities or its affiliates.
Strategy:  DMI_MA
inputs:
	MALength( 30 ),
	DMILength( 14 ) ;

variables:
	vDMIMinus( 0 ),
	vDMIPlus( 0 ),
	MA( 0 ),
	DMILong( false ),
	DMIShort( false ),
	MALong( false ),
	MAShort( false ) ;

vDMIMinus = DMIMinus( DMILength ) ;
vDMIPlus = DMIPlus( DMILength ) ;
MA = Average( Close, MALength ) ;

if CurrentBar > 1 then
	begin

	if vDMIPlus crosses over vDMIMinus then
		begin
		DMILong = true ;
		DMIShort = false ;
		end
	else if vDMIPlus crosses under vDMIMinus then
		begin
		DMILong = false ;
		DMIShort = true ;
		end ;

	if Close crosses over MA then
		begin
		MALong = true ;
		MAShort = false ;
		end
	else if close crosses under MA then
		begin
		MALong = false ;
		MAShort = true ;
		end ;

	if DMILong and MALong then
		Buy this bar Close ;

	if DMIShort and MAShort then
		Sell this bar on Close ;

	end ;


Indicator:  DMI_MA RS
inputs:
	MALength( 30 ),
	DMILength( 14 ) ;

variables:
	vDMIMinus( 0 ),
	vDMIPlus( 0 ),
	MA( 0 ),
	DMILong( false ),
	DMIShort( false ),
	MALong( false ),
	MAShort( false ),
	MADiffPct( 0 ),
	DMIDiff( 0 ) ;

vDMIMinus = DMIMinus( DMILength ) ;
vDMIPlus = DMIPlus( DMILength ) ;
MA = Average( Close, MALength ) ;

if CurrentBar > 1 then
	begin

	if vDMIPlus crosses over vDMIMinus then
		begin
		DMILong = true ;
		DMIShort = false ;
		end
	else if vDMIPlus crosses under vDMIMinus then
		begin
		DMILong = false ;
		DMIShort = true ;
		end ;

	if Close crosses over MA then
		begin
		MALong = true ;
		MAShort = false ;
		end
	else if close crosses under MA then
		begin
		MALong = false ;
		MAShort = true ;
		end ;

	if MA <> 0 then
		MADiffPct = ( Close - MA ) / MA ;
	DMIDiff = vDMIPlus - vDMIMinus ;

	Plot1( MADiffPct, “MADiff%” ) ;
	Plot2( DMIDiff, “DMIDiff” ) ;

	if MALong then
		begin
		SetPlotBGColor( 1, Green ) ;
		SetPlotColor( 1, Black ) ;
		end
	else
		begin
		SetPlotBGColor( 1, Red ) ;
		SetPlotColor( 1, White ) ;
		end ;

	if DMILong then
		begin
		SetPlotBGColor( 2, Green ) ;
		SetPlotColor( 2, Black ) ;
		end
	else
		begin
		SetPlotBGColor( 2, Red ) ;
		SetPlotColor( 2, White ) ;
		end ;

	if DMILong and MALong then
		begin
		Plot3( “LongSig”, “Signal” ) ;
		SetPlotBGColor( 3, Green ) ;
		SetPlotColor( 3, Black ) ;
		end ;

	if DMIShort and MAShort then
		begin
		Plot3( “ExitSig” , “Signal” ) ;
		SetPlotBGColor( 3, Red ) ;
		SetPlotColor( 3, White ) ;
		end ;
	end ;
![]() eSIGNAL: DMI AND MOVING AVERAGE SYSTEM
eSIGNAL: DMI AND MOVING AVERAGE SYSTEM
For this month&rsquos Traders’ Tip, we&rsquove provided the formula, “MAandDMIStrategy.efs,” based on the formula code from Rombout Kerstens’ article in this issue, “Combining Dmi And Moving Average For A Eur/Usd Trading System.”
This formula plots the Pdi (positive directional index) and Ndi (negative directional index) with labels for the signals to enter and exit a long position (Figure 2). The formula contains parameters that may be configured through the Edit Studies option to change the moving average (MA) and Dmi periods. The formula is also compatible for backtesting using the Strategy Analyzer.
/*********************************
Provided By:
    eSignal (Copyright c eSignal), a division of Interactive Data
    Corporation. 2009. All rights reserved. This sample eSignal
    Formula Script (EFS) is for educational purposes only and may be
    modified and saved under a new file name.  eSignal is not responsible
    for the functionality once modified.  eSignal reserves the right
    to modify and overwrite this EFS file with each new release.

Description:
    Combining DMI And Moving Average For A EUR/USD Trading System, by Rombout Kerstens

Version:            1.0  06/08/2009

Formula Parameters:                     Default:
    MA Length                           30
    DMI Length                          14

Notes:
    The related article is copyrighted material. If you are not a subscriber
    of Stocks & Commodities, please visit www.traders.com.

**********************************/

var fpArray = new Array();
var bInit = false;
var bVersion = null;

function preMain() {
    setPriceStudy(false);
    setShowCursorLabel(true);
    setShowTitleParameters(false);
    setStudyTitle("MA and MDI Strategy");
    setColorPriceBars(true);
    setPlotType(PLOTTYPE_LINE);
    setDefaultBarThickness(2, 0);
    setDefaultBarFgColor(Color.green, 0);
    setCursorLabelName("DMI Plus", 0);
    setPlotType(PLOTTYPE_LINE);
    setDefaultBarThickness(2, 1);
    setDefaultBarFgColor(Color.red, 1);
    setCursorLabelName("DMI Minus", 1);
    askForInput();
    var x=0;
    fpArray[x] = new FunctionParameter("Length_MA", FunctionParameter.NUMBER);
	with(fpArray[x++]){
        setName("MA Length");
        setLowerLimit(1);
        setDefault(30);
    }
    fpArray[x] = new FunctionParameter("Length_DMI", FunctionParameter.NUMBER);
	with(fpArray[x++]){
	    setName("DMI Length");
        setLowerLimit(1);
        setDefault(14);
    }
}

var xPDI = null;
var xNDI = null;
var xMA = null;
var xClose = null;

function main(Length_MA, Length_DMI) {
var nBarState = getBarState();
var bMDILong = false;
var bMDIShort = false;
var bMALong = false;
var bMAShort = false;
var nPDI = 0;
var nNDI = 0;
var nMA = 0;
var nPDI_1 = 0;
var nNDI_1 = 0;
var nMA_1 = 0;

    if (bVersion == null) bVersion = verify();
    if (bVersion == false) return;
    if (getCurrentBarIndex() == 0) return;
    setPriceBarColor(Color.black);
    if (nBarState == BARSTATE_ALLBARS) {
        if (Length_MA == null) Length_MA = 30;
        if (Length_DMI == null) Length_DMI = 14;
    }
    if (bInit == false) {
        xMA = sma(Length_MA);
        xPDI = pdi(Length_DMI, 1);
        xNDI = ndi(Length_DMI, 1);
        xClose = close();
        bInit = true;
    }
    nPDI = xPDI.getValue(0);
    nNDI = xNDI.getValue(0);
    nMA = xMA.getValue(0);
    nPDI_1 = xPDI.getValue(-1);
    nNDI_1 = xNDI.getValue(-1);
    nMA_1 = xMA.getValue(-1);
    if (nMA_1 == null || nPDI_1 == null) return;
    if (nPDI > nNDI && nPDI_1 < nNDI_1) {
        bMDILong = true;
        bMDIShort = false;
    }
    if (nPDI < nNDI && nPDI_1 > nNDI_1) {
        bMDILong = false;
        bMDIShort = true;
    }
    if (xClose.getValue(0) > nMA && xClose.getValue(-1) < nMA_1) {
        bMALong = true;
        bMAShort = false;
    }
    if (xClose.getValue(0) < nMA && xClose.getValue(-1) > nMA_1) {
        bMALong = false;
        bMAShort = true;
    }
    if (bMDILong && bMALong && !Strategy.isLong()) {
        drawTextRelative(0, TopRow1, " LONG", Color.white, Color.green, Text.PRESET|Text.CENTER|Text.FRAME, "Arial Black", 10, "b"+(getCurrentBarCount()), -5);
        Strategy.doLong("Enyry Long", Strategy.CLOSE, Strategy.THISBAR);
    }
    if (bMDIShort && bMAShort && Strategy.isLong()) {
        drawTextRelative(0, BottomRow1,  " EXIT", Color.white, Color.red, Text.PRESET|Text.CENTER|Text.FRAME, "Arial Black", 10, "b"+(getCurrentBarCount()), -5);
        Strategy.doSell("Exit Long", Strategy.CLOSE, Strategy.THISBAR);
    }
	if(Strategy.isLong())
        setBarBgColor(Color.lime, 0, 0, 100);
    return new Array(nPDI, nNDI);
}

function verify() {
    var b = false;
    if (getBuildNumber() < 779) {
        drawTextAbsolute(5, 35, "This study requires version 8.0 or later.",
            Color.white, Color.blue, Text.RELATIVETOBOTTOM|Text.RELATIVETOLEFT|Text.BOLD|Text.LEFT,
            null, 13, "error");
        drawTextAbsolute(5, 20, "Click HERE to upgrade.@URL=https://www.esignal.com/download/default.asp",
            Color.white, Color.blue, Text.RELATIVETOBOTTOM|Text.RELATIVETOLEFT|Text.BOLD|Text.LEFT,
            null, 13, "upgrade");
        return b;
    } else {
        b = true;
    }
    return b;
}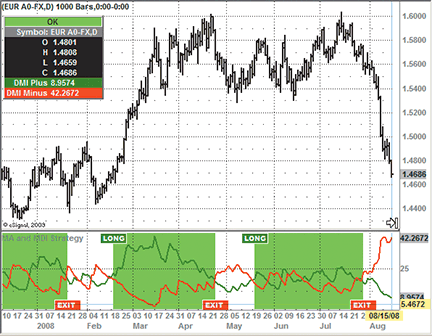
Figure 2: eSIGNAL, DMI & MA SYSTEM. The formula plots the PDI (positive directional index) and NDI (negative directional index) with signals to enter and exit a long position.
To discuss this study or download complete copies of the formula code, please visit the Efs Library Discussion Board forum under the Forums link at www.esignalcentral.com or visit our Efs KnowledgeBase at www.esignalcentral.com/support/kb/efs/. The eSignal formula scripts (Efs) are also available for copying and pasting from the Stocks & Commodities website at Traders.com.
![]() METASTOCK: DMI & MOVING AVERAGE SYSTEM
METASTOCK: DMI & MOVING AVERAGE SYSTEM
Rombout Kerstens’ article in this issue, “Combining Dmi And Moving Average For A Eur/Usd Trading System,” describes buy and sell signals combining these two indicators. The MetaStock formulas and instructions for adding these to MetaStock are as follows:
To create a system test:
- Select Tools > the Enhanced System Tester.
- Click New
- Enter a name.
- Select the Buy Order tab and enter the
following formula.
c1:=PDI(14)>MDI(14);
c2:=C>Mov(C,30,S);
Cross(c1 AND c2,0.5)
- Select the Sell Order tab and enter the
following formula.
c1:=MDI(14)>PDI(14);
c2:=C<Mov(C,30,S);
Cross(c1 AND c2,0.5)
- Select the Sell Short Order tab and enter the following formula.
c1:=MDI(14)>PDI(14);
c2:=C<Mov(C,30,S);
Cross(c1 AND c2,0.5)
- Select the Buy to Cover Order tab and enter the following formula.
c1:=PDI(14)>MDI(14);
c2:=C>Mov(C,30,S);
Cross(c1 AND c2,0.5)
- Click OK to close the system editor.
The expert advisor can be created with the following steps:
- Select Tools > Expert Advisor.
- Click New to open the Expert Editor.
- Type in a name for your expert
- Click the Symbols tab.
- Click New to create a new symbol.
- Type in the name “Buy”.
- Click in the condition window and enter the buy order formula.
- Select the Graphics tab
- Set the symbol to the Up Arrow
- Set the color to Green
- In the Label window, type “Buy”
- Set the symbol position to “Below Price Plot”
- Set the label position to “Below Symbol”
- Click OK
- Click New to create a new symbol.
- Type in the name “Sell”.
- Click in the condition window and enter the sell order formula.
- Select the Graphics tab
- Set the symbol to the Down Arrow
- Set the color to Red
- In the Label window, type “Sell”
- Set the symbol position to “Above Price Plot”
- Set the label position to “Above Symbol”
- Click OK
- Click OK to close the Expert Editor.
![]() WEALTH-LAB: DMI & MOVING AVERAGE STRATEGY
WEALTH-LAB: DMI & MOVING AVERAGE STRATEGY
This Traders’ Tip is based on “Combining Dmi And Moving Average For A Eur/Usd Trading System” by Rombout Kerstens in this issue.
Code for Wealth-Lab version 5 in C# for combining the directional movement and moving average indicators is shown here with the minor modification of making this a stop-and-reverse strategy. As the periods chosen by the author seem quite arbitrary, it seems possible to find a sweeter spot for the strategy by optimizing. While adding complexity, it also may pay off investigating the use of a loose trailing stop in order to prevent whipsaws in the middle of a strong trend (possibly detected using Adx), like the one that occurred in September 2008, which you can see in Figure 3.
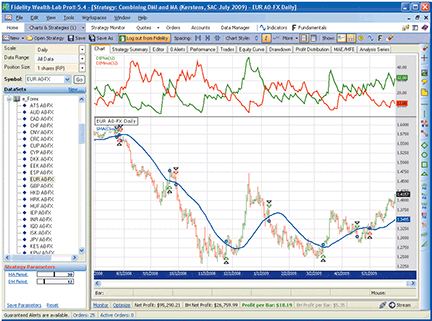
Figure 3: WEALTH-LAB, DMI & MOVING AVERAGE. DMI and moving average crossovers often indicate the same trend on nearly the same bar.
WealthScript Code (C#):

/* Place the code within the namespace WealthLab.Strategies block */
public class CombinedDMI_MA : WealthScript
{
   StrategyParameter maPeriod;
   StrategyParameter dmPeriod;

   public CombinedDMI_MA()
   {
      maPeriod = CreateParameter("MA Period", 30, 10, 55, 5);
      dmPeriod = CreateParameter("DM Period", 14, 10, 21, 1);
   }

   protected override void Execute()
   {
      HideVolume();
      int maPer = maPeriod.ValueInt;
      int dmPer = dmPeriod.ValueInt;
      bool dmiLong = false;
      bool dmiShort = false;
      bool maLong = false;
      bool maShort = false;

      DataSeries ma = SMA.Series(Close, maPer);
      DataSeries diplus = DIPlus.Series(Bars, dmPer);
      DataSeries diminus = DIMinus.Series(Bars, dmPer);

      ChartPane diPane = CreatePane(40, true, true);
      PlotSeries(diPane, diplus, Color.Green, LineStyle.Solid, 2);
      PlotSeries(diPane, diminus, Color.Red, LineStyle.Solid, 2);
      PlotSeries(PricePane, ma, Color.Blue, LineStyle.Solid, 2);

      for(int bar = Math.Max(maPer, dmPer); bar < Bars.Count; bar++)
      {
         if( CrossOver(bar, diplus, diminus) ) {
            dmiLong = true;
            dmiShort = false;
         }
         else if( CrossUnder(bar, diplus, diminus) ) {
            dmiLong = false;
            dmiShort = true;
         }

         if( CrossOver(bar, Close, ma) )   {
            maLong = true;
            maShort = false;
         }
         else if( CrossUnder(bar, Close, ma) ) {
            maLong = false;
            maShort = true;
         }

         if (IsLastPositionActive)
         {
            Position p = LastPosition;
            if( p.PositionType == PositionType.Long )
            {
               if( dmiShort && maShort ) {
                  SellAtClose(bar, p);
                  ShortAtClose(bar);
               }
            }
            else if( dmiLong && maLong ) {
               CoverAtClose(bar, p);
               BuyAtClose(bar);
            }
         }
         else if( dmiLong && maLong )
            BuyAtClose(bar);
         else if( dmiShort && maShort )
            ShortAtClose(bar);
      }
   }
}
![]() AMIBROKER: DMI & MOVING AVERAGE SYSTEM
AMIBROKER: DMI & MOVING AVERAGE SYSTEM
In “Combining Dmi And Moving Average For A Eur/Usd Trading System” in this issue, author Rombout Kerstens presents a simple system that uses the standard directional index indicator (Dmi) and a simple moving average. Coding such a system is very straightforward. A ready-to-use formula for the article is presented in Listing 1. To use it, enter the formula in the Afl Editor, then select the Tools | Backtest menu.
LISTING 1
LenMa = Param("MA period", 30, 10, 100 );
LenDMI = Param("DMI period", 14, 5, 100 );

DmiLong = PDI( LenDMI ) > MDI( LenDMI );
DmiShort = PDI( LenDMI ) < MDI( LenDMI );

MALong = C > MA( C, LenMA );
MAShort = C < MA( C, LenMA );

Buy = DMILong AND MALong;
Short = DMIShort AND MAShort;
Sell = Short;
Cover = Buy;![]() NEUROSHELL TRADER: DMI & MOVING AVERAGE SYSTEM
NEUROSHELL TRADER: DMI & MOVING AVERAGE SYSTEM
Rombout Kerstens’ system described in his article in this issue, “Combining Dmi And Moving Average For A Eur/Usd Trading System,” can be easily implemented in NeuroShell Trader by combining a few of NeuroShell Trader’s 800+ indicators. To recreate the Dmi and moving average system, select “New Trading Strategy…” from the Insert menu and enter the following in the appropriate locations of the Trading Strategy Wizard:
Buy long market if all of the following are true:

    A>B( PlusDI( High, Low, Close, 14), MinusDI( High, Low, Close, 14 ) )
    A>B( Close, Avg ( Close, 30 ) )

Sell short market order if all of the following are true:

    A<B( PlusDI( High, Low, Close, 14), MinusDI( High, Low, Close, 14 ) )
    A<B( Close, Avg ( Close, 30 ) )
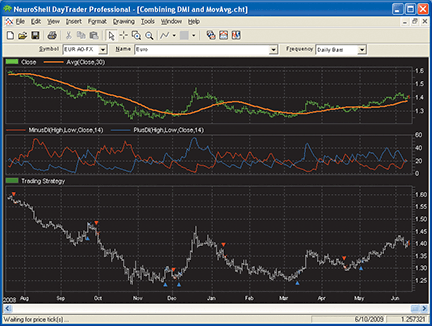
Figure 4: NeuroShell TRADER, DMI & MOVING AVERAGE
If you have NeuroShell Trader Professional, you can also choose whether the system parameters should be optimized. After backtesting the trading strategies, use the “Detailed Analysis…” button to view the backtest and trade-by-trade statistics for the trailing reversal strategy.
Note that the PlusDI and MinusDI indicators are found in NeuroShell Trader’s Advanced Indicator Set 2 add-on.
A sample chart is shown in Figure 4. For more information on NeuroShell Trader, visit www.NeuroShell.com.
![]() NeoTicker: DMI & MOVING AVERAGE SYSTEM
NeoTicker: DMI & MOVING AVERAGE SYSTEM
The trading system presented in Rombout Kerstens’ article in this issue, “Combining Dmi And Moving Average For A Eur/Usd Trading System,” is a system that only generates signals when both the Dmi and the moving average confirm buy/sell signals. This combined Dmi and moving average signal system can be implemented in the NeoTicker power indicator Backtest EZ (Figure 5) by inputting the buy/sell signals formula into the long/short entry field (see Listing 1).
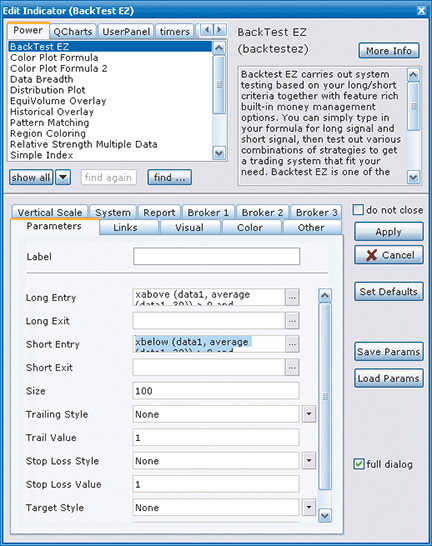
Figure 5: NEOTICKER, dmi & moving average system. The combined DMI and moving average system can be implemented in the NeoTicker power indicator Backtest EZ by inputting the buy/sell signals formula into the long/short entry field.
LISTING 1
Long Entry: xabove (data1, average (data1, 30)) > 0 and xabove (DMIplus(data1,14), DMIminus(data1,14)) > 0
Short Entry: xbelow (data1, average (data1, 30)) > 0 and xbelow (dmiplus(data1, 14), dmiminus(data1, 14)) > 0
The advantage of utilizing Backtest EZ instead of creating an independent trading system script is that stops and exits are readily available as standard settings of Backtest EZ, so that users can change them by changing a few simple selections.
Backtest EZ plots system equity on a chart (Figure 6). I have added moving average and Dmi plus/minus to show signals triggered only when both the moving average and the Dmi confirm the crossover signal.
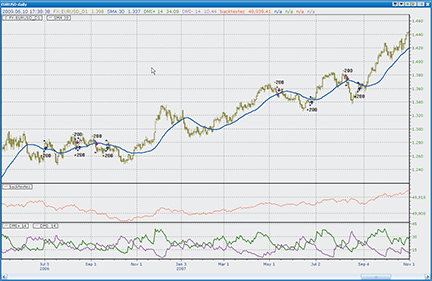
Figure 6: NEOTICKER, SYSTEM EQUITY. System equity is plotted on a chart using the Backtest EZ feature in NeoTicker. DMI plus/minus were added to show signals triggered only when both the moving average and the DMI confirm the crossover signal.
A downloadable version of the chart shown in Figure 6 will be available at the NeoTicker blog site (https://blog.neoticker.com).
![]() AIQ: DMI & MOVING AVERAGE SYSTEM
AIQ: DMI & MOVING AVERAGE SYSTEM
The Aiq code is given here for the three trend-following systems described in Rombout Kerstens’ article in this issue, “Combining Dmi And Moving Average For A Eur/Usd Trading System.”
In the article, Kerstens applies the systems to a single market, theEur/Usdforex pair. I decided to try the systems on stocks using the Russell 1000 list.
The systems suggested by the author do not include a sorting algorithm to choose trades when there are more trades than we can take on any single day based on our capitalization and position-sizing rules. I added code for the Aiq relative strength indicator for this purpose.
I used a test period of 6/1/1990 to 6/12/2009 and focused the tests on the combined Dmi and MA system. The initial tests for trading long only showed that the drawdown was in excess of 57% and trading short only showed a complete loss of the initial capital for the test period. Because of these issues, I added a market timing filter that trades long only when the S&P 500 index is above its 250-day moving average and short only when below this average.
In Figure 7, I show the equity curve (blue line) using the author’s parameters with the market-timing filter trading long only. The average return of the system significantly outperformed the S&P 500 index (Spx), the red line in Figure 7. The short side, even with the market timing filter, did not work, losing all of the initial capital.
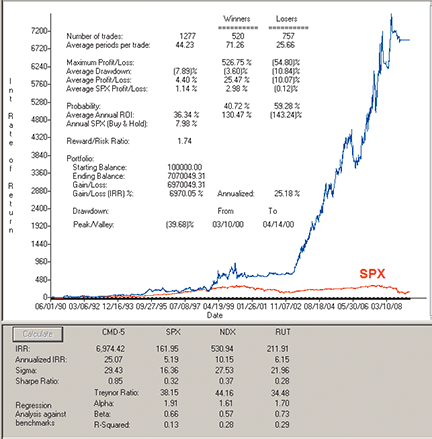
Figure 7: AIQ, COMBINED DMI & MA system. Shown here is a sample equity curve (blue line) for the combined DMI & MA system with a market-timing filter and trading the Russell 1000 stocks, long only, for the period 6/1/1990 to 6/12/2009, compared to the S&P 500 index (red line).
!! COMBINING DMI & MA
! Author: Rombout Kerstens, TASC August 2009
! Coded by: Richard Denning 6/9/09
! www.TradersEdgeSystems.com

! INPUTS:
     dmiLen is 14.
     maLen is 30.
     mktLen is 250.

! ABBREVIATIONS:
    C is [close].
    H is [high].
    L is [low].
    C1 is val([close],1).
    H1 is val([high],1).
    L1 is val([low],1).
    SPXc is tickerUDF("SPX",C).

! ENTRY & EXIT RULES-MA SYSTEM:
    BuyMA if C > simpleavg(C,maLen).
    SellMA if C < simpleavg(C,maLen).

! ENTRY & EXIT RULES-DMI SYSTEM:
    BuyDMI if PlusDMI > MinusDMI.
    SellDMI if PlusDMI < MinusDMI.

! ENTRY & EXIT RULES-COMBINED SYSTEM:
    Buy if BuyMA and BuyDMI.
    Sell if SellMA and SellDMI.

! ENTRY & EXIT RULES-MA CROSSOVER SYSTEM (IF STOPS ADDED):
    BuyMAx if BuyMA and valrule(C < simpleavg(C,maLen),1).
    SellMAx if SellMA and valrule(C > simpleavg(C,maLen),1).

! ENTRY & EXIT RULES-DMI CROSSOVER SYSTEM (IF STOPS ADDED):
    BuyDMIx if BuyDMI and valrule(PlusDMI < MinusDMI,1).
    SellDMIx if SellDMI and valrule(PlusDMI > MinusDMI,1).

! ENTRY & EXIT RULES-COMBINDED SYSTEM (FOR ALTERNATE EXITS):
    BuyLE if Buy.
    SellSE if Sell.
    ExitLX if SellMA or SellDMI.
    ExitSX if BuyMA or BuyDMI.

!! ADD MARKET TRENDFOLLOWING FILTER:
   OKtoBuy if SPXc > simpleavg(SPXc,mktLen)
	and valrule(SPXc > simpleavg(SPXc,mktLen),1).
   OKtoSell if SPXc < simpleavg(SPXc,mktLen)
	and valrule(SPXc < simpleavg(SPXc,mktLen),1).
   BuyMkt if Buy and OKtoBuy.  ! FINAL SYSTEM
   SellMkt if Sell and OKtoSell.

! CODE FOR DMI:
    TR is max(Max(H-L,abs(H-C1)),abs(C1-L)).
    emaLen is 2 * dmiLen - 1.
    rH is (H-H1).
    rL is (L1-L).
    DMplus is iff(rH > 0 and rH > rL, rH, 0).
    DMminus is iff(rL > 0 and rL >= rH, rL, 0).
    avgPlusDM is expAvg(DMplus,emaLen).
    avgMinusDM is expavg(DMminus,emaLen).
    ATR is expAvg(TR,emaLen).
    PlusDMI is (AvgPlusDM/ATR)*100.	!PLOT AS INDICATOR (2lines)
    MinusDMI is AvgMinusDM/ATR*100.	!PLOT AS INDICATOR (2 lines)

!AIQ MID TERM RELATIVE STRENGTH:
MTL is 60.
Q3m is MTL / 4.
Q2m is (MTL - Q3m) / 3.
Q1m is (MTL - Q2m - Q3m) / 2.
Q0m is MTL - Q1m - Q2m - Q3m.
ROCq3m is (val([close],Q2m,(Q1m+Q0m)) - val([open],Q3m,(Q2m+Q1m+Q0m)))
	/ val([open],Q3m,(Q2m+Q1m+Q0m)) * 100.
ROCq2m is (val([close],Q1m,Q0m) - val([open],Q2m,(Q1m+Q0m))) /
	val([open],Q2m,(Q1m+Q0m)) * 100.
ROCq1m is (val([close],Q0m,0) - val([open],Q1m,Q0m)) /
	 val([open],Q1m,Q0m) * 100.
ROCq0m is ([close] - val([open],Q0m,0)) / val([open],Q0m,0) * 100.
RS_AIQmt is ROCq0m * 0.40 + ROCq1m * 0.20 + ROCq2m * 0.20 + ROCq3m * 0.20.

 !AIQ SHORT TERM RELATIVE STRENGTH:
STL is 30.
Q3s is STL / 4.                !! Code error discovered 6/28/06 was LTL / 4
Q2s is (STL - Q3s) / 3.
Q1s is (STL - Q2s - Q3s) / 2.
Q0s is STL - Q1s - Q2s - Q3s.
ROCq3s is (val([close],Q2s,(Q1s+Q0s)) - val([open],Q3s,(Q2s+Q1s+Q0s))) /
	val([open],Q3s,(Q2s+Q1s+Q0s)) * 100.
ROCq2s is (val([close],Q1s,Q0s) - val([open],Q2s,(Q1s+Q0s))) /
	val([open],Q2s,(Q1s+Q0s)) * 100.
ROCq1s is (val([close],Q0s,0) - val([open],Q1s,Q0s)) /
	val([open],Q1s,Q0s) * 100.
ROCq0s is ([close] - val([open],Q0s,0)) / val([open],Q0s,0) * 100.
RS_AIQst is ROCq0s * 0.40 + ROCq1s * 0.20 + ROCq2s * 0.20 + ROCq3s * 0.20.
This code can be downloaded from the Aiq website at www.aiqsystems.com and also from www.TradersEdgeSystems.com/traderstips.htm.
![]() TRADERSSTUDIO: DMI & MOVING AVERAGE SYSTEM
TRADERSSTUDIO: DMI & MOVING AVERAGE SYSTEM
Shown here is the TradersStudio code to help implement the Dmi and moving average trading system and related functions described in Rombout Kerstens’ article in this issue, “Combining Dmi And Moving Average For A Eur/Usd Trading System.”
The coded version that I am providing here is really three systems in one, with an input variable called “sysType” that sets which system is being run. An explanation of the settings can be found at the beginning of the code for the system.
Instead of just repeating the author’s test on a single market, I created a portfolio of 38 of the more actively traded, full-sized futures contracts. I used Pinnacle back-adjusted data (day session only) for the following symbols: AD, BO, BP, C, CC, CD, CL, CT, DJ, DX, ED, FA, FC, FX, GC, HG, HO, HU, JO, JY, KC, KW, LC, LH, NG, NK, PB, RB, S, SB, SF, SI, SM, SP, TA, TD, UA, W.
I first ran the portfolio from 1990 to 2009, with the parameters the author used for the forex pair Eur/Usd, but the results were not particularly good. I then ran optimizations on each system to determine the most robust range for the parameters. For the moving average system, this turned out to be between 30 and 80 days (see Figure 8) and for the Dmi system, this turned out to be from 18 to 26 days (Figure 9). For the combined system (Figure 10), I show the three-dimensional plot of the two parameters against net profit. Using the parameter set 28, 35, 3, the combined system was profitable on 71% of the markets.
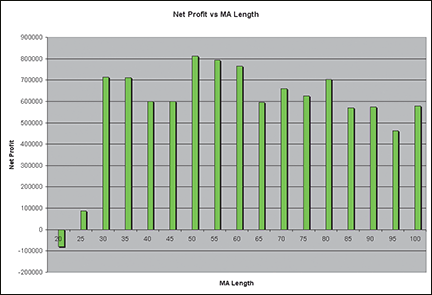
Figure 8: TRADERSSTUDIO, PARAMETER OPTIMIZATION, moving average length versus net profit. Here is a parameter optimization graph of moving average length versus net profit for a portfolio of 38 futures contracts for the period from 5/30/1990 to 6/9/2009.
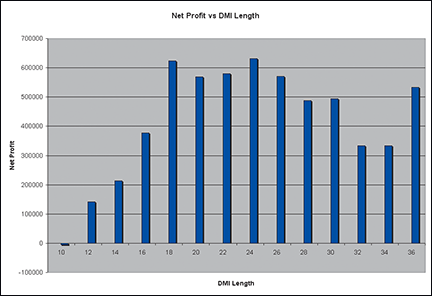
Figure 9: TRADERSSTUDIO, PARAMETER OPTIMIZATION, DMI length versus net profit. Here is a parameter optimization graph of DMI length versus net profit for a portfolio of 38 futures contracts for the period from 5/30/1990 to 6/9/2009.
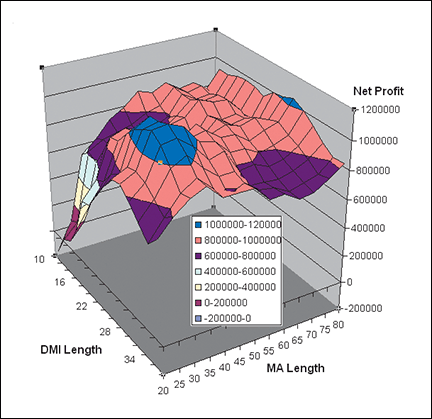
Figure 10: TRADERSSTUDIO, COMBINED SYSTEM. Here is a three-dimensional graph of the combined system using both the moving average and the DMI parameter optimization versus net profit for a portfolio of 38 futures contracts for the period from 5/30/1990 to 6/9/2009.
This code can be downloaded from the TradersStudio website at www.TradersStudio.com ->Traders Resources->FreeCode and also from www.TradersEdgeSystems.com/traderstips.htm.
' COMBINING DMI & MA
' Author: Rombout Kerstens, TASC August 2009
' Coded by: Richard Denning 6/9/09
' www.TradersEdgeSystems.com

Sub DMI_MA(dmiLen, maLen, sysType)
    ' dmiLen = 28, maLen = 35, sysTyp = 3
    ' sysType = 1: run single using only DMI
    ' sysType = 2: run single using only moving average
    ' sysType = 3: run combined using MA & DMI

Dim DMIP As BarArray
Dim DMIM As BarArray
Dim MA As BarArray

DMIP = DMIPlus(dmiLen,0)
DMIM = DMIMinus(dmiLen,0)
MA = Average(C,maLen)

If sysType = 1 Then
    If CrossesOver(DMIP,DMIM) Then Buy("LE_DMI",1,0,CloseEntry,Day)
    If CrossesOver(DMIM,DMIP) Then Sell("SE_DMI",1,0,CloseEntry,Day)
End If
If sysType = 2 Then
    If CrossesOver(C,MA) Then Buy("LE_MA",1,0,CloseEntry,Day)
    If CrossesOver(MA,C) Then Sell("SE_MA",1,0,CloseEntry,Day)
End If
If sysType = 3 Then
    If C > MA And DMIP > DMIM Then Buy("LE_MA_DMI",1,0,CloseEntry,Day)
    If C < MA And DMIP < DMIM Then Sell("SE_MA_DMI",1,0,CloseEntry,Day)
End If
marketbreakdown_RD()
End Sub
![]() STRATASEARCH: DMI & MOVING AVERAGE SYSTEM
STRATASEARCH: DMI & MOVING AVERAGE SYSTEM
Currency trading has become very popular, and the article by Rombout Kerstens in this issue, “Combining Dmi And Moving Average For A Eur/Usd Trading System,” provides a helpful strategy that operates well as a starting point. However, our tests indicate that this system has some weaknesses and might therefore benefit from some additional indicators or stops.
On the surface, all the performance statistics mentioned by Kerstens in the article were confirmed by our tests. The system has a good avgP/avgL ratio, a high average return per trade, and a relatively small number of consecutive losses. Likewise, the profits were realized in a relatively small number of lucrative trades, just as the author suggests.
When analyzing this system through the flow of equity, however, it became apparent that the system’s drawdowns can be problematic. Using 10:1 leverage, our tests showed several trades exceeding 40% losses, with one trade exceeding a 70% loss when using this system. Traders might therefore want to investigate the use of stops or add additional trading rules to help eliminate scenarios where drawdowns are imminent.
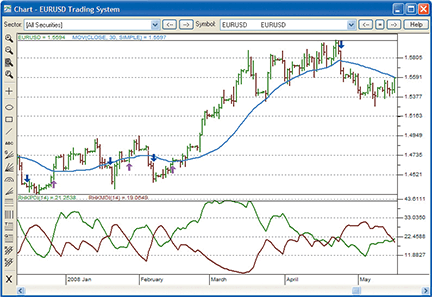
Figure 11: STRATASEARCH, EUR/USD TRADING SYSTEM COMBINING DMI & MA. Using moving average and directional movement crossovers helps eliminate many false signals that would have been triggered by using either crossover independently.
As with all our other StrataSearch Traders’ Tips, additional information — including plug-ins — can be found in the Shared Area of the StrataSearch user forum. This month&rsquos plug-in allows StrataSearch users to quickly run this base system in an automated search to look for supporting trading rules that help eliminate its potential drawdowns.
//*********************************************************
// EUR/USD Trading System Long
//*********************************************************
Entry String:
rhkPDI(14) > rhkMDI(14) AND close > mov(close, 30, simple)

Exit String:
rhkPDI(14) < rhkMDI(14) AND close < mov(close, 30, simple)

//*********************************************************
// EUR/USD Trading System Short
//*********************************************************
Entry String:
rhkPDI(14) < rhkMDI(14) AND close < mov(close, 30, simple)

Exit String:
rhkPDI(14) > rhkMDI(14) AND close > mov(close, 30, simple)
![]() TRADECISION: DMI & MOVING AVERAGE SYSTEM
TRADECISION: DMI & MOVING AVERAGE SYSTEM
The article by Rombout Kerstens in this issue, “Combining Dmi And Moving Average For A Eur/Usd Trading System,” demonstrates how the combination of a moving average (MA) and the directional movement index (Dmi) can limit the number of trades while delivering better results per trade than using either alone.
Using Tradecision&rsquos Strategy Builder, you can recreate this strategy as follows:
Tradecision code

Long:
Var
 ParamMA:=30;
 ParamDMI:=14;
 DMILong:=false;
 DMIShort:=false;
 MALong:=false;
 MAShort:=false;
 vDMIMinus:=0;
 vDMIPlus:=0;
 MA:=0;
 End_var

 vDMIMinus := DMIMinus(ParamDMI);
 vDMIPlus := DMIPlus(ParamDMI);
 MA := SMA(Close,ParamMA);

 if HISTORYSIZE > ParamMA then
    begin
         if CrossAbove(vDMIPlus,vDMIMinus)
         then
              begin
              DMILong := true;
              DMIShort := false;
              end;
         if CrossBelow(vDMIPlus,vDMIMinus)
         then
             begin
             DMILong := false;
             DMIShort := true;
             end;
         if CrossAbove(Close,MA)
         then
             begin
             MALong := true;
             MAShort := false;
             end;
         if CrossBelow(Close,MA)
         then
             begin
             MALong := false;
             MAShort := true;
             end;

 If dmilong = true and malong = true then
 return true;
end;
return false;

Short:
Var
 ParamMA:=30;
 ParamDMI:=14;
 DMILong:=false;
 DMIShort:=false;
 MALong:=false;
 MAShort:=false;
 vDMIMinus:=0;
 vDMIPlus:=0;
 MA:=0;
 End_var

 vDMIMinus := DMIMinus(ParamDMI);
 vDMIPlus := DMIPlus(ParamDMI);
 MA := SMA(Close,ParamMA);

 if HISTORYSIZE > ParamMA then
    begin
         if CrossAbove(vDMIPlus,vDMIMinus)
         then
              begin
              DMILong := true;
              DMIShort := false;
              end;
         if CrossBelow(vDMIPlus,vDMIMinus)
         then
             begin
             DMILong := false;
             DMIShort := true;
             end;
         if CrossAbove(Close,MA)
         then
             begin
             MALong := true;
             MAShort := false;
             end;
         if CrossBelow(Close,MA)
         then
             begin
             MALong := false;
             MAShort := true;
             end;

 If dmishort = true and mashort = true then
 return true;
end;
return false;
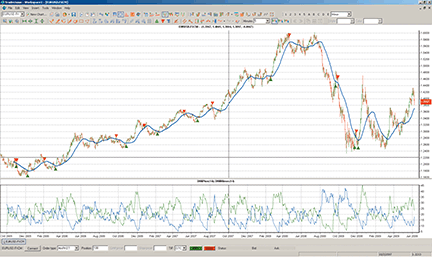
FIGURE 12: TRADECISION, SMA AND DMI INDICATORS. Here is an example of a 30-period simple moving average and two 14-period directional movement indexes plotted on a daily EUR/USD chart with the strategy based on the intersection of indicators.
To import the strategy into Tradecision, visit the area “Traders’ Tips from Tasc Magazine” at www.tradecision.com/support/tasc_tips/tasc_traders_tips.htm or copy the code from the Stocks & Commodities website at www.traders.com.
![]() NINJATRADER: DMI & MOVING AVERAGE SYSTEM
NINJATRADER: DMI & MOVING AVERAGE SYSTEM
We have implemented Rombout Kerstens’ trading system described in his article in this issue, “Combining Dmi And Moving Average For A Eur/Usd Trading System,” as a sample strategy available for download at www.ninjatrader.com/SC/August2009SC.zip.
Once it has been downloaded, from within the NinjaTrader Control Center window, select the menu File > Utilities > Import NinjaScript and select the downloaded file. This strategy is for NinjaTrader Version 6.5 or greater.
You can review the strategy’s source code by selecting the menu Tools > Edit NinjaScript > Strategy from within the NinjaTrader Control Center window and selecting “DmiMa.”
NinjaScript indicators are compiled Dlls that run native, not interpreted, which provides you with the highest performance possible.
A sample chart implementing the strategy is shown in Figure 13.
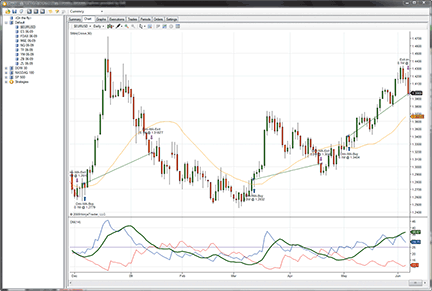
Figure 13: NINJATRADER, DMI & MA system. This screenshot shows a partial view of several executed trades in the NinjaTrader Strategy Analyzer.
![]() WAVE59: DMI & MOVING AVERAGE SYSTEM
WAVE59: DMI & MOVING AVERAGE SYSTEM
In “Combining Dmi And Moving Average For A Eur/Usd Trading System” in this issue, author Rombout Kerstens demonstrates a simple trend-following system based on a combination of a simple moving average and J. Welles Wilder’s Dmi.
This is a very simple indicator to code using Wave59’s QScript language. The results since 2000 show that this approach generated a gain of more than 12% per year on Apple Inc. (Aapl). Note in Figure 14 the extremely sharp jumps in the equity curve beginning around 2005. This is a clear example of Kerstens’ point that the bulk of the profits made from a trend-following system usually come from a small number of moves.
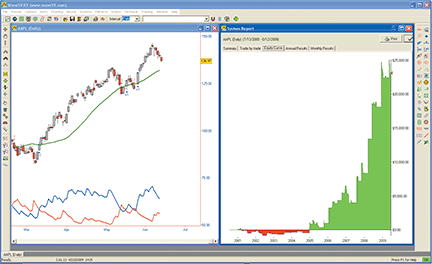
FIGURE 14: WAVE59, DMI & MOVING AVERAGE SYSTEM. The system generated a gain of more than 12% per year since 2000 on Apple Inc. Note the sharp jumps in the equity curve beginning around 2005, demonstrating that with trend-following systems, the bulk of the profits often comes from a small number of moves.
The following script implements this system in Wave59. As always, users of Wave59 can download these scripts directly using the QScript Library found at https://www.wave59.com/library.
Indicator: SC_Kerstens_System
input:dmi_length(14),ma_length(30);

#calculate indicators
dmi_plus = DMIPlus(dmi_length);
dmi_minus = DMIMinus(dmi_length);
ma = average(close,ma_length);

#generate system signals
if ((marketposition<1) and (dmi_plus>dmi_minus) and (close>ma))
   buy(1,close,"market","onebar");
if ((marketposition>-1) and (dmi_plus<dmi_minus) and (close<ma))
   sell(1,close,"market","onebar");
![]() VT TRADER: DMI & MOVING AVERAGE SYSTEM
VT TRADER: DMI & MOVING AVERAGE SYSTEM
Our Traders’ Tip this month is inspired by Rombout Kerstens’ article in this issue, “Combining Dmi And Moving Average For A Eur/Usd Trading System.” In the article, Kerstens describes a trading system based on combining the directional movement index (Dmi) with a moving average (MA).
We’ll be offering the Dmi & MA trading system for download in our client forums. The VT Trader instructions for creating a sample of this trading system are as follows:
- Navigator Window>Tools>Trading Systems Builder>[New] button
- In the Indicator Bookmark, type the following text for each field:
Name: TASC - 08/2009 - DMI and Moving Average Trading System
Short Name: tasc_DmiMaSys
Label Mask: TASC - 08/2009 - DMI and MA System (DMI: %pr%, MA: %maprice%,%maperiods%,%matype%)
- In the Input Bookmark, create the following variables:
[New] button... Name: Pr , Display Name: DMI Periods , Type: integer , Default: 14
[New] button... Name: maprice , Display Name: MA Price , Type: price , Default: Close
[New] button... Name: maperiods , Display Name: MA Periods , Type: integer, Default: 30
[New] button... Name: matype , Display Name: MA Type , Type: MA type , Default: Simple
[New] button... Name: SignalSeparationInBars , Display Name: # of Bars Between DMI/MA Signals , Type: integer, Default: 0
- In the Output Bookmark, create the following variables:
	[New] button...
Var Name: MA
Name: Moving Average
* Checkmark: Indicator Output
Select Indicator Output Bookmark
Color: blue
Line Width: slightly thicker
Line Style: solid
Placement: Price Frame
[OK] button...

	[New] button...
Var Name: PlusDI
Name: Plus DI
* Checkmark: Indicator Output
Select Indicator Output Bookmark
Color: blue
Line Width: thin
Line Style: solid
Placement: Additional Frame 1
[OK] button...

[New] button...
Var Name: MinusDI
Name: Minus DI
* Checkmark: Indicator Output
Select Indicator Output Bookmark
Color: red
Line Width: thin
Line Style: solid
Placement: Additional Frame 1
[OK] button...

[New] button...
Var Name: LongSignal
Name: Long Signal
Description: Displays a buy signal when the price>MA and PlusDI>MinusDI
* Checkmark: Graphic Enabled
* Checkmark: Alerts Enabled
Select Graphic Bookmark
Font […]: Up Arrow
Size: Medium
Color: Blue
Symbol Position: Below price plot
	Select Alerts Bookmark
		Alert Message: Long signal detected! The price>MA and PlusDI>MinusDI.
		Radio Button: Standard Sound
		Standard Sound Alert: others.wav
[OK] button...

[New] button...
Var Name: ShortSignal
Name: Short Signal
Description: Displays a sell signal when the price<MA and PlusDI<MinusDI
* Checkmark: Graphic Enabled
* Checkmark: Alerts Enabled
Select Graphic Bookmark
Font […]: Down Arrow
Size: Medium
Color: Red
Symbol Position: Above price plot
	Select Alerts Bookmark
		Alert Message: Short signal detected! The price<MA and PlusDI<MinusDI.
		Radio Button: Standard Sound
		Standard Sound Alert: others.wav
[OK] button...

[New] button...
Var Name: OpenBuy
Name: Open Buy
Description: In Auto-Trade Mode, it requests a BUY market order to open a BUY trade
* Checkmark: Trading Enabled
Select Trading Bookmark
Trading Action: BUY
Trader's Range: 10
[OK] button...

[New] button...
Var Name: CloseBuy
Name: Close Buy
Description: In Auto-Trade Mode, it requests a SELL market order to close a BUY trade
* Checkmark: Trading Enabled
Select Trading Bookmark
Trading Action: SELL
Trader's Range: 10
[OK] button...

[New] button...
Var Name: OpenSell
Name: Open Sell
Description: In Auto-Trade Mode, it requests a SELL market order to open a SELL trade
* Checkmark: Trading Enabled
Select Trading Bookmark
Trading Action: SELL
Trader's Range: 10
[OK] button...

[New] button...
Var Name: CloseSell
Name: Close Sell
Description: In Auto-Trade Mode, it requests a BUY market order to close a SELL trade
* Checkmark: Trading Enabled
Select Trading Bookmark
Trading Action: BUY
Trader's Range: 10
[OK] button...
- In the Formula Bookmark, copy and paste the following formula:
//Provided By: Visual Trading Systems, LLC & Capital Market Services, LLC //Copyright (c): 2009 //Notes: August 2009 T.A.S.C. magazine //Notes: "Combining DMI and Moving Average for a EUR/USD Trading System" by Rombout Kerstens} //Description: DMI and Moving Average Trading System //File: tasc_DmiMaSys.vttrs {Directional Movement Index} TH:= if(Ref(C,-1)>H,Ref(C,-1),H); TL:= if(Ref(C,-1)<L,Ref(C,-1),L); TR:= TH-TL; PlusDM:= if(H>Ref(H,-1) AND L>=Ref(L,-1), H-Ref(H,-1), if(H>Ref(H,-1) AND L<Ref(L,-1) AND H-Ref(H,-1)>Ref(L,-1)-L, H-Ref(H,-1), 0)); PlusDI:= 100 * Wilders(PlusDM,Pr)/Wilders(Tr,Pr); MinusDM:= if(L<Ref(L,-1) AND H<=Ref(H,-1), Ref(L,-1)-L, if(H>Ref(H,-1) AND L<Ref(L,-1) AND H-Ref(H,-1)<Ref(L,-1)-L, Ref(L,-1)-L, 0)); MinusDI:= 100 * Wilders(MinusDM,Pr)/Wilders(Tr,Pr); {Moving Average} MA:= mov(maprice,maperiods,matype); {Trade Signals} LongCond1:= BarsSince(Cross(PlusDI,MinusDI))<=SignalSeparationInBars AND Cross(C,MA); LongCond2:= BarsSince(Cross(C,MA))<=SignalSeparationInBars AND Cross(PlusDI,MinusDI); ShortCond1:= BarsSince(Cross(MinusDI,PlusDI))<=SignalSeparationInBars AND Cross(MA,C); ShortCond2:= BarsSince(Cross(MA,C))<=SignalSeparationInBars AND Cross(MinusDI,PlusDI); LongSignal:= SignalRemove(LongCond1 OR LongCond2,ShortCond1 OR ShortCond2); ShortSignal:= SignalRemove(ShortCond1 OR ShortCond2,LongCond1 OR LongCond2); {Auto-Trading Functionality; Used in Auto-Trade Mode Only} OpenBuy:= LongSignal AND (EventCount('OpenBuy') = EventCount('CloseBuy')); CloseBuy:= ShortSignal AND (EventCount('OpenBuy') > EventCount('CloseBuy')); OpenSell:= ShortSignal AND (EventCount('OpenSell') = EventCount('CloseSell')); CloseSell:= LongSignal AND (EventCount('OpenSell') > EventCount('CloseSell')); - Click the “Save” icon to finish building the DMI and MA trading system.
To attach the trading system to a chart (see Figure 15), select the “Add Trading System” option from the chart’s contextual menu, select “TASC - 08/2009 - DMI and Moving Average Trading System” from the trading systems list, and click the [Add] button.
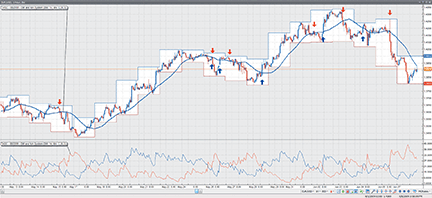
Figure 15: VT TRADER, DMI & MA Trading System. Here is a demonstration of Kerstens’ trading system on a EUR/USD one-hour candlestick chart.
To learn more about VT Trader, visit www.cmsfx.com.
Risk disclaimer: Forex trading involves a substantial risk of loss and may not be suitable for all investors.
![]() TRADE IDEAS: 200-DAY MA STOCK-TRADING STRATEGY
TRADE IDEAS: 200-DAY MA STOCK-TRADING STRATEGY
“It’s not being wrong that kills you, it’s staying wrong that kills you.” —Jeff Macke, trader
For this month’s Traders’ Tip, we offer a stock-trading strategy based, in part, on the position of a stock near its 200-day moving average. Specifically, this strategy discovers that in today’s market, the 200-day Sma offers a good support price for a small swing trade. We asked our event-based backtesting tool, The OddsMaker, to evaluate a strategy that buys new multiday lows.
To recap briefly, The OddsMaker doesn’t just look at a basket of stocks, à priori, to generate backtest results, it considers any stock that matched a desired pattern in the market, finds that stock, and applies the backtest’s rule set before summing up the results into a detailed set of totals: win rate, average winner, average loser, net winnings, and confidence factor. (See Figure 18.)
This strategy owes its high-percentage win rate, in part, to a decision to set the days up/down in a row filter to only show us stocks that are down five days in a row or more (Max days up = -5).
Description: “New Low Right Above the 200 Day SMA”
Provided by:
Trade Ideas (copyright © Trade Ideas LLC 2009). All rights
reserved. For educational purposes only. Remember these are
sketches meant to give an idea how to model a trading plan.
Trade-Ideas.com and all individuals affiliated with this site
assume no responsibilities for trading and investment results.
Type or copy/paste the following shortened string directly into a browser, then copy/paste the full-length link into Trade-Ideas Pro using the “Collaborate” feature (right-click in any strategy window):
https://bit.ly/16eHIM (case-sensitive)
This strategy also appears on the Trade Ideas blog at https://marketmovers.blogspot.com/, or you can build the strategy from Figure 16, which shows the configuration of the strategy, where one alert and three filters are used with the following settings:
- New low alert
- Max up days = -5 (days)
- Min up from 200-day Sma filter = 0.01 (%)
- Max distance from inside market filter = 1.0 (%)
The definitions of these indicators appear here: https://www.trade-ideas.com/Help.html.
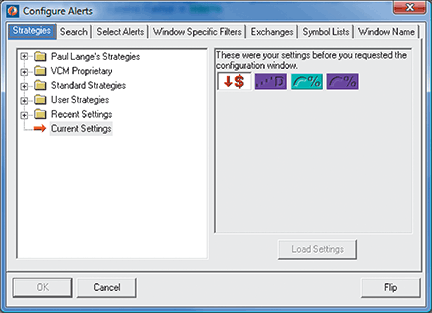
FIGURE 16: TRADE IDEAS, ALERTS AND FEATURES. Here is the combination of alerts and filters used to create the “New low right above the 200-day SMA” strategy.
That’s the strategy, but what about the trading rules? How should the opportunities that the strategy finds be traded? In summary, these are stocks that are being sold off aggressively right into the 200-day Sma. We evaluated several time frames but were ultimately led to selling at the open after two days. Note that we did not check the box for setting a profit target or stop-loss. The OddsMaker results provide good guidelines, however, using the average winning and average losing trade.
We used the following trade rules for the strategy:
- On each alert, buy (long) the symbol (price moves up to be a successful trade)
- Schedule an exit for the stocks at the open after two days
- Trade any time during the market session.
The OddsMaker summary provides the evidence of how well this strategy and our trading rules did. The settings we used are shown in Figure 17. The results (last backtested for the 30-day period ended 6/9/2009) are shown in Figure 18.
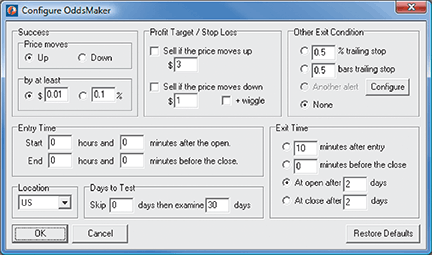
FIGURE 17: TRADE IDEAS, BACKTESTING CONFIGURATION. This shows the OddsMaker backtesting configuration used for the “New low right above the 200-day SMA” strategy.
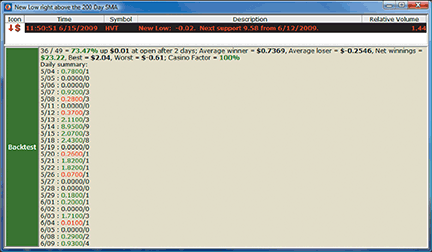
FIGURE 18: TRADE IDEAS, ODDSMAKER BACKTESTING RESULTS. Here are the OddsMaker results for the “New low right above the 200-day SMA” strategy.
The summary reads as follows: This strategy generated 49 trades, of which 36 were profitable for a win rate of 73%. The average winning trade generated $0.74 in profit and the average loser lost $0.25. The net winnings of using this strategy for 30 trading days generated $23.22 points. If you normally trade in 100-share lots, this strategy would have generated $2,322. The z-score or confidence factor that the next set of results will fall within this strategy’s average winner and loser is 100%.
See the user’s manual at https://www.trade-ideas.com/OddsMaker/Help.html for help with interpreting backtest results from The OddsMaker.
![]() EASYLANGUAGE: COMBINING DMI AND MOVING AVERAGE FOR A EUR/USD TRADING SYSTEM
EASYLANGUAGE: COMBINING DMI AND MOVING AVERAGE FOR A EUR/USD TRADING SYSTEM
From Rombout Kerstens’ article in this issue, “Combining Dmi And Moving Average For A Eur/Usd Trading System”.
MA AND DMI
Inputs:
	ParamMA(30),
	ParamDMI(14);
Vars:
	DMILong(false),
	DMIShort(false),
	MALong(false),
	MAShort(false),
	vDMIMinus(0),
	vDMIPlus(0),
	MA(0);

vDMIMinus = DMIMinus(ParamDMI);
vDMIPlus = DMIPlus(ParamDMI);
MA = Average(Close,ParamMA);

if currentbar > 1 then
begin
	if vDMIPlus crosses above vDMIMinus then
	begin
	 DMILong = true;
	 DMIShort = false;
	end;
    if vDMIPlus crosses below vDMIMinus then
	begin
	 DMILong = false;
	 DMIShort = true;
	end;
	if close crosses above MA then
	begin
	 MALong = true;
	 MAShort = false;
	end;
	if close crosses below MA then
	begin
	 MALong = false;
	 MAShort = true;
	end;

    If dmilong and malong then buy this bar on close;
    If dmishort and mashort then sell this bar on close;