February 2005
TRADERS' TIPS
You can copy these formulas and programs for easy use in your spreadsheet or analysis software. Simply "select" the desired text by highlighting as you would in any word processing program, then use your standard key command for copy or choose "copy" from the browser menu. The copied text can then be "pasted" into any open spreadsheet or other software by selecting an insertion point and executing a paste command. By toggling back and forth between an application window and the open Web page, data can be transferred with ease.
This month's tips include formulas and programs for:
or return to February 2005 ContentsTRADESTATION: THE TRUTH ABOUT VOLATILITY
WEALTH-LAB: THE TRUTH ABOUT VOLATILITY
AMIBROKER: THE TRUTH ABOUT VOLATILITY
eSIGNAL: THE TRUTH ABOUT VOLATILITY
NEUROSHELL TRADER: THE TRUTH ABOUT VOLATILITY
TRADINGSOLUTIONS: THE TRUTH ABOUT VOLATILITY
NEOTICKER: THE TRUTH ABOUT VOLATILITY
AIQ: THE TRUTH ABOUT VOLATILITY
INVESTOR/RT: THE TRUTH ABOUT VOLATILITY
TRADE NAVIGATOR: THE TRUTH ABOUT VOLATILITY
ASPEN GRAPHICS: THE TRUTH ABOUT VOLATILITY
BULLCHARTS: THE TRUTH ABOUT VOLATILITY
TECHNIFILTER PLUS: THE TRUTH ABOUT VOLATILITY
SMARTRADER: THE TRUTH ABOUT VOLATILITY
TRADESTATION: THE TRUTH ABOUT VOLATILITY
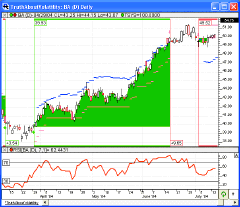
Jim Berg's article in this issue, "The Truth About Volatility," describes a system for screening weekly data to identify candidates and using daily data to enter and manage positions. The TradeStation implementation begins with a weekly RadarScreen identifying stocks with a continuous series of higher highs and higher lows.
The RadarScreen pictured in Figure 1 is set to sort new candidates to the top of the list. By clicking on the symbol, the linked daily and weekly charts display the recent price histories. The daily chart contains a strategy implementing the article's trading rules.
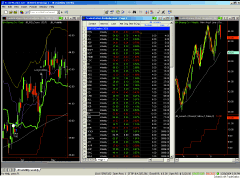
The code shown here can be downloaded from TradeStationWorld.com. Look for the file "JB_Volatility.ELD". In addition, the pictured workspace will be available with the code file.FIGURE 1: TRADESTATION, VOLATILITY SYSTEM. Here is a sample Tradestation RadarScreen based on Jim Berg's article in this issue. The technique screens weekly data to identify trading candidates but uses daily data to enter and manage positions. The daily chart contains a strategy implementing the article's trading rules.
Indicator: JB Volatility Strat
inputs:
HighestHighRange( 20 ),
LowestLowRange( 20 ),
LongATR_Len(10 ),
LongTrailLen( 15 ),
LongProfitTakerLen(13),
WeeklyAverageLength( 34 ),
RSIEntryThreshold( 30 ),
RSI_Length( 7 ),
RSISignalLen( 10 ),
RecentLowLen(3);
variables:
LowestLow(0),
LongATR( 0 ),
EntryLong(0),
LongStop(0),
LongProfitTarget(0),
WeeklyAverage(0),
RSISignalCounter( 0 ),
MP( 0 ),
ImmedStop(0),
LongStopCrossed( False ),
MaxLongStop(0);
Value1 = RSI(close, RSI_Length);
if Value1 crosses over RSIEntryThreshold and
Close > Average( Close, 34*5) and
MarketPosition = 0
then
RSISignalCounter = 0 ;
RSISignalCounter = RSISignalCounter + 1 ;
WeeklyAverage = Average( Close, WeeklyAverageLength * 5 );
LowestLow = Lowest(Low, LowestLowRange);
LongATR = AvgTrueRange( LongATR_Len) ;
EntryLong = LowestLow +2*LongATR;
LongStop = Highest(H, LongTrailLen) - 2*LongATR;
LongProfitTarget = XAverage(High,LongProfitTakerLen)+ 2*LongATR ;
MP = MarketPosition ;
if MP = 0 then
begin
LongStopCrossed = False ;
MaxLongStop = LongStop ;
end
else if LongStop > MaxLongStop then
MaxLongStop = LongStop ;
if Close > WeeklyAverage and
MarketPosition = 0 and
WeeklyAverage > WeeklyAverage[5] and
RSISignalCounter < RSISignalLen
then
begin
Buy next bar at EntryLong stop ;
Sell ("LowestLow") next bar at Lowest(Low, RecentLowLen) stop
;
Sell ("Profit Target#1") next bar at LongProfitTarget limit ;
end ;
if MP[1] = 0 and MP = 1 then
begin
RSISignalCounter = RSISignalLen ;
ImmedStop = Lowest(Low,RecentLowLen + 1);
end ;
if MarketPosition = 1 and
Close[1] < MaxLongStop and
Close >= MaxLongStop and
LongStopCrossed = False
then
LongStopCrossed = True ;
if MarketPosition = 1 and
Close < MaxLongStop and
Close[1]<MaxLongStop and
LongStopCrossed
then
Sell ("LongVolStop") next bar market
else if MarketPosition = 1 then
Sell ("ImmedStop") next bar at ImmedStop stop ;
if MarketPosition = 1 then
Sell next bar at LongProfitTarget limit ;
Indicator: JB_Volatility
inputs:
HighestHighRange( 20 ),
LowestLowRange( 20 ),
LongATR_Len(10 ),
LongTrailLen( 15 ),
LongProfitTargetLen(13);
variables:
LowestLow(0),
LongATR( 0 ),
EntryLong(0),
LongStop(0),
LongProfitTarget(0);
LowestLow = Lowest(Low, LowestLowRange);
LongATR = AvgTrueRange( LongATR_Len) ;
EntryLong = LowestLow + 2 * LongATR;
LongStop = Highest(H, LongTrailLen) - 2*LongATR;
LongProfitTarget = XAverage(High,LongProfitTargetLen)+ 2*LongATR ;
plot1(EntryLong,"Long");
plot2(LongStop,"LongStop");
Plot3(LongProfitTarget,"Target");
Plot4(LowestLow,"LowestL");
Indicator: JB_Screen
inputs:
Price( Close ),
RetracePct( 5 ),
LineColor( Yellow ),
LineWidth( 1 ),
ShowAge( False ),
CS_Threshold(3) ;
variables:
NewSwingPrice( 0 ),
SwingPrice( Price ), { used as a convenient 2-element array }
SwingDate( Date ), { used as a convenient 2-element array }
SwingTime( Time ), { used as a convenient 2-element array }
TLDir( 0 ), { TLDir = -1 implies prev TL dn, +1 implies prev
TL up }
RetraceFctrUp( 1 + RetracePct * .01 ),
RetraceFctrDn( 1 - RetracePct * .01 ),
SaveSwing( false ),
AddTL( false ),
UpdateTL( false ),
TLRef( 0 ),
Counter( 0 ),
ConsecutiveSwings( -1 ),
OldSwingLowPrice(0),
SwingLowPrice(0),
OldSwingHighPrice(0),
SwingHighPrice(0),
TokenCS( -1 ),
Age(0);
{ Candidate swings are just-confirmed, 3-bar (Str=1), SwingHi's and SwingLo's }
NewSwingPrice = SwingHigh( 1, Price, 1, 2 ) ;
if NewSwingPrice <> -1 then
begin
if TLDir <= 0 and NewSwingPrice >= SwingPrice * RetraceFctrUp
then
{ prepare to add new up TL }
begin
SaveSwing = true ;
AddTL = true ;
TLDir = 1 ;
end
else if TLDir = 1 and NewSwingPrice >= SwingPrice then
{ prepare to update prev up TL }
begin
SaveSwing = true ;
UpdateTL = true ;
end ;
end
else
begin
NewSwingPrice = SwingLow( 1, Price, 1, 2 ) ;
if NewSwingPrice <> -1 then
begin
if TLDir >= 0 and NewSwingPrice <= SwingPrice * RetraceFctrDn
then
{ prepare to add new dn TL }
begin
SaveSwing = true ;
AddTL = true ;
TLDir = -1 ;
end
else if TLDir = -1 and NewSwingPrice <= SwingPrice then
{ prepare to update prev dn TL }
begin
SaveSwing = true;
UpdateTL = true ;
end ;
end ;
end ;
if SaveSwing then
{ save new swing and reset SaveSwing }
begin
SwingPrice = NewSwingPrice ;
SwingDate = Date[1] ;
SwingTime = Time[1] ;
SaveSwing = false ;
end ;
if AddTL then
{ add new TL and reset AddTL }
begin
TLRef = TL_New( SwingDate, SwingTime, SwingPrice, SwingDate[1],
SwingTime[1],
SwingPrice[1] ) ;
if SwingPrice > SwingPrice[1] then
begin {new swing Low locked in place}
OldSwingLowPrice = SwingLowPrice ;
SwingLowPrice = SwingPrice[1] ;
if SwingLowPrice > OldSwingLowPrice then
ConsecutiveSwings = ConsecutiveSwings + 1
else
ConsecutiveSwings = 0 ;
end
else if SwingPrice < SwingPrice[1] then {New swing high locked
in place}
begin
OldSwingHighPrice = SwingHighPrice ;
SwingHighPrice = SwingPrice[1] ;
if SwingHighPrice > OldSwingHighPrice then
ConsecutiveSwings = ConsecutiveSwings + 1
else
ConsecutiveSwings = 0 ;
end ;
TokenCS = ConsecutiveSwings ;
TL_SetExtLeft( TLRef, false ) ;
TL_SetExtRight( TLRef, false ) ;
TL_SetSize( TLRef, LineWidth ) ;
TL_SetColor( TLRef, LineColor ) ;
AddTL = false ;
end
else if UpdateTL then
{ update prev TL and reset UpdateTL }
begin
TL_SetEnd( TLRef, SwingDate, SwingTime, SwingPrice ) ;
UpdateTL = false ;
end ;
if Close[1] < SwingHighPrice and Close > SwingHighPrice and TokenCS
= consecutiveswings then
TokenCS = TokenCS + 1 ;
if Close < SwingPrice *(1-RetracePct/100) and Close[1] > SwingPrice
*(1-RetracePct/100) and SwingPrice < SwingHighPrice then
TokenCS = 0 ;
if TokenCS >= 0 then
Plot1(TokenCS,"Swings");
if ShowAge and TokenCS >= CS_Threshold and TokenCS[1] < CS_Threshold
then
begin
Age = 0 ;
end;
if TokenCS >= CS_Threshold then
Age = Age + 1
else if TokenCS = 0 then
Age = 9999 ;
if Showage then
plot2(Age,"Age");
Indicator: JB_RSI_Cross:
inputs:
EntryThreshold( 30 ),
RSI_Length( 7 ) ;
Value1 = RSI(close, RSI_Length);
if Value1 crosses over EntryThreshold and Close > Average( Close, 34*5)
then
Plot1( Close ) ;
--Mark Mills
TradeStation Securities, Inc.
A subsidiary of TradeStation Group, Inc.
www.TradeStationWorld.com
WEALTH-LAB: THE TRUTH ABOUT VOLATILITY
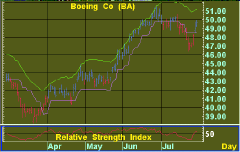
We created a configurable ChartScript that incorporates the trading system rules from Jim Berg's article in this issue, "The Truth About Volatility." The setup condition of higher highs and higher lows in a weekly chart is rather subjective, however, since prices must retrace by some value or percentage to create measurable peaks and troughs. As a result, we settled for a rising 34-period weekly moving average with closing prices above this average to complete the setup (Figure 2).
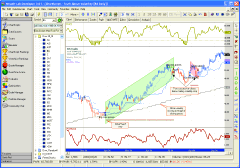
By changing the Boolean constants at the top of the script, you can enable/disable the JB Profit Taker or change from the standard exit to applying the trailing stop only, the latter of which appears to be more effective. In addition, some testing revealed that taking profits too quickly greatly reduced the overall profitability of the system.FIGURE 2: WEALTH-LAB, VOLATILITY SYSTEM. Using 2% maximum risk sizing, the trading system added $10,760 of profit to a $100,000 portfolio over approximately six years (after deducting $8/trade commissions) by trading Boeing alone. In this test, we used two successive closes below the volatility-trailing stop as the exit. Enabling the JB Profit Taker reduced profits to only $4,928 over the same period. The regression channel for each trade is automatically drawn.
Finally, note that the code uses the SetRiskStopLevel statement. When assigning a stop level for a position, you are drawing a line at which price you will exit the trade for a loss. Doing so allows you to implement a maximum risk percentage position-sizing algorithm for each trade. Position sizing alone has a large effect on the outcome of any trading strategy, and Wealth-Lab makes it easy to experiment with the innumerable possibilities.
Wealth-Lab script code:
{$I 'SeriesFillColor'}
const UseJBProfitTarget = false;
const UseStdExit = false; // false uses Trailing Stop exit
var Bar, wBar, p, h2, h2ATR, hwSMA, hEntry, hExit, hRSI, hTStop, hJBtgt,
rPane, aPane: integer;
var bSetup, Xit1, Xit2: boolean;
var fStop, C: float;
{ Create the entry & exit indicator series }
UseUpdatedEMA( true );
hRSI := RSISeries( #Close, 7 );
h2ATR := MultiplySeriesValue( ATRSeries( 10 ), 2 );
hJBtgt := AddSeries( EMASeries( #High, 13 ), h2ATR );
hEntry := AddSeries( LowestSeries( #Low, 20 ), h2ATR );
hTStop := HighestSeries( SubtractSeries( #Close, h2ATR ), 15 );
hExit := SubtractSeries( HighestSeries( #High, 20 ), h2ATR );
{ Weekly SMA indicator }
SetScaleWeekly;
hwSMA := SMASeries( #Close, 34 );
RestorePrimarySeries;
{ Plot indicators }
HideVolume;
PlotStops;
rPane := CreatePane( 75, true, true );
aPane := CreatePane( 75, false, true );
PlotSeriesLabel( DailyFromWeekly( hwSMA ), 0, #Gray, #Thick, 'Weekly
SMA(34)' );
PlotSeriesLabel( hRSI, rPane, #Olive, #Thick, 'RSI(7)' );
SetSeriesFillColor( hRSI, 30, rPane, #Olive, false );
PlotSeriesLabel( h2ATR, aPane, #Maroon, #Thick, '2*ATR(10)' );
PlotSeriesLabel( hEntry, 0, #Blue, #Thin, 'Entry' );
if UseStdExit then
PlotSeriesLabel( hExit, 0, #Red, #Dotted, 'Exit' )
else
PlotSeriesLabel( OffSetSeries( hTStop, -1 ), 0, #Fuchsia, #Dotted,
'Volatility TStop' );
if UseJBProfitTarget then
PlotSeriesLabel( OffSetSeries( hJBtgt, -1 ), 0, #Green, #Dotted,
'JB ProfitTaker' );
{ Main trading loop - start when the 34-bar weekly moving avg is valid
}
for Bar := 170 to BarCount - 1 do
begin
C := PriceClose( Bar );
{ Bar coloring }
if C < @hExit[Bar] then
SetBarColor( Bar, #Red )
else if C > @hEntry[Bar] then
SetBarColor( Bar, #Blue )
else
SetBarColor( Bar, #Black );
if LastPositionActive then
begin { Exit logic }
p := LastPosition;
if not SellAtStop( Bar + 1, fStop, p, 'Stop' ) then
begin
if UseStdExit then
Xit1 := C < @hExit[Bar]
else
{ Trailing stop only if 2 consecutive closes below }
Xit2 := ( C < @hTStop[Bar] )
and ( PriceClose( Bar - 1 ) < @hTStop[Bar] );
if Xit1 or Xit2 then
SellAtMarket( Bar + 1, p, 'TStop' )
else if UseJBProfitTarget then
SellAtLimit( Bar + 1, @hJBtgt[Bar], p, 'JBProfitTgt'
);
end;
end
else
begin { Entry logic }
if CrossUnderValue( Bar, hRSI, 30 ) then
bSetup := true
else if CrossOverValue( Bar, hRSI, 70 ) then
bSetup := false;
wBar := GetWeeklyBar( Bar );
if bSetup and ( ROC( wBar, hwSMA, 2 ) > 0 )
and ( C > @hwSMA[wBar] )
and CrossOver( Bar, #Close, hEntry ) then
begin
fStop := Lowest( Bar, #Low, 20 ) - 0.01;
SetRiskStopLevel( fStop );
bSetup := not BuyAtMarket( Bar + 1, '' );
end;
end;
end;
{$I 'Highlight Trades (Bottom)'}
--Robert Sucher
www.wealth-lab.com
AMIBROKER: THE TRUTH ABOUT VOLATILITY
In "The Truth About Volatility," Jim Berg presents how to use several well-known volatility measures such as average true range (ATR) to calculate entry, trailing stop, and profit-taking levels. Implementing techniques presented in the article is very simple using the AmiBroker Formula Language (Afl), and takes just a few lines of code.
Listing 1 shows the formula that the plots color-coded price chart, trailing stop, and profit-taking lines, as well as a colored ribbon showing volatility-based entry and exit signals. The relative strength index (RSI) used by Berg is a built-in indicator in AmiBroker, so no additional code is necessary. See Figure 3 for an example.
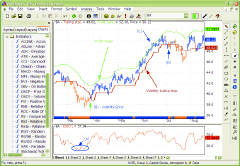
FIGURE 3: AMIBROKER, VOLATILITY SYSTEM. Here is a sample AmiBroker chart demonstrating the techniques from Jim Berg's article in this issue.
LISTING 1
EntrySignal = C > ( LLV( L, 20 ) + 2 * ATR( 10 ) );
ExitSignal = C < ( HHV( H, 20 ) - 2 * ATR( 10 ) );
Color = IIf( EntrySignal, colorBlue, IIf( ExitSignal, colorOrange,
colorGrey50 ));
TrailStop = HHV( C - 2 * ATR(10), 15 );
ProfitTaker = EMA( H, 13 ) + 2 * ATR(10);
/* plot price chart and stops */
Plot( TrailStop, "Trailing stop", colorBrown, styleThick | styleLine
);
Plot( ProfitTaker, "Profit taker", colorLime, styleThick );
Plot( C, "Price", Color, styleBar | styleThick );
/* plot color ribbon */
Plot( 1, "", Color, styleArea | styleOwnScale | styleNoLabel, -0.1,
50 );
--Tomasz Janeczko, AmiBroker.com
www.amibroker.com
GO BACK
eSIGNAL: THE TRUTH ABOUT VOLATILITY
For this month's article by Jim Berg, "The Truth About Volatility," we've provided the following three indicators as outlined in the sidebar: volatility entry advisor (Figure 4); volatility profit indicator (Figure 5); and volatility trailing stop P15 (Figure 6). All three studies have options to configure the study parameters, as well as the thickness of the indicator lines, via the Edit Studies option (Chart Options-->Edit Studies).
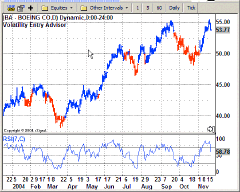
FIGURE 4: eSIGNAL, THE TRUTH ABOUT VOLATILITY. Here is a demonstration of the volatility entry advisor indicator in eSignal.
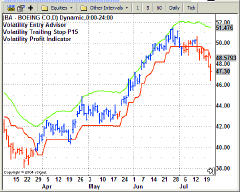
FIGURE 5: eSIGNAL, THE TRUTH ABOUT VOLATILITY. Here is a demonstration of the volatility profit indicator in eSignal.
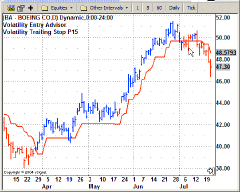
FIGURE 6: eSIGNAL, THE TRUTH ABOUT VOLATILITY. Here is a demonstration of the volatility trailing stop in eSignal.
The RSI study in the chart image for the Entry Advisor is applied
separately by selecting the study from Basic Studies under the Chart Options
menu.
To discuss these studies or download copies of the formulas, please visit the Efs Library Discussion Board forum under the Bulletin Boards link at www.esignalcentral.com.
Here is an implementation of the volatility entry advisor in eSignal:
/*****************************************************************
Provided By : eSignal (c) Copyright 2004
Description: Volatility Entry Advisor - by Jim Berg
Version 1.0
Notes:
February 2005 Issue - "The Truth About Volatility"
Formula Parameters: Defaults:
ATR Periods
10
LL and HH Periods 20
Thickness
2
*****************************************************************/
function preMain() {
setPriceStudy(true);
setStudyTitle("Volatility Entry Advisor ");
setCursorLabelName("Entry", 0);
setCursorLabelName("Exit", 1);
setDefaultBarThickness(2, 0);
setDefaultBarThickness(2, 1);
setDefaultBarFgColor(Color.green, 0);
setDefaultBarFgColor(Color.khaki, 1);
setColorPriceBars(true);
setDefaultPriceBarColor(Color.grey);
setShowTitleParameters(false);
// Formula Parameters
var fp1 = new FunctionParameter("nATRlen", FunctionParameter.NUMBER);
fp1.setName("ATR Periods");
fp1.setLowerLimit(1);
fp1.setDefault(10);
var fp2 = new FunctionParameter("nDonlen", FunctionParameter.NUMBER);
fp2.setName("LL and HH Periods");
fp2.setLowerLimit(1);
fp2.setDefault(20);
// Study Parameters
var sp1 = new FunctionParameter("nThick", FunctionParameter.NUMBER);
sp1.setName("Thickness");
sp1.setDefault(2);
}
var bEdit = true;
var vATR = null;
var vDonchian = null;
var vColor = Color.grey;
function main(nATRlen, nDonlen, nThick) {
if (bEdit == true) {
vATR = new ATRStudy(nATRlen);
vDonchian = new DonchianStudy(nDonlen, 0);
setDefaultBarThickness(nThick, 0);
setDefaultBarThickness(nThick, 1);
bEdit = false;
}
var nState = getBarState();
if (nState == BARSTATE_NEWBAR) {
}
var ATR = vATR.getValue(ATRStudy.ATR);
var HHV = vDonchian.getValue(DonchianStudy.UPPER);
var LLV = vDonchian.getValue(DonchianStudy.LOWER);
if (ATR == null || HHV == null || LLV == null) return;
var vEntryLine = LLV+(2*ATR);
var vExitLine = HHV-(2*ATR);
var c = close();
if (c > vEntryLine) {
vColor = Color.blue;
} else if (c < vExitLine) {
vColor = Color.red;
}
setPriceBarColor(vColor);
return;
//return new Array(vEntryLine, vExitLine);
}
/*****************************************************************
Provided By : eSignal (c) Copyright 2004
Description: Volatility Profit Indicator - by Jim Berg
Version 1.0
Notes:
February 2005 Issue - "The Truth About Volatility"
Formula Parameters:
Defaults:
ATR Periods
10
MA Periods
13
Thickness
2
*****************************************************************/
function preMain() {
setPriceStudy(true);
setStudyTitle("Volatility Profit Indicator ");
setCursorLabelName("VProfit", 0);
setDefaultBarThickness(2, 0);
setDefaultBarFgColor(Color.lime, 0);
setShowTitleParameters(false);
// Formula Parameters
var fp1 = new FunctionParameter("nATRlen", FunctionParameter.NUMBER);
fp1.setName("ATR Periods");
fp1.setLowerLimit(1);
fp1.setDefault(10);
var fp2 = new FunctionParameter("nMovlen", FunctionParameter.NUMBER);
fp2.setName("MA Periods");
fp2.setLowerLimit(1);
fp2.setDefault(13);
// Study Parameters
var sp1 = new FunctionParameter("nThick", FunctionParameter.NUMBER);
sp1.setName("Thickness");
sp1.setDefault(2);
}
var bEdit = true;
var vATR = null;
var vMA = null;
function main(nATRlen, nMovlen, nThick) {
if (bEdit == true) {
vATR = new ATRStudy(nATRlen);
vMA = new MAStudy(nMovlen,
0, "High", MAStudy.EXPONENTIAL);
setDefaultBarThickness(nThick,
0);
bEdit = false;
}
var nState = getBarState();
if (nState == BARSTATE_NEWBAR) {
}
var ATR = vATR.getValue(ATRStudy.ATR);
var MA = vMA.getValue(MAStudy.MA);
if (ATR == null || MA == null) return;
var vProfitLine = (MA + (2*ATR));
return vProfitLine;
}
/*****************************************************************
Provided By : eSignal (c) Copyright 2004
Description: Volatility Trailing Stop P15 - by Jim Berg
Version 1.0
Notes:
February 2005 Issue - "The Truth About Volatility"
Formula Parameters:
Defaults:
ATR Periods
10
Thickness
2
*****************************************************************/
function preMain() {
setPriceStudy(true);
setStudyTitle("Volatility Trailing Stop P15 ");
setCursorLabelName("VStop", 0);
setDefaultBarThickness(2, 0);
setDefaultBarFgColor(Color.red, 0);
setShowTitleParameters(false);
// Formula Parameters
var fp1 = new FunctionParameter("nATRlen", FunctionParameter.NUMBER);
fp1.setName("ATR Periods");
fp1.setLowerLimit(1);
fp1.setDefault(10);
// Study Parameters
var sp1 = new FunctionParameter("nThick", FunctionParameter.NUMBER);
sp1.setName("Thickness");
sp1.setDefault(2);
}
var bEdit = true;
var vATR = null;
var aStop = new Array(15);
function main(nATRlen, nThick) {
if (bEdit == true) {
vATR = new ATRStudy(nATRlen);
setDefaultBarThickness(nThick,
0);
bEdit = false;
}
var nState = getBarState();
if (nState == BARSTATE_NEWBAR) {
aStop.pop();
aStop.unshift(0);
}
var ATR = vATR.getValue(ATRStudy.ATR);
if (ATR == null) return;
var c = close();
var vStop = (c - (2*ATR));
aStop[0] = vStop;
var vStop15 = vStop;
for (var i = 0; i < 15; i++) {
vStop15 = Math.max(aStop[i],
vStop15);
}
return vStop15;
}
--Jason Keck
eSignal, a division of Interactive Data Corp.
800 815-8256, www.esignalcentral.com
NEUROSHELL TRADER: THE TRUTH ABOUT VOLATILITY
Jim Berg's volatility trading system can be easily implemented in NeuroShell Trader by combining a few of NeuroShell Trader's 800+ indicators.
To create the volatility trading system, select "New Trading Strategy ..." from the Insert menu and enter the following entry and exit conditions in the appropriate locations of the Trading Strategy Wizard:
Generate a buy long MARKET order if ALL of the following are true:
A>B ( Close, Add2 ( PriceLow ( Low, 20 ), Multiply ( 2, AverageTrueRange
( High, Low, Close, 10 ) ) )
Generate a sell short MARKET order if ONE of the following is true:
A<B ( Close, Subtract ( PriceHigh ( High, 20 ), Multiply ( 2, AverageTrueRange
(High, Low, Close, 10 ) ) )
A<B ( Max (Close,2), Max ( Subtract ( Close, Multiply ( 2, AverageTrueRange
(High, Low, Close, 10 ) ) ), 15 ) )
A>B ( Close, Add2 ( ExpAvg ( High, 13 ), Multiply ( 2, AverageTrueRange
(High, Low, Close, 10 ) ) ) )
If you have NeuroShell Trader Professional, you can also choose whether the system parameters should be optimized. After backtesting the trading strategy, use the "Detailed Analysis ..." button to view the backtest and trade-by-trade statistics for the volatility trading system.
Users of NeuroShell Trader can go to the Stocks & Commodities section of the NeuroShell Trader free technical support website to download a sample chart that includes the average true range (ATR) indicator used above and the volatility trading system.
--Marge Sherald, Ward Systems Group, Inc.
301 662-7950, sales@wardsystems.com
www.neuroshell.com
TRADINGSOLUTIONS: THE TRUTH ABOUT VOLATILITY
In his article on "The Truth About Volatility," Jim Berg outlines his methodology for trading using volatility indicators (see Figure 7).
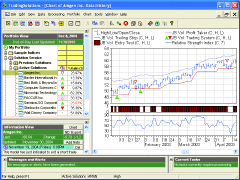
The individual indicators he uses in his chart studies can be entered in TradingSolutions as follows:FIGURE 7: TRADINGSOLUTIONS, VOLATILITY INDICATORS. Here is a sample TradingSolutions chart displaying the volatility trailing stop, volatility profit taker, and volatility entry test indicators with the price and RSI.
Name: JB Volatility Entry Line
Short Name: JBVEntryLine
Inputs: Close, High, Low
Formula:
Add (Lowest (Low, 20), Mult (2, ATR (Close, High, Low, 10)))
Name: JB Volatility Exit Line
Short Name: JBVExitLine
Inputs: Close, High, Low
Formula:
Sub (Highest (High, 20), Mult (2, ATR (Close, High, Low, 10)))
Name: JB Volatility Trailing Stop
Short Name: JBVTrailingStop
Inputs: Close, High, Low
Formula:
Highest (Sub (Close, Mult (2, ATR (Close, High, Low, 10))), 15)
Name: JB Volatility Profit Taker
Short Name: JBVProfitTaker
Inputs: Close, High, Low
Formula:
Add (EMA (High,13), Mult (2, ATR (Close, High, Low, 10)))
The colored bar study can be simulated by creating a field to test the entry condition and displays it as bars in its own subchart:
Name: JB Volatility Entry Test
Short Name: JBVEntryTest
Inputs: Close, High, Low
Formula:
GT (Close, JBVEntryLine (Close, High, Low))
While the system is primarily a chart study, the techniques described in the article can be approximated using an entry/exit system. Note that in the examples, Berg enters his trades when the entry test turns false.
Name: JB Volatility Trading System
Inputs: Close, High, Low
Entry Long (when all are true):
1. CrossBelow(Close, JBVEntryLine(Close, High, Low))
2. GE(Close, JBVExitLine(Close, High, Low)
3. GE(Highest(High, 20), Highest(High, 40))
4. GE(Lowest(Low, 20), Lowest(Low, 40))
5. GT(Close, MA(Close, 170))
6. Not(Dec(MA(Close, 170)))
7. LT(Lowest(RSI(Close, 7), 20), 30)
8. Not(System_IsLong( ))
Exit Long (when any are true):
1. LT(Close, JBVExitLine(Close, High, Low))
2. LT(Close, JBVTrailingStop(Close, High, Low))
3. GT(Close, JBVProfitTaker(Close, High, Low)
These functions are available in a function file that can be downloaded
from the TradingSolutions website (www.tradingsolutions.com) in the Solution
Library section. As with many indicators, these values can make good inputs
to neural network predictions.
--Gary Geniesse
NeuroDimension, Inc.
800 634-3327, 352 377-5144
https://www.tradingsolutions.com
NEOTICKER: THE TRUTH ABOUT VOLATILITY
The volatility entry, exit, trailing stop and profit-taking indicators, along with the bar highlight charts shown in the article, "The Truth About Volatility" written by Jim Berg, can be implemented in NeoTicker using formula language.
Rising trend chart
This chart uses the NeoTicker indicator "Color Plot Formula 2" to paint the bars that have the rising trend characteristic.
First, add a weekly data series. After the data series is loaded, add a moving average. These two will form the basis for highlight bars.
Add the "Color Plot Formula 2" indicator. At the indicator "Links" tab, choose weekly data as Link 1 and the 34-week moving average as Link 2. Next, copy and paste (from www.Traders.com or www.TickQuest.com) the comparison code shown in Listing 1 into the "Formula" field. Change the "Price High" field to "h" and "Price Low" field to "l." At the color selection dropdown, select Color 2 as "none" and Color 3 as "none." The resulting indicator will have all bars painted in a weekly Boeing chart with a rising trend (Figure 8).
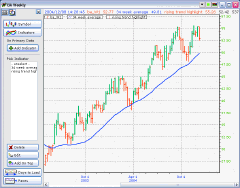
FIGURE 8: NEOTICKER, VOLATILITY INDICATORS. Here is a sample chart showing a rising trend chart.
Profit-taking and trailing stop chart
This chart uses the NeoTicker indicator "Formula" to plot the volatility trailing stop and volatility profit-taking indicator.
Add a weekly data series. Then add the volatility trailing stop by adding a "Formula" indicator on the data series. At the indicator "Plot" field, enter the code shown in Listing 2, and hit the Apply button to continue. Next, add the volatility profit-taking indicator by adding another "Formula" indicator; at the "Plot" field, enter the code shown in Listing 3. Hit the "Apply" button to add the indicator to the chart (Figure 9).
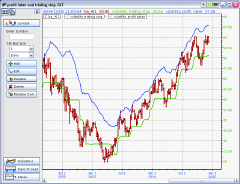
System codeFIGURE 9: NEOTICKER, VOLATILITY INDICATORS. Here is a sample NeoTicker profit-taking and trailing-stop chart.
The sys_vola has one integer parameter, the size to trade. This indicator (Listing 4) combines the volatility entry, exit, trailing stop, and profit-taking indicators into a complete trading system and plots the resulting equity curve.
Listing 1
(data1.high(0)>data1.high(1) and data1.low(0)>data1.low(1)) and
(data1.close(0)> data2.close(0)) and (data2.close(0)>data2.close(1))
Listing 2
hhv(c-(2*avgtruerange(0,data1,10)),15)
Listing 3
qc_xaverage(0,data1.H,13)+2*avgtruerange(data1,10)
Listing 4
longatmarket(c>(llv(l,20)+2*avgtruerange(c,10)), param1, "volatility
entry");
longexitatmarket(c<(hhv(h,20)-2*avgtruerange(c,10)), param1, "volatility
exit");
P15 := hhv(c-2*avgtruerange(c,10),15);
longexitstop(openpositionlong > 0 and
(openpositionbestpricelevel -
param2) >
openpositionaverageentryprice
and
c<P15 and c(1)<P15(1),
P15, param1, "Long Trail Stop");
$VolaProfit := qc_xaverage(c, 13)+ 2*avgtruerange(c, 10);
longexitatmarket(c > $VolaProfit, param1, "Porfit taking");
plot1 := currentequity;
A downloadable version of the system and indicators will be available
through the NeoTicker Yahoo! User Group and TickQuest websites.
--Kenneth Yuen, TickQuest Inc.
www.tickquest.com
AIQ: THE TRUTH ABOUT VOLATILITY
This Aiq code is based on Jim Berg's article in this issue, "The Truth About Volatility."
Figures 10 and 11 show samples of the JB volatility indicators.
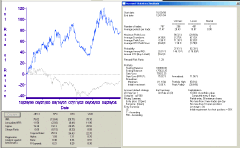
FIGURE 10: AIQ, JB VOLATILITY INDICATOR
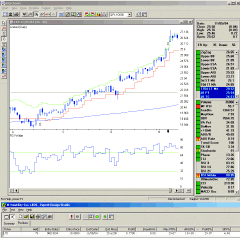
FIGURE 11: AIQ, JB VOLATILITY INDICATOR
! JB VOLATILITY INDICATORS & SYSTEM
! Author: Jim Berg, TASC Feb 2005
! Coded by: Richard Denning 12/9/04
!DEFINE PARAMETERS:
Define F1 10. !ATR average
Define A1 2. !Number of ATRs
Define W1 7. !RSI lookback
Define R1 30. !RSI oversold level
Define D1 5. !Lookback for oversold
Define P1 20. !Lowest low
Define P2 15. !Trailing stop
Define P3 13. !PT
!CODING ABREVIATIONS:
H is [high].
L is [low].
C is [close].
C1 is val([close],1).
!TRENDING INDICATORS
HH20 is highresult(H,20).
HH20x20 is highresult(H,20,20).
LL20 is lowresult(L,20).
LL20x20 is lowresult(L,20,20).
MA34w is simpleavg(C,34*5).
UpTrend if HH20 > HH20x20
and LL20 > LL20x20
and C > MA34w.
!AVERAGE TRUE RANGE
TR is Max(H-L,max(abs(C1-L),abs(C1-H))).
ATR is expAvg(TR,F1).
!WILDER'S RSI INDICATOR
U is C - C1.
D is C1 - C.
L3 is 2 * W1 - 1.
AvgU3 is ExpAvg(iff(U>0,U,0),L3).
AvgD3 is ExpAvg(iff(D>=0,D,0),L3).
RSI is 100-(100/(1+(AvgU3/AvgD3))).
!LONG ENTRY
OS if RSI < R1.
LE if C > lowresult(L,P1) + A1*ATR
and countof(OS,D1) >= 1
and UpTrend
and C<20 and C>1.
!LONG EXIT TRAILING STOP
TS is highresult(C - A1*ATR,P2).
LXTS if countof(C < TS,2) = 2.
!JB VOLATILITY PROFIT TAKER
PT is expavg(H,P3) + A1*ATR.
LXPT if C > PT.
!COMBINED LONG EXIT
LX if LXTS or LXPT.
--Richard Denning
www.aiq.com
