April 2003
TRADERS' TIPS
You can copy these formulas and programs for easy use in your spreadsheet or analysis software. Simply "select" the desired text by highlighting as you would in any word processing program, then use your standard key command for copy or choose "copy" from the browser menu. The copied text can then be "pasted" into any open spreadsheet or other software by selecting an insertion point and executing a paste command. By toggling back and forth between an application window and the open Web page, data can be transferred with ease.
This month's tips include formulas and programs for:
TRADESTATION: FINITE VOLUME ELEMENTS (FVE)
TRADESTATION: POSITIVE VOLUME INDEX (PVI) / NEGATIVE VOLUME INDEX (NVI)
AMIBROKER: FINITE VOLUME ELEMENTS (FVE)
AMIBROKER: POSITIVE VOLUME INDEX (PVI) / NEGATIVE VOLUME INDEX (NVI)
eSIGNAL: FINITE VOLUME ELEMENTS (FVE)
eSIGNAL: POSITIVE VOLUME INDEX (PVI) / NEGATIVE VOLUME INDEX (NVI)
Wealth-Lab: FINITE VOLUME ELEMENTS (FVE)
Wealth-Lab: POSITIVE VOLUME INDEX (PVI) / NEGATIVE VOLUME INDEX (NVI)
NEUROSHELL TRADER: FINITE VOLUME ELEMENTS (FVE)
NEUROSHELL TRADER: POSITIVE VOLUME INDEX (PVI) / NEGATIVE VOLUME INDEX (NVI)
NeoTicker: FINITE VOLUME ELEMENTS (FVE)
NeoTicker: POSITIVE VOLUME INDEX (PVI)
TradingSolutions: FINITE VOLUME ELEMENTS (FVE)
TradingSolutions: POSITIVE VOLUME INDEX (PVI) / NEGATIVE VOLUME INDEX (NVI)
AIQ EXPERT DESIGN STUDIO: FINITE VOLUME ELEMENTS (FVE)
TECHNIFILTER PLUS: FINITE VOLUME ELEMENTS (FVE)
TECHNIFILTER PLUS: POSITIVE VOLUME INDEX (PVI) / NEGATIVE VOLUME INDEX (NVI)
SMARTRADER: POSITIVE VOLUME INDEX (PVI)
WALL STREET ANALYZER: FINITE VOLUME ELEMENTS (FVE)
WALL STREET ANALYZER: POSITIVE VOLUME INDEX / NEGATIVE VOLUME INDEX
Financial Data Calculator: POSITIVE VOLUME INDEX / NEGATIVE VOLUME INDEX
Financial Data Calculator: FINITE VOLUME ELEMENTS (FVE)
METASTOCK: FINITE VOLUME ELEMENTS (FVE)
or return to April 2003 Contents
![]() TRADESTATION: FINITE VOLUME ELEMENTS (FVE)
TRADESTATION: FINITE VOLUME ELEMENTS (FVE)
Markos Katsanos' article "Detecting Breakouts"
describes the calculation and use of a price-volume indicator called the
finite volume element (FVE). Katsanos provides a detailed Excel spreadsheet
in the article, and I've used it to write the equivalent EasyLanguage
code for the Fve. We named this indicator "FiniteVolumeElement."
Indicator: FiniteVolumeElement
inputs:
 CutOff( .003 ),
 Samples( 22 );
variables:
 TP( 0 ),
 MF( 0 ),
 VolumePlusMinus( 0 ),
 FVEsum( 0 ),
 FveFactor( 0 ),
  FVE( 0 ) ;
TP = ( High  + Low  + Close ) / 3 ;
MF = ( Close - (High  + Low  ) / 2 )+ TP - TP[1] ;
if MF > CutOff * Close then
 FveFactor = 1
else if MF < -1 * CutOff * Close then
 FveFactor = -1
else
 FveFactor = 0 ;
if BarNumber > Samples then
 begin
 VolumePlusMinus = Volume * FveFactor ;
 FVEsum = Summation( VolumePlusMinus, Samples ) ;
 FVE = ( FVEsum / (Average( Volume, Samples)
  * samples ) ) * 100 ;
 Plot1( Average(FVE,1 ) ) ;
 end ;
Katsanos spends much of the article discussing divergence between
price and Fve trends. He defines these trends in terms of linear regression
slopes. The following indicator, "FinVolEleLinRegSl," plots
these two slopes (Figure 1). An input factor for the "PriceSlope"
has been added to allow the user to match the oscillation range of FVE
and price slopes.

FIGURE 1: TRADESTATION, FINITE VOLUME ELEMENTS. Here's a sample TradeStation chart demonstrating the finite volume elements indicator (FVE).
Indicator: FinVolEleLinRegSl
inputs:
 CutOff( .003 ),
 Samples( 22 ),
 PriceSlopeFactor( 30 ) ;
variables:
 TP( 0 ),
 MF( 0 ),
 VolumePlusMinus( 0  ),
 FVEsum( 0  ),
 FveFactor( 0  ),
  FVE( 0 ),
    FVESlope( 0 ),
 PriceSlope( 0 ) ;
TP = (High  + Low  + Close ) / 3 ;
MF = (Close - (High  + Low  ) / 2 )+ TP - TP[1] ;
if MF > CutOff * Close then
 FveFactor = 1
else if MF < -1 * CutOff * Close then
 FveFactor = -1
else
 FveFactor = 0 ;
if BarNumber > Samples then
 begin
 VolumePlusMinus = Volume  * FveFactor ;
 FVEsum = Summation( VolumePlusMinus, Samples ) ;
 FVE = ( FVEsum / (Average( Volume, Samples ) * samples ) ) * 100 ;
 FVESlope = LinearRegSlope(FVE , 35 ) ;
 PriceSlope = LinearRegSlope(close, 35 ) ;
 Plot1( FVESlope, "FVESlope" ) ;
 Plot2( PriceSlope * PriceSlopeFactor, "PriceSlope");
 Plot3( 0 ) ;
 end ;
Finally, Katsanos tests his Fve by basing a mechanical strategy
on it. The strategy can be tested in TradeStation with the EasyLanguage
strategy code named "FiniteVolEle."
Strategy: FiniteEleVol
inputs:
 CutOff( .003 ),
 Samples( 22 ) ;
variables:
 TP( 0 ),
 MF( 0 ),
 VolumePlusMinus( 0 ),
 FVEsum( 0 ),
 FveFactor( 0 ),
  FVE( 0 ) ;
TP = (High  + Low  + Close ) / 3 ;
MF = (Close - (High  + Low  ) / 2 )+ TP - TP[1] ;
if MF > CutOff * Close then
 FveFactor = 1
else if MF < -1 * CutOff * Close then
 FveFactor = -1
else
 FveFactor = 0 ;
if BarNumber > Samples then
 begin
 VolumePlusMinus = Volume * FveFactor ;
 FVEsum = Summation( VolumePlusMinus, Samples ) ;
 FVE = ( FVEsum / (Average( Volume, Samples ) * Samples ) ) * 100 ;
 Value1 = LinearRegSlope( FVE , 35 ) ;
 Value2 = LinearRegSlope( Close, 35 ) ;
 if FVE crosses over -5 and Value1 > 0
  and Value2 < 0
 then
  Buy Next Bar at Market ;
 if ( LinearRegSlope( FVE, 25) < 0 ) or
  ( DateToJulian( Date )
  - DateToJulian( EntryDate ) > 50*( 7 / 5 ) )
 then
  Sell Next bar at Market ;
 end ;
This indicator and strategy code will be available for download
from the EasyLanguage Exchange at TradeStationWorld.com. Look for the file
"FiniteElementVolume.eld."
-- Mark Mills, MarkM@TSSecGO BACK
EasyLanguage Specialist
TradeStation Securities
www.TradeStation.com, www.TradeStationWorld.com
![]() TRADESTATION: POSITIVE VOLUME INDEX (PVI) /
NEGATIVE VOLUME INDEX (NVI)
TRADESTATION: POSITIVE VOLUME INDEX (PVI) /
NEGATIVE VOLUME INDEX (NVI)
Dennis Peterson's article in this issue, "Positive Volume Index," describes the calculation and use of two indicators: the positive volume indicator (PVI) and the negative volume indicator (NVI). This indicator can be drawn on a TradeStation screen (Figure 2) by using the indicator code given here, "PVI-NVI."

FIGURE 2: TRADESTATION, POSITIVE VOLUME INDEX/NEGATIVE VOLUME INDEX. Here's a sample TradeStation chart displaying the PVI and NVI.
Indicator: PVI-NVI
inputs:
 PVIAvg( 12 ),
 NVIAvg( 12 ),
 PlotPVI( True ),
 PlotNVI( False ) ;
variables:
 PVI( 0 ),
 NVI( 0 ) ;
if Volume > Volume[1]  then
 PVI = PVI + ( Close - Close[1] ) / Close[1]
else
 NVI = NVI + ( Close - Close[1] ) / Close[1] ;
if PlotPVI then
 begin
 Plot1( PVI, "PVI" );
 Plot2( Average( PVI, PVIAvg ), "PVI Avg" ) ;
 end ;
if PlotNVI then
 begin
 Plot3( NVI, "NVI" );
 Plot4( Average( NVI, NVIAvg ), "NVI Avg" ) ;
 end ;
This code calculates the NVI and PVI as sums, which start with bar
1 and continuously add to it from that point until the end of the chart.
An alternative calculation process involves the use of a fixed-length data
window for each calculation. This style of calculation is more computationally
intensive, but provides a normalized result. The idea is demonstrated in
the indicator "PVI-NVI Fixed Len," the code for which follows.
Indicator: PVI-NVI Fixed Len
inputs:
 PVIWindow( 200 ),
 NVIWindow( 200 ),
 PVIAvg( 127 ),
 NVIAvg( 127 ),
 PlotPVI( True ),
 PlotNVI( False ) ;
variables:
 PVI( 0 ),
 NVI( 0 ),
 PartialPVI( 0 ),
 PartialNVI( 0 ) ;
if Volume > Volume[1]  then
 begin
 PartialPVI =  ( Close - Close[1] ) / Close[1] ;
 PartialNVI = 0 ;
 end
else
 begin
 PartialNVI = ( Close - Close[1] ) / Close[1]  ;
 PartialPVI = 0 ;
 end ;
PVI = Summation( PartialPVI, PVIWindow ) ;
NVI = Summation( PartialNVI, NVIWindow ) ;
if PlotPVI then
 begin
 Plot1(PVI,"PVI");
 Plot2(Average(PVI,PVIAvg), "PVI Avg" );
 end ;
if PlotNVI then
 begin
 Plot3( NVI, "NVI" );
 Plot4( Average( NVI, NVIAvg ), "NVI Avg" );
 end ;
This indicator code will be available for download from the EasyLanguage
Exchange at TradeStationWorld.com. Look for the file "PVI-NVI.eld."
-- Mark MillsGO BACK
EasyLanguage Specialist
TradeStation Securities, Inc.
MarkM@TSSec
www.TradeStation.com, www.TradeStationWorld.com
![]() AMIBROKER: FINITE VOLUME ELEMENTS (FVE)
AMIBROKER: FINITE VOLUME ELEMENTS (FVE)
In "Detecting Breakouts" in this issue, Markos Katsanos introduces a new money flow indicator called the FVE (finite volume elements) that combines volume with intra- and interday price action. The FVE calculations can be easily reproduced in AmiBroker using its native AFL language. It is also easy to implement an automatic trading system based on FVE and mathematical methods of determining divergence between price and FVE action presented in the article.
Listing 1 shows the code that plots the FVE (Figure 3) and implements a simple trading system for XMSR that uses the 35-day linear regression slope of FVE and price to determine the divergence (Figure 4).

FIGURE 3: AMIBROKER, FINITE VOLUME ELEMENTS. This AmiBroker chart shows a daily chart of Manugistics Group and replicates the chart presented in Katsanos' article in this issue. The bottom window shows price and FVE. The top window shows a 22-day FVE.
FIGURE 4: AMIBROKER, FINITE VOLUME ELEMENTS. This AmiBroker screenshot shows the results of a backtest of the FVE system on XM Satellite Radio [XMSR] using the same period as in Katsanos' article, 12/28/99?15/02/02. The top window shows a price chart with buy/sell arrows. The bottom window shows system equity (red) and buy-and-hold equity (blue).
LISTING 1
Period = 22;
// users of v4.25 or higher can use Param to adjust period in real time
// Period = Param("FVE period", 22, 10, 80, 1 );
MF = C - (H+L)/2 + Avg - Ref( Avg, -1 );
Vc = IIf( MF > 0.003 * C, V,
IIf( MF < -0.003 * C, -V, 0 ) );
FVE = Sum( Vc, Period )/MA( V, Period )/Period * 100;
Plot( FVE, "FVE", colorRed );
GraphXSpace = 3;
Buy = Cross( FVE, -5 ) AND
LinRegSlope( FVE, 35 ) > 0 AND
LinRegSlope( Close, 35 ) < 0;
Sell = LinRegSlope( FVE, 25 ) < 0 OR Ref( Buy, -50 );
A downloadable version of this formula is available from AmiBroker's
website.
--Tomasz Janeczko, AmiBroker.comGO BACK
www.amibroker.com
![]() AMIBROKER: POSITIVE VOLUME INDEX (PVI) / NEGATIVE
VOLUME INDEX (NVI)
AMIBROKER: POSITIVE VOLUME INDEX (PVI) / NEGATIVE
VOLUME INDEX (NVI)
In this issue, Dennis Peterson presents various methods of using PVI and NVI to determine market trends. Both PVI and NVI are available as built-in functions in AmiBroker and thus are easy to use in custom formulas.
Listing 1 presents code that plots PVI annotated with a 5% zigzag line to identify peaks and valleys (Figure 5).

FIGURE 5: AMIBROKER, POSITIVE VOLUME INDEX. This AmiBroker screenshot shows a Nasdaq composite daily price chart (top window) and PVI annotated with a 5% zigzag line (bottom window) and replicates the chart presented in Peterson's article in this issue.
LISTING 1
Plot( Zig( PVI(), 5 ), "Zig of PVI", colorBlack );
Plot( PVI(), "PVI", colorRed );
GraphXSpace=3;
A downloadable version of this formula is available from the
AmiBroker website.
--Tomasz Janeczko, AmiBroker.comGO BACK
www.amibroker.com
![]() eSIGNAL: FINITE VOLUME ELEMENTS (FVE)
eSIGNAL: FINITE VOLUME ELEMENTS (FVE)
This eSignal formula is based on "Detecting Breakouts" by Markos Katsanos in this issue.
/*******************************************************************
Description: This Indicator plots the Finite Volume Elements
Provided By: TS Support, LLC for eSignal
********************************************************************/
function preMain(){
    setStudyTitle("Finite Volume Elements");
    setCursorLabelName("FVI",0);
    setDefaultBarFgColor(Color.red,0);
}
var FVE = 0;
function main(Period){
 if(Period == null)
  Period = 22;
 var MF = 0, vlm = 0, Sum = 0;
 MF = close() - (high() + low()) / 2 + (high() + low()
  + close()) / 3 - (high(-1) + low(-1) + close(-1)) / 3;
 if(MF > .3 * close() / 100)
  vlm = volume();
 else if(MF < -.3 * close() / 100)
  vlm = - volume();
 else
  vlm = 0;
 for(i = - Period + 1; i <= 0; i++)
  Sum += volume(i);
 VolumeMA = Sum / Period;

 if(getBarState() == BARSTATE_NEWBAR)
  FVE += ((vlm / VolumeMA) / Period) * 100;

 return FVE;
}
A sample chart is in Figure 6.

FIGURE 6: eSIGNAL, FINITE VOLUME ELEMENTS. This eSignal chart displays the finite volume elements indicator (FVE).--eSignal, a division of Interactive Data Corp.
800 815-8256, www.esignal.com
![]() eSIGNAL: POSITIVE VOLUME INDEX (PVI) / NEGATIVE
VOLUME INDEX (NVI)
eSIGNAL: POSITIVE VOLUME INDEX (PVI) / NEGATIVE
VOLUME INDEX (NVI)
These two eSignal formulas are based on the article by Dennis Peterson in this issue. (See Figures 7 and 8.)

FIGURE 7: eSIGNAL, POSITIVE VOLUME INDEX. This eSignal chart displays the positive volume index (PVI).
FIGURE 8: eSIGNAL, NEGATIVE VOLUME INDEX. This eSignal chart displays the negative volume index (NVI).
/*******************************************************************
Description: This Indicator plots the Positive Volume Index
Provided By: TS Support, LLC for eSignal
********************************************************************/
function preMain(){
    setStudyTitle("Positive Volume Index");
    setCursorLabelName("PVI",0);
    setDefaultBarFgColor(Color.red,0);
    setCursorLabelName("EMA",1);
    setDefaultBarFgColor(Color.blue,1);
}
var PVI = 0;
var EMA_1 = 0;
function main(EMA_Len){
 if(EMA_Len == null)
  EMA_Len = 255;
 var K = 2 / (EMA_Len + 1);
 var ROC = 0;

 ROC = (close() - close(-1)) / close(-1);

 if(volume() > volume(-1) && getBarState() == BARSTATE_NEWBAR)
  PVI += ROC;

 EMA = K * PVI  + (1 - K) * EMA_1;
 if (getBarState() == BARSTATE_NEWBAR)
      EMA_1 = EMA;
 return new Array(PVI,EMA);
}
/*******************************************************************
Description: This Indicator plots the Negative Volume Index
Provided By: TS Support, LLC for eSignal
********************************************************************/
GO BACKfunction preMain(){ setStudyTitle("Negative Volume Index"); setCursorLabelName("NVI",0); setDefaultBarFgColor(Color.red,0); setCursorLabelName("EMA",1); setDefaultBarFgColor(Color.blue,1); } var NVI = 0; var EMA_1 = 0; function main(EMA_Len){ if(EMA_Len == null) EMA_Len = 255; var K = 2 / (EMA_Len + 1); var ROC = 0; ROC = (close() - close(-1)) / close(-1); if(volume() < volume(-1) && getBarState() == BARSTATE_NEWBAR) NVI += ROC; EMA = K * NVI + (1 - K) * EMA_1; if (getBarState() == BARSTATE_NEWBAR) EMA_1 = EMA; return new Array(NVI,EMA); }
--eSignal, a division of Interactive Data Corp.
800 815-8256, www.esignal.com
![]() WEALTH-LAB: FINITE VOLUME ELEMENTS (FVE)
WEALTH-LAB: FINITE VOLUME ELEMENTS (FVE)
The finite volume elements indicator (FVE) is available as a custom indicator for Wealth-Lab Developer.
To obtain new custom indicators, select "Community/Download ChartScripts" from the main menu. Any new trading systems, studies, or custom indicators will be downloaded and installed into the software automatically (Figure 9). After installing FVE, you can plot it and use it in trading system rules.

FIGURE 9: WEALTH-LAB, DOWNLOAD INDICATORS. Download new studies, indicators, and systems automatically through the "Community/Download ChartScripts" selection from the main menu. After installing Fve, you can plot it and use it in trading system rules.
Fve is an interesting indicator. Unlike most volume-based indicators,
it moves within a fixed range. Because of this you can create systems that
employ overbought/oversold strategies with FVE. The trading system included
here goes long using two weighted moving averages of FVE to trigger an
entry. FVE must have recently been lower than -30 (oversold). When this
condition is present, the crossover of the faster WMA over the slower WMA
pinpoints the entry. The system exits long positions when FVE crosses under
the fast WMA (Figure 10).
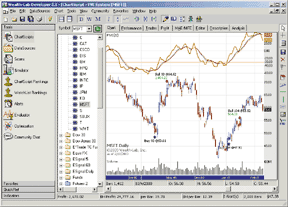
FIGURE 10: WEALTH-LAB, FVE SYSTEM. This trading system goes long using two weighted moving averages of FVE to trigger an entry. The system exits long positions when FVE crosses under the fast WMA.
{$I 'FVE'}
var  FVEPane, Bar, FVESer: integer;   { Plot Indicators  }
FVEPane := CreatePane( 100, true, true );
FVESer := FVESeries( 22  );
PlotSeries( FVESer, FVEPane, 641, #Thick );
DrawHorzLine( -30, FVEPane,  #Red, #Thin );
DrawLabel( 'FVE(22)', FVEPane  );
HidePaneLines;   { Create and plot  Weighted Moving Averages }
var S1, S2: integer;
S1 := WMASeries( FVESer,  10 );
S2 := WMASeries( FVESer, 12 );
PlotSeries( S1, FVEPane, #Black,  #Thin );
PlotSeries( S2, FVEPane, #Red, #Thin );   { System Rules  }
for Bar := 60 to BarCount - 1 do
begin
  if CrossOver( Bar, S1,  S2 ) then
    if Lowest( Bar, FVESer, 5 ) < -30  then
      BuyAtMarket( Bar + 1, '' );
  if  CrossUnder( Bar, FVESER, S1 ) then
    SellAtMarket( Bar + 1,  #All, '' );
end;
--Dion Kurczek, Wealth-Lab, Inc.
www.wealth-lab.com
![]() WEALTH-LAB: POSITIVE VOLUME INDEX (PVI) / NEGATIVE
VOLUME INDEX (NVI)
WEALTH-LAB: POSITIVE VOLUME INDEX (PVI) / NEGATIVE
VOLUME INDEX (NVI)
The Wealth-Lab script presented here is based on the PVI and NVI indicators described in Dennis Peterson's article in this issue, "Positive Volume Index."
You can run this script directly from our website, Wealth-Lab.com, and view charts of PVI and NVI for any US stock symbol. To locate the PVI/NVI script, click the "ChartScripts" menu item, followed by "Search." Search for scripts with "PVI" in the title. You can also use the script provided in our Wealth-Lab Developer desktop software.
The script creates the PVI and NVI indicators and their respective 255-bar
moving averages. It then performs a bar-by-bar analysis of the chart, and
colors the background of the PVI and NVI panes depending on whether the
indicators are bullish or bearish (Figure 11).
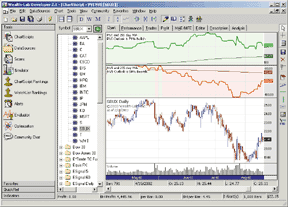
FIGURE 11: WEALTH-LAB, POSITIVE VOLUME INDEX/NEGATIVE VOLUME INDEX. This sample Wealth-Lab chart plots the PVI/NVI.
{ Declare Variables  }
var PP, NP, Bar, PVI, NVI: integer;
var PVIMA, NVIMA: integer;
var  RC: float;
{ Create PVI and NVI  Indicators }
PVI := CreateSeries;
NVI := CreateSeries;
for Bar := 1 to  BarCount - 1 do
begin
  RC := ROC( Bar, #Close, 1 );
   @PVI[Bar] := @PVI[Bar - 1];
  @NVI[Bar] := @NVI[Bar - 1];
  if  Volume( Bar ) > Volume( Bar - 1 ) then
    @PVI[Bar] :=  @PVI[Bar] + RC
  else
    @NVI[Bar] := @NVI[Bar] +  RC;
end;
{ Create Moving  Averages }
PVIMA := SMASeries( PVI, 255 );
NVIMA := SMASeries( NVI, 255  );
{ Plot Indicators  }
NP := CreatePane( 100, true, true );
PlotSeries( NVI, NP, #Red, #Thick  );
PlotSeries( NVIMA, NP, #Maroon, #Thin );
DrawLabel( 'NVI and 255 day  MA', NP );
PP := CreatePane( 100, true, true );
PlotSeries( PVI, PP,  #Green, #Thick );
PlotSeries( PVIMA, PP, 030, #Thin );
DrawLabel( 'PVI and  255 day MA', PP );
{ Perform bar by bar  analysis of trend }
for Bar := 256 to BarCount - 1 do
begin
  if  @PVI[Bar] > @PVIMA[Bar] then
  begin
     SetPaneBackgroundColor( Bar, PP, #GreenBkg );
    if Bar =  BarCount - 1 then
      DrawLabel( 'PVI Outlook is  79% Bullish', PP );
  end
  else
   begin
    SetPaneBackgroundColor( Bar, PP, #RedBkg  );
    if Bar = BarCount - 1  then
      DrawLabel( 'PVI Outlook is 67% Bearish',  PP );
  end;
  if @NVI[Bar] > @NVIMA[Bar] then
   begin
    SetPaneBackgroundColor( Bar, NP, #GreenBkg  );
    if Bar = BarCount - 1  then
      DrawLabel( 'NVI Outlook is 96% Bullish',  NP );
  end
  else
  begin
     SetPaneBackgroundColor( Bar, NP, #RedBkg );
    if Bar =  BarCount - 1 then
      DrawLabel( 'NVI Outlook is  50% Bearish', NP );
  end;
end;
--Dion Kurczek, Wealth-Lab, Inc.
www.wealth-lab.com
![]() NEUROSHELL TRADER: FINITE VOLUME ELEMENTS (FVE)
NEUROSHELL TRADER: FINITE VOLUME ELEMENTS (FVE)
To implement a trading system in NeuroShell Trader using the finite volume elements indicator described by Markos Katsanos in this issue, you should first create the FVE indicator in a chart and then create a NeuroShell Trading Strategy based on that indicator.
To recreate the finite volume elements indicator, select "New
Indicator ..." from the Insert menu and use the Indicator Wizard
to create each of the following variables:
TYPICAL:
 Avg3 (High, Low, Close)
MIDPOINT:
 Avg2 (High, Low)
MF:
 Add2 ( Sub (Close, MIDPOINT), Momentum (TYPICAL, 1) )
INEQUALITY:
 IfThenElseIfThen ( A>B ( MF, Mult (0.003, Close) ), Volume,
   A<B ( MF, Mult (-0.003, Close) ), Mult (Volume, -1), 0 )
FVE:
 Mult ( Divide ( Divide ( Sum (INEQUALITY, 22), MovAvg
   (Volume, 22) ), 22 ) , 100 )
To recreate the finite volume elements trading system, select "New
Trading Strategy..." from the Insert menu and enter the following
long entry and exit conditions in the appropriate locations of the Trading
Strategy Wizard:
Generate a buy long MARKET order if ALL of the following are true:
 CrossAbove ( FVE, -5 )
 A>B ( FVE, 0 )
 A<B ( TYPICAL, 0 )
Generate a sell long MARKET order if ONE of the following are true:
 A<B ( FVE, 0 )
 BarsSinceFill ( Trading Strategy, 50 )
If you have NeuroShell Trader Professional, you can also choose
whether the system parameters should be optimized. After backtesting the
trading strategy, use the "Detailed Analysis ..." button
to view the backtest and trade-by-trade statistics for the finite volume
elements system.
Users of NeuroShell Trader can go to the STOCKS & COMMODITIES section
of the NeuroShell Trader free technical support website to download a sample
chart (Figure 12) that includes the finite volume elements custom indicator
and finite volume elements trading system.
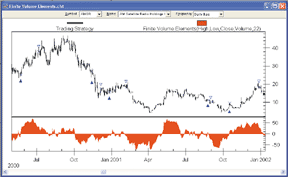
FIGURE 12: NEUROSHELL TRADER, FINITE VOLUME ELEMENTS (FVE). Here's a sample NeuroShell Trader chart demonstrating the finite volume elements (FVE) indicator.
--Marge Sherald, Ward Systems Group, Inc.
301 662-7950, sales@wardsystems.com
www.neuroshell.com
![]() NEUROSHELL TRADER: POSITIVE VOLUME INDEX (PVI)
/ NEGATIVE VOLUME INDEX (NVI)
NEUROSHELL TRADER: POSITIVE VOLUME INDEX (PVI)
/ NEGATIVE VOLUME INDEX (NVI)
The positive volume index and negative volume index discussed by Dennis Peterson in his article this issue can be easily implemented in NeuroShell Trader by combining two of the 800+ built-in indicators. Although the NeuroShell Trader program already includes both the positive volume index and negative volume index, those are based on a predefined window size instead of accumulating. Thus, all we have to do to get the same results as Peterson did in his article is combine our predefined versions with one of our powerful accumulating indicators:
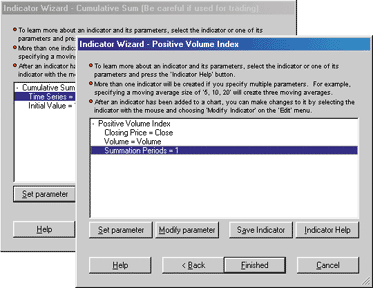
To insert the indicators (Figure 13):
1. Select "New Indicator ..." from the Insert menu.
2. Select the Basic category.
3. Select the Cumulative Sum indicator.
4. Set the Initial Value to 0 (zero).
5. Modify the Time Series parameter and select the Indicator button.
a. Select the Volume category.
b. Select the positive volume index and/or the negative volume index.
c. Set the Summation Periods to 1 (one).
d. Press the Finish button (on secondary Indicator Wizard).
6. Press the Finish button (on primary Indicator Wizard).
FIGURE 13: NEUROSHELL TRADER, INDICATOR WIZARD. Here's how to recreate the positive volume index using the NeuroShell Trader Indicator Wizard.
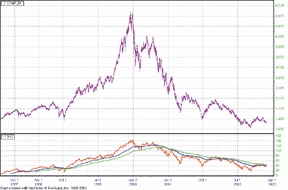
You have just created a multiple-level (two-level) indicator for
the positive/negative volume indicator. This is just an example of how
easy it is to create multiple-level indicators. Once on the chart, you
can also recreate simple moving averages of these indicators in lengths
of 127 and 255 as Peterson suggests (Figure 14). You can even create them
at the same time, or optimize them with NeuroShell Trader Pro or DayTrader
Pro.
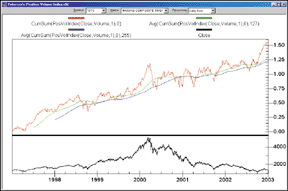
FIGURE 14: NEUROSHELL TRADER, POSITIVE VOLUME INDEX. Here's a sample NeuroShell Trader chart demonstrating the positive volume index with moving averages.
Users of NeuroShell Trader can go to the STOCKS & COMMODITIES
section of the NeuroShell Trader free technical support website for more
information on any Trader's Tip. The chart we built for this tip
can be downloaded there.
For more information on NeuroShell Trader, visit www.NeuroShell.com.
--Marge Sherald, Ward Systems Group, Inc.GO BACK
301 662-7950, sales@wardsystems.com
www.neuroshell.com
![]() NEOTICKER: FINITE VOLUME ELEMENTS (FVE)
NEOTICKER: FINITE VOLUME ELEMENTS (FVE)
To implement in NeoTicker the concept presented in the article "Detecting
Breakouts" by Markos Katsanos, first create an indicator called
"finite volume elements" (Listing 1) with one integer parameter
Period.
LISTING 1
mycount := mycount +1;
myTypical := (C+H+L)/3;
MF := C-(H+L)/2+myTypical-myTypical(1);
myFVE := summation(if(MF > 0.3*c/100, v, if(MF < -0.3*c/100, -v, 0)), param1)/
         average(v, param1)/param1*100;
plot1 := myFVE;
success1 := if (mycount > param1, 1, 0);
Then use NeoTicker's built-in indicator Backtest EZ to perform
the sample backtest on the FVE system as described in the article.
First, load the XMSR daily data onto a chart. Extend the data load length to 1,500 days to load six years of data. Next, add the indicator BackTest EZ through the Add Indicator window (Figure 15).
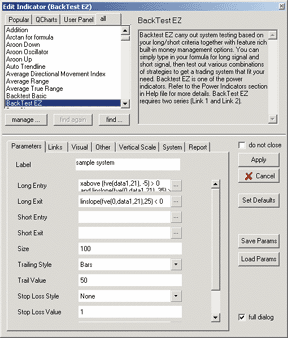
FIGURE 15: NEOTICKER, BACKTESTING THE FVE. Use the Add Indicator window to open the BackTest EZ indicator. You can use this to aid in backtesting the FVE system.
At the Long Entry field, clear out the default formula and replace
it with the following entry condition formula (Listing 2):
LISTING 2
xabove(fve(data1,21), -5) > 0 and linslope(fve(0,data1,21), 35) > 0 and
linslope(data1,35) < 0
At the Long Exit field, set the Condition formula (Listing 3) to
Exit when the 25-day Fve linear regression slopes down.
LISTING 3
linslope(fve(0,data1,21),25) < 0
Because there are no short trades in this example, clear out the
Short Entry field. Then change the Trailing Style to "Bar"
and Trail Value to 50. This will stop out the trade 50 days from the buy
signal. Hit the Apply button and the result will be an equity curve of
the system (Figure 16).
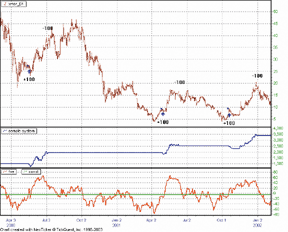
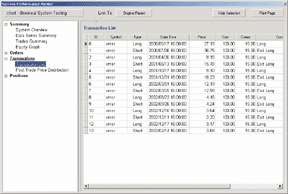
FIGURE 16: NEOTICKER, FVE SYSTEM EQUITY CURVE. You can plot an equity curve of the FVE system and use money management stops by changing the Trailing Style to "Bar" and Trail Value to 50. This will stop out the trade 50 days from the buy signal.You can use NeoTicker's built-in system performance viewer to review the orders, transactions, and summary of the trading system. To do so, right-click on the trading system equity curve, select Trading System> Open Performance Viewer from the popup menu. Click on the Trades Summary in the performance viewer to show the system summary (Figure 17). To see a listing of the transactions (Figure 18), choose the Transactions item.
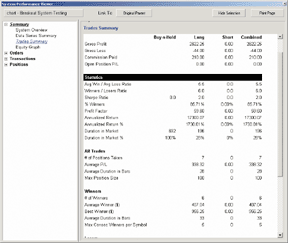
FIGURE 17: NEOTICKER, FVE SYSTEM RESULTS. You can use NeoTicker's built-in system performance viewer to review the orders, transactions, and summary of the trading system.A downloadable version of this indicator is available from the Yahoo! NeoTicker user group file area at https://groups.yahoo.com/group/neoticker/.
FIGURE 18: NEOTICKER, FVE SYSTEM TRANSACTIONS. To see a listing of your transactions, choose the Transactions menu item.
--Kenneth Yuen, TickQuest Inc.
www.tickquest.com
![]() NEOTICKER: POSITIVE VOLUME INDEX (PVI)
NEOTICKER: POSITIVE VOLUME INDEX (PVI)
To implement in NeoTicker the idea presented in "Positive Volume
Index" by Dennis Peterson in this issue, you can use formula language
to easily recreate the positive volume index (Listing 1) and negative volume
index (Listing 2), with three parameters: lengths, short smoothing, and
long smoothing, and three plots: the index line, short smoothing line,
and long smoothing line.
LISTING 1
mycount := mycount +1;
myPVI := myPVI + if(v >= v(param1), ROC(data1, param1), 0);plot1 := myPVI;
plot2 := qc_xaverage( myPVI, param2);
plot3 := qc_xaverage( myPVI, param3);success2 := if (mycount > param2, 1, 0);
success3 := if (mycount > param3, 1, 0);LISTING 2
mycount := mycount +1;
myNVI := myNVI + if(v < v(param1), ROC(data1, param1), 0);plot1 := myNVI;
plot2 := qc_xaverage(myNVI, param2);
plot3 := qc_xaverage(myNVI, param3);success2 := if (mycount > param2, 1, 0);
success3 := if (mycount > param3, 1, 0);
The positive volume index will show the rate of change accumulation
for the up volume days (Figure 19) with the two moving averages. The negative
volume index will show the rate of change accumulation for the down volume
days (Figure 20) with the two moving averages.
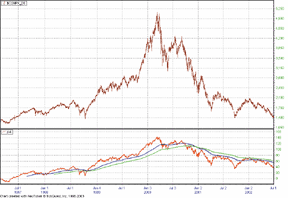
FIGURE 19: NEOTICKER, POSITIVE VOLUME INDEX. The positive volume index will show the rate of change accumulation for the up volume days with the two moving averages.
FIGURE 20: NEOTICKER, NEGATIVE VOLUME INDEX. The negative volume index will show the rate of change accumulation for the down volume days with the two moving averages.
Then find the peaks and valleys by applying the zigzag indicator
on the positive or negative volume index. For example, to construct the
chart for positive volume index (Figure 21), first add the positive volume
index to the chart. Right-click on the PVI legend on the upper left-hand
side of the pane. Select "Add Indicator" from the popup menu;
this will default the "new indicator" source to the first
plot of PVI. Select "zigzag" from the Add Indicator window,
change the Type to "Point," then press "Apply."
This will add the zigzag on the positive volume index.
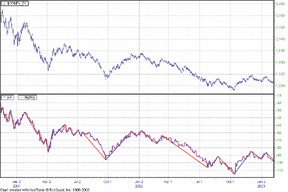
FIGURE 21: NEOTICKER, PVI AND ZIGZAG. Find the peaks and valleys by applying the zigzag indicator on the positive or negative volume index.
A downloadable version of the indicators is available from the Yahoo!
NeoTicker user group file area at https://groups.yahoo.com/group/neoticker/.
--Kenneth Yuen, TickQuest Inc.
www.tickquest.com
![]() TRADINGSOLUTIONS: FINITE VOLUME ELEMENTS (FVE)
TRADINGSOLUTIONS: FINITE VOLUME ELEMENTS (FVE)
In his article "Detecting Breakouts," Markos Katsanos presents the finite volume elements indicator for calculating money flow, taking into account both intraday and interday price action.
The formula for the finite volume elements (FVE) indicator can be expressed
in TradingSolutions as follows:
FVE Money Flow
Name: MF
Inputs: Close, High, Low
Add (Sub (Close, MP (High, Low)),Change (Typical (Close, High, Low),1))
Finite Volume Elements
Name: FVE
Inputs: Close, High, Low, Volume, Period
Mult (Div (Div (Sum (If (GT (MF (Close, High, Low), Mult (Close, 0.003)),
 Volume, If (LT (MF (Close, High, Low), Mult (Close, -0.003)),
 Negate (Volume),0)), Period), MA (Volume, Period)), Period),100)
This function is available in a function file that can be
downloaded from the TradingSolutions website in the Solution Library section.
As with many indicators, functions such as the FVE can make good
inputs to neural network predictions. If used directly, you will want to
set the preprocessing to "None" since the value stays within
a specific range, or "Change" if the momentum of the indicator
is desired. (See Figure 22.)
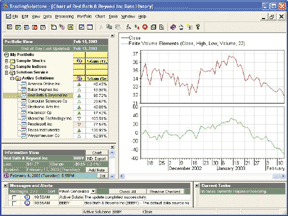
FIGURE 22: TRADINGSOLUTIONS, FINITE VOLUME ELEMENTS (FVE). This sample TradingSolutions chart displays the finite volume elements indicator.
--Gary Geniesse, NeuroDimension, Inc.
800 634-3327, 352 377-5144
www.tradingsolutions.com
![]() TRADINGSOLUTIONS: POSITIVE VOLUME INDEX (PVI)
/ NEGATIVE VOLUME INDEX (NVI)
TRADINGSOLUTIONS: POSITIVE VOLUME INDEX (PVI)
/ NEGATIVE VOLUME INDEX (NVI)
In his article "Positive Volume Index" in this issue, Dennis Peterson reviews the positive and negative volume indexes. These functions are included with TradingSolutions in the "Market Trend Indicators" function group.
The positive and negative volume indexes can make good inputs to neural
network predictions, especially when compared to their long-term moving
averages. To do this, use the "Difference from moving average"
function or the "Percent difference from moving average"
function. Then, use preprocessing set to "None," since the
value stays fairly well bounded.
--Gary Geniesse, NeuroDimension, Inc.GO BACK
800 634-3327, 352 377-5144
www.tradingsolutions.com
![]() AIQ EXPERT DESIGN STUDIO: FINITE VOLUME ELEMENTS
(FVE)
AIQ EXPERT DESIGN STUDIO: FINITE VOLUME ELEMENTS
(FVE)
Here is the code for AIQ's Expert Design Studio based on Markos Katsanos' "Detecting Breakouts." (See Figure 23.)
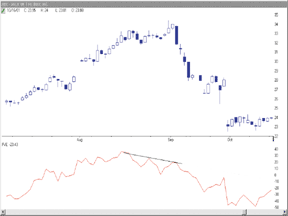
FIGURE 23: AIQ, FINITE VOLUME ELEMENTS (FVE). Here is a sample AIQ chart of the finite volume elements (FVE) indicator.
!!!!  Stocks & Commodities  April 2003  -  Detecting Breakouts - FVE - Markos Katsanos
C is [close].
H is [high].
L is [low].
V is [volume].
Vneg is -[volume].
AvgVolume is simpleavg([volume], 22).
Typical is (H+L+C) / 3.
Typicalone is valresult(typical, 1).
Inequality is C - (H + L) /2 + Typical - Typicalone.
Greaterthan03 if inequality > (0.3 * C )/ 100.
Lessthan03 if inequality < (0.3 * C) / 100.
Volumeplus is iff(greaterthan03, v, vneg).
Volumenegative is iff(lessthan03, vneg, 0).
sum is sum(volumeplus, 21).
FVE is ((sum / avgvolume) / 21) * 100.
--Mike Kaden
Aiq Systems, www.aiq.com
![]() TECHNIFILTER PLUS: FINITE VOLUME ELEMENTS (FVE)
TECHNIFILTER PLUS: FINITE VOLUME ELEMENTS (FVE)
Several articles in this issue discuss volume indicators. Here is a
TechniFilter Plus formula that will display the finite volume elements
(FVE) indicator discussed in Markos Katsanos' article, "Detecting
Breakouts."
Finite Volume Elements
NAME: FVE
SWITCHES: multiline
PARAMETERS: 10
FORMULA:
[1]: (H+L+C) / 3    {typical price}
[2]: C - (H+L)/2 + [1] - [1]Y1  {MF}
[3]: (([2] - 0.3*C/100)U1 * V)F&1 / VA&1 / &1 * 100
Visit Rtr's website at https://www.rtrsoftware.com to download
these formulas as well as program updates.
--Clay Burch, RTR Software
919 510-0608, rtrsoft@aol.com
www.rtrsoftware.com
![]() TECHNIFILTER PLUS: POSITIVE VOLUME INDEX (PVI)
/ NEGATIVE VOLUME INDEX (NVI)
TECHNIFILTER PLUS: POSITIVE VOLUME INDEX (PVI)
/ NEGATIVE VOLUME INDEX (NVI)
Dennis Peterson discusses both the positive and negative volume indicators in his article this issue. TechniFilter Plus provides the building blocks to compute these indicators (J for PVI and B for NVI).
--Clay Burch, RTR SoftwareGO BACK
919 510-0608, rtrsoft@aol.com
www.rtrsoftware.com
![]() SMARTRADER: POSITIVE VOLUME INDEX (PVI)
SMARTRADER: POSITIVE VOLUME INDEX (PVI)
In Dennis Peterson's article "Positive Volume Index," we learn how important volume is in technical analysis. This particular technique requires that your data include good volume data, for obvious reasons.
In SmarTrader, we first added a formula to calculate the price rate of change, priceRoc, in row 8. (The SmarTrader specsheet is shown in Figure 24.) In row 9, Gain, we added an "if" statement to test for day-to-day increasing volume. When volume is increasing, gain will return the value of priceRoc. When volume is not increasing, gain will be zero.
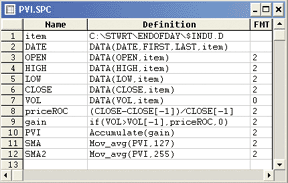
FIGURE 24: SMARTRADER, PVI SPECSHEET. Here's a SmarTrader specsheet for calculating the positive volume index.
In row 10, PVI, we use the Accumulate function to sum the value
of gain. Rows 11 and 12 are simple moving averages of PVI for 127 and 255
days, respectively.
A sample chart of the PVI is shown in Figure 25.
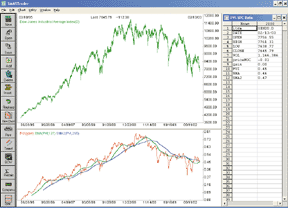
FIGURE 25: SMARTRADER, POSITIVE VOLUME INDEX. Here's a sample SmarTrader chart plotting the PVI.
--Jim Ritter, Stratagem Software
504 885-7353, Stratagem1@aol.com
![]() WALL STREET ANALYZER: FINITE VOLUME ELEMENTS
(FVE)
WALL STREET ANALYZER: FINITE VOLUME ELEMENTS
(FVE)
In his article this month, Markos Katsanos discusses the finite volume
elements (FVE). Here is the code to enter in the Indicator Builder to reproduce
this indicator.
'FVE
Sub Main()
  Period = 22
  MF = Divide(Add(GetHigh, GetLow), 2)
  MF = Substract(GetClose, MF)
  TypPrice = Divide(Add(Add(GetHigh, GetLow), GetClose), 3)
  For I = 2 to Last
    MF(I) = MF(I) + TypPrice(I) ? TypPrice(I ? 1)
  Next
  For I = Period + 1 to Last
    SumVol = 0
    For J = I ? Period + 1 to I
      If MF(J) > (0.3 * Close(J) / 100) then
        SumVol = SumVol + Volume(J)
      ElseIf MF(J) < (-0.3 * Close(J) / 100) then
        SumVol = SumVol ? Volume(J)
      End If
    Next
    SetValue I, SumVol
  Next
End Sub
--Frederic D. Collin, Wall Street Analyzer
www.Lathuy.com
![]() WALL STREET ANALYZER: POSITIVE VOLUME INDEX
/ NEGATIVE VOLUME INDEX
WALL STREET ANALYZER: POSITIVE VOLUME INDEX
/ NEGATIVE VOLUME INDEX
The positive volume index and negative volume index are both built-in
indicators in Wall Street Analyzer. To compute a moving average of the
PVI or NVI, enter this code:
'NVI MA
'You can change the period to your needed settings
Sub Main()
  Period = 125
  SetIndic(SMA(GetIndic("Positive Volume Index"), Period))
End Sub
To compute a moving average for the negative volume index,
just replace "positive volume index" with "negative
volume index."
--Frederic D. Collin, Wall Street Analyzer
www.Lathuy.com
![]() FINANCIAL DATA CALCULATOR: POSITIVE VOLUME
INDEX / NEGATIVE VOLUME INDEX
FINANCIAL DATA CALCULATOR: POSITIVE VOLUME
INDEX / NEGATIVE VOLUME INDEX
The positive volume index and its alternative, negative volume index,
can be easily recreated as macros in Financial Data Calculator. In the
Macro Wizard, for the PVI simply enter:
@ Positive Value Index
A: pos sign change volume #R
B: (change cl #R)/((cl #R) back 1)
cumsum (A*B)
Then name the macro "PVI" and use it in any
expression, such as "PVI spx," or smoothed versions, such
as "12 movave PVI spx" or "macd PVI spx."
For the NVI, simply create a new macro and name it "NVI."
The code is as follows:
@ Negative Value Index
A: neg sign change volume #R
B: (change cl #R)/((cl #R) back 1)
cumsum (A*B)
Note that the #R in the macro description refers to the right
argument or the target dataset.
--William RafterGO BACK
Futures Software Associates, Inc.
www.futures-software.com
![]() FINANCIAL DATA CALCULATOR: FINITE VOLUME ELEMENTS
(FVE)
FINANCIAL DATA CALCULATOR: FINITE VOLUME ELEMENTS
(FVE)
The finite volume index can be easily created as a macro in Financial
Data Calculator. In the Macro Wizard, for the FVI, simply enter:
@ Finite Volume Index
@ Needs #L input of the number of days - default suggested is 22
C: close #R
H: high #R
L: low #R
V: vol #R
typ: (H + L + C)/3
mid: (H+L)/2
mf: (C - mid) + change typ
ind: (mf>.003*C)-(mf<-.003*C)
100*(#L movsum V*ind)/(#L movsum V)
Then name the macro "fvi" and use it in any
expression, such as "22 fvi qqq," or smoothed versions, such
as "10 movave 22 fvi qqq."
Note that the #R in the macro description refers to the right
argument or the target dataset, whereas the #L refers to the number of
days or bars. The left argument (#L) is not required to be a fixed number
(such as the recommended default of 22), but can itself be a dataset, enabling
the finite volume index to be adaptive.
--William RafterGO BACK
Futures Software Associates, Inc.
www.futures-software.com
![]() METASTOCK: FINITE VOLUME ELEMENTS (FVE)
METASTOCK: FINITE VOLUME ELEMENTS (FVE)
Markos Katsanos' article "Detecting Breakouts"
includes the MetaStock formula for the finite volume elements (FVE) indicator.
However, Katsanos lists six methods of detecting a divergence between the
FVE and price. Three of those were formula-based. As no actual buy or sell
signals were included, these are provided as indicators only.
Linear Regression Slope method
Name: FVE ? Lin Reg Slope
Formula:
pds:=Input("period for FVE",10,80,22);
pds1:=Input("period for regression line",5,100,35);
mf:=C-(H+L)/2+Typical()-Ref(Typical(),-1);
fve:=Sum(If(mf>0.3*C/100,+V, If(mf<-0.3*C/100, -V,0)),pds)/Mov(V,pds,S)/pds*100;
If(LinRegSlope(fve,pds1)>0,1,-1)-
If(LinRegSlope(C,pds1)>0,1,-1);
This formula plots a 2 when the FVE slope is positive and price
slope is negative, and plots a -2 when the FVE slope is negative while
price slope is positive. At all other times, it plots a zero (Figure 26).
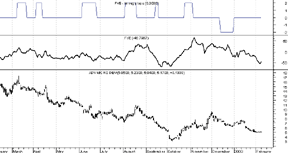
FIGURE 26: METASTOCK, FINITE VOLUME ELEMENTS. In the linear regression slope method of detecting divergences between the FVE and price, a 2 is plotted when the FVE slope is positive and price slope is negative. A -2 is plotted when the FVE slope is negative while price slope is positive. At all other times, it plots a zero.
%B method
Name: FVE - %B
Formula:
pds:=Input("period for FVE",10,80,22);
pds1:=Input("periods for bollinger bands",10,80,20);
mf:=C-(H+L)/2+Typical()-Ref(Typical(),-1);
fve:=Sum(If(mf>0.3*C/100,+V, If(mf<-0.3*C/100, -V,0)),pds)/Mov(V,pds,S)/pds*100;
bbfve:=(fve-BBandBot(fve,pds1,S,2))/(BBandTop(fve,pds1,S,2)-BBandBot(fve,pds1,S,2));
bbc:=(C-BBandBot(C,pds1,S,2))/(BBandTop(C,pds1,S,2)-BBandBot(C,pds1,S,2));
bbfve-bbc
No buy or sell conditions were included with this method. The results
of the indicator will be similar to the chart in Figure 27.
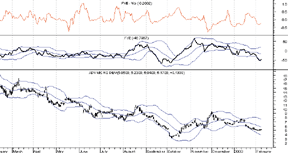
FIGURE 27: METASTOCK, FINITE VOLUME ELEMENTS. Here are sample results of using the %B method to detect divergences between the FVE and price, as described in Katsanos' article this issue.
Storz's Divergence method
Name: FVE - Storz's divergence
Formula:
pds:=Input("period for FVE",10,80,22);
z:=Input("zig zag percent",1,80,5);
r:=Input("bars used to normalize data",10,500,125);
mf:=C-(H+L)/2+Typical()-Ref(Typical(),-1);
fve:=Sum(If(mf>0.3*C/100,+V, If(mf<-0.3*C/100, -V,0)),pds)/Mov(V,pds,S)/pds*100;
dfve:=(Peak(1,fve,z)-Peak(2,fve,z))/
(HHV(fve,r)-LLV(fve,r));
dc:=(Peak(1,C,z)-Peak(2,C,z))/
(HHV(C,r)-LLV(C,r));
dfve-dc
Again, no buy or sell conditions were included with this method.
The results of the indicator will be similar to the chart in Figure 28.
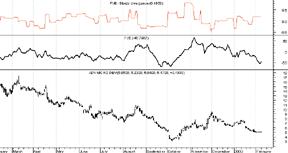
FIGURE 28: METASTOCK, FINITE VOLUME ELEMENTS. Here are sample results of using Storz' method to detect divergences between the FVE and price.
The article also described a system test using the linear regression
slope method. The coding for the test is different for MetaStock 8.0 than
for earlier versions. MetaStock 8.0's formulas would be:
METASTOCK 8.0
Buy Order
Formula:
pds:=22;
pds1:=35;
mf:=C-(H+L)/2+Typical()-Ref(Typical(),-1);
fve:=Sum(If(mf>0.3*C/100,+V, If(mf<-0.3*C/100, -V,0)),pds)/Mov(V,pds,S)/pds*100;
((If(LinRegSlope(fve,pds1)>0,1,-1)-
If(LinRegSlope(C,pds1)>0,1,-1))>0) and cross(fve,-5)
Sell Order
Formula:
pds:=22;
pds1:=25;
mf:=C-(H+L)/2+Typical()-Ref(Typical(),-1);
fve:=Sum(If(mf>0.3*C/100,+V, If(mf<-0.3*C/100, -V,0)),pds)/Mov(V,pds,S)/pds*100;
LinRegSlope(fve,pds1)>0 OR
Simulation.CurrentPositionAge>=50
For all other versions of MetaStock, the formulas would be:
GO BACKEnter Long Formula: pds:=22; pds1:=35; mf:=C-(H+L)/2+Typical()-Ref(Typical(),-1); fve:=Sum(If(mf>0.3*C/100,+V, If(mf<-0.3*C/100, -V,0)),pds)/Mov(V,pds,S)/pds*100; ((If(LinRegSlope(fve,pds1)>0,1,-1)- If(LinRegSlope(C,pds1)>0,1,-1))>0) and cross(fve,-5) Close Long Formula: pds:=22; pds1:=25; mf:=C-(H+L)/2+Typical()-Ref(Typical(),-1); fve:=Sum(If(mf>0.3*C/100,+V, If(mf<-0.3*C/100, -V,0)),pds)/Mov(V,pds,S)/pds*100; LinRegSlope(fve,pds1)>0 Stops Inactivity Stop Longs Method: percent Minimum Change: 10000 Periods: 50--William Golson
Equis International, www.equis.com
All rights reserved. © Copyright 2003, Technical Analysis, Inc.
Return to April 2003 Contents


