November 2001
TRADERS' TIPS
Here is this month's selection of Traders' Tips, contributed by various
developers of technical analysis software to help readers more easily implement
some of the strategies presented in this issue. You can copy these formulas and programs for easy use in your spreadsheet or analysis software. Simply "select" the desired text by highlighting as you would in any word processing program, then use your standard key command for copy or choose "copy" from the browser menu. The copied text can then be "pasted" into any open spreadsheet or other software by selecting an insertion point and executing a paste command. By toggling back and forth between an application window and the open Web page, data can be transferred with ease.
This month's tips include formulas and programs for:
NEUROSHELL TRADER WEALTH-LAB METASTOCK
or return to November 2001 Contents
![]() NEUROSHELL TRADER
NEUROSHELL TRADER
Hans Uhlig's nearest neighbor prediction (NNP) trading system presented in his article in this issue works by finding near neighbors of the reference pattern, and then averaging the next moves of the neighbors to get an estimate of the next move of the reference pattern. In the article, under the heading "Refinements," Uhlig outlines a method of improving the performance, wherein each neighbor is weighted in proportion to its distance. A further refinement he describes would be to apply different weights to individual elements of the pattern.
Here's how to implement the NNP in NeuroShell Trader. Ward Systems offers an add-on for NeuroShell Trader called Adaptive Net Indicators (ANI). This add-on was designed to do exactly the near neighbor prediction as described by Uhlig, including both refinements. This will save you from having to do the spreadsheet manipulations that Uhlig calls "laborious and time-intensive." The ANI add-on will not only make a prediction of a coming move, but it is also capable of classifying patterns as well (for example, buy or don't buy, sell or don't sell).

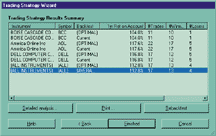
FIGURE 1: NeuroShell Trader, Nearest Neighbor Prediction. Here are the results of optimizing a weekly chart using the Adaptive Net Indicator in NeuroShell Trader for long and short signals.
Adaptive Net Indicators will work with any type of pattern information, not just previous price values. You can choose almost anything for your patterns, including stochastics, moving averages, or any of hundreds of other indicators. You can choose your own "lookback" period (the amount of history to include), or allow the genetic algorithm optimizer in our professional versions to find the lookback period that makes the most profit at the same time it finds the best indicators and indicator parameters.
The ANI add-on also allows the user control over the distance proportional weighting. As Uhlig described, the weighting should be higher for close neighbors and less for distant neighbors. The ANI not only does this automatically, but it also lets you specify how quickly the weighting drops off for distant neighbors.
Each item of your pattern can in fact have a different rate at which weighting drops off as distance increases, which in effect specifies the "importance" of each element in your pattern, whether the item be a past price as in Uhlig's article, or an indicator. Alternatively, you can let our genetic algorithm optimizer find these importance factors so that you will have an idea of which elements of the pattern are most effective for prediction and making a profit.
To insert the Adaptive Net Indicator:
1. Select Insert - New Indicator
2. Select the category called "Adaptive Net Indicators"
3. Select one or more of the several ANI available based upon how many pattern elements you desire to use.
NeuroShell Trader Professional and DayTrader Professional have other
add-ons that do processing very similar to Npp. The Cluster Indicators
find clusters of near neighbors that precede a buy or sell opportunity.
The Fuzzy Pattern Recognizer shows you whether a pattern is a near neighbor
of one that you are allowed to specify yourself.
For more information on NeuroShell Trader, visit www.NeuroShell.com. Users of NeuroShell Trader can go to the STOCKS & COMMODITIES section of the NeuroShell Trader free technical support website to download the sample chart that gave the results shown in Figure 1.
- Marge Sherald, Ward Systems Group, Inc.GO BACK
301 662-7950, sales@wardsystems.com
https://www.neuroshell.com
![]() WEALTH-LAB
WEALTH-LAB
After reading a copy of Hans Uhlig's article on nearest neighbor prediction in this issue, I thought about how best to utilize Wealth-Lab to help in the analysis. It's always important to use the right tool for the job, and Uhlig's methods rely heavily on spreadsheet-based sorting and other manipulations. I decided that it made the most sense to perform the bulk of the process within the spreadsheet, as Uhlig illustrates, but here, I use Wealth-Lab Desktop's file access functions to help in the analysis.
The first script simply writes the contents of any Wealth-Lab Desktop DataSource to an external comma-separated file. I set the scale to weekly in the program before executing the script. Now, clicking on any symbol in your list will create the weekly data file that you can open in your spreadsheet software (I used Excel).
OutFile := FileCreate( "C:\Temp\NN1.csv' );
for Bar := BarCount - 1 downto 0 do
begin
 c := PriceClose( Bar );
 l := LN( c );
 dt := GetDate( Bar );
 s := DateToStr( dt ) + ",' + FloatToStr( c ) + ",' + FloatToStr( l );
 FileWrite( OutFile, s );
end;
I decided to output the natural logarithm of closing price in the
script itself, but you could have also calculated this within the spreadsheet.
After reading the file into Excel, I continued with the steps of the nearest neighbor analysis. This consisted of replicating the spreadsheet manipulations that are described in the article, including sorting the data to find the nearest neighbors.
Once I had the spreadsheet at this level, I saved it back as the comma-separated file Nn2.Csv. I then wrote the following script to read the file into Wealth-Lab Desktop and annotate the bars of nearest neighbors 1 through 5 on the chart:
InFile := FileOpen( "C:\Temp\NN2.csv' );
{ Skip the first line, this is our current bar }
s := FileRead( InFile );
{ Now, Read the first 5 nearest neighbors and highlight them on the chart } SetBarColors( #Black, #Black ); for i := 1 to 5 do begin s := FileRead( InFile ); sToken := GetToken( s, 0, ",' ); dt := StrToDate( sToken ); n := DateToBar( dt ); SetBarColor( n, #Red ); AnnotateBar( "NN " + IntToStr( i ), n, false, #Black, 8 ); end;
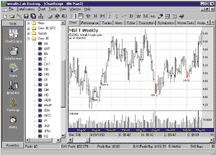
I tested the script on Microsoft weekly data. It so happened that
four of the five nearest neighbors occurred in the period of 1992 through
1994 (see Figure 2). There was a substantial up move after each of these
bars.

FIGURE 2: Wealth-Lab, Nearest Neighbor. Here is an example of Hans Uhlig's nearest neighbor prediction trading system as implemented in Wealth-Lab. In this example, the Wealth-Lab script was tested on Microsoft weekly data. The results show that four of the five nearest neighbors occurred in the period of 1992 through 1994. There was a substantial up move after each of these bars.
It'll be interesting to see if Microsoft prices move higher in the coming weeks, as this analysis suggests they might. [Editor's note: This was written before the week of September 10.]
-Dion Kurczek, Ceo
Wealth-Lab, Inc.
https://www.wealth-lab.com
![]() METASTOCK
METASTOCK
Here is the MetaStock formula for the trend detection index, which was presented in the October 2001 Stocks & Commodities by M.H. Pee:
x:=Input("number of periods", 5,50,20);
am:= Abs(C-Ref(C,-(x-1)));
td:= Sum(C-Ref(C,-(x-1)),x);
tdi:= (Abs(td)+Sum(am,x))-Sum(am,(2*x));
status:= If(tdi>0, If(td>0,1,-1), PREV);
tdi; td; status*LastValue(Highest(Max(Abs(tdi),Abs(td))))-Cheryl C. Abram, Equis International, Inc.
https://www.equis.com
-NeuroShell Trader (Ward Systems Group), -Wealth-Lab.com (Wealth-Lab.com), -MetaStock (Equis International)
All rights reserved. © Copyright 2001, Technical Analysis, Inc.
Return to November 2001 Contents