June 1999
TRADERS' TIPS 

Here is this month's selection of Traders' Tips, contributed by various developers of technical analysis software to help readers more easily implement some of the strategies presented in this issue.

You can copy these formulas and programs for easy use in your spreadsheet or analysis software. Simply "select" the desired text by highlighting as you would in any word processing program, then use your standard key command for copy or choose "copy" from the browser menu. The copied text can then be "pasted" into any open spreadsheet or other software by selecting an insertion point and executing a paste command. By toggling back and forth between an application window and the open Web page, data can be transferred with ease.

This month's tips include formulas and programs for:

METASTOCK 1
METASTOCK 2
TRADESTATION/SUPERCHARTS
WINDOW ON WALLSTREET
NEUROSHELL TRADER
TECHNIFILTER PLUS
SMARTTRADER
WAVE WI$E SPREADSHEET

or return to June 1999 Contents


METASTOCK

In the May 1998 issue of STOCKS & COMMODITIES, a Traders' Tip provided MetaStock formulas for calculating support and resistance levels and the WRO and WSO support and resistance oscillators. The Traders' Tip was based on my article, "Automated Support And Resistance," also in that issue. Since then, I've received many E-mail messages from STOCKS & COMMODITIES readers about it.

While the method was well received, the formulas provided were a bit confusing and could use some clarification. Further, execution was slow and screening of large numbers of stocks was difficult. Since then, I have developed a faster and improved method for computing these indicators.

To begin, the support levels S1 through S6 and the resistance levels R1 through R6 are separate indicators (12 in all), and each should be entered using the custom indicator option in the indicator builder.


S1 Indicator:
ValueWhen(1, Ref(L,-4) = LLV(L,9), Ref(L,-4))

S2 Indicator:
ValueWhen(2, Ref(L,-4) = LLV(L,9), Ref(L,-4))

S3 Indicator:
ValueWhen(3, Ref(L,-4) = LLV(L,9), Ref(L,-4))

S4 Indicator:
ValueWhen(4, Ref(L,-4) = LLV(L,9), Ref(L,-4))

S5 Indicator:
ValueWhen(5, Ref(L,-4) = LLV(L,9), Ref(L,-4))

S6 Indicator:
ValueWhen(6, Ref(L,-4) = LLV(L,9), Ref(L,-4))

R1 Indicator:
ValueWhen(1, Ref(H,-4) = HHV(H,9), Ref(H,-4))

R2 Indicator:
ValueWhen(2, Ref(H,-4) = HHV(H,9), Ref(H,-4))

R3 Indicator:
ValueWhen(3, Ref(H,-4) = HHV(H,9), Ref(H,-4))

R4 Indicator:
ValueWhen(4, Ref(H,-4) = HHV(H,9), Ref(H,-4))

R5 Indicator:
ValueWhen(5, Ref(H,-4) = HHV(H,9), Ref(H,-4))

R6 Indicator:
ValueWhen(6, Ref(H,-4) = HHV(H,9), Ref(H,-4))


These 12 indicators should be individually plotted with the price data as points, not lines (click on each and change the style to the one on the bottom of the style menu). The color red is recommended for the support levels S1 through S6 and the color blue for the resistance levels R1 through R6. Entering these formulas and changing the style takes a bit of time, but once done, they can be saved as a template and easily applied to another stock.

If you are interested only in computing the WRO and WSO indicators, then these formulas can be entered as shown here. It is not necessary to compute S1 through S6 or R1 through R6, since the new formulas are now self-contained. The new WRO and WSO formulas also contain max and min functions to ensure that the change for each level is either zero or 1. This avoids a rare but occasional error when the price change is very large over a short period.


WSO Indicator:
L1:=ValueWhen(1,Ref(L,-4)=LLV(L,9),Ref(L,-4));
L2:=ValueWhen(2,Ref(L,-4)=LLV(L,9),Ref(L,-4));
L3:=ValueWhen(3,Ref(L,-4)=LLV(L,9),Ref(L,-4));
L4:=ValueWhen(4,Ref(L,-4)=LLV(L,9),Ref(L,-4));
L5:=ValueWhen(5,Ref(L,-4)=LLV(L,9),Ref(L,-4));
L6:=ValueWhen(6,Ref(L,-4)=LLV(L,9),Ref(L,-4));
L1M:= Max(0,Min(1,Int(L1/C)));
L2M:= Max(0,Min(1,Int(L2/C)));
L3M:= Max(0,Min(1,Int(L3/C)));
L4M:= Max(0,Min(1,Int(L4/C)));
L5M:= Max(0,Min(1,Int(L5/C)));
L6M:= Max(0,Min(1,Int(L6/C))); 
100*(1-(L1M+L2M+L3M+L4M+L5M+L6M)/6)

WRO Indicator:
L1:=ValueWhen(1,Ref(H,-4)=HHV(H,9),Ref(H,-4));
L2:=ValueWhen(2,Ref(H,-4)=HHV(H,9),Ref(H,-4));
L3:=ValueWhen(3,Ref(H,-4)=HHV(H,9),Ref(H,-4));
L4:=ValueWhen(4,Ref(H,-4)=HHV(H,9),Ref(H,-4));
L5:=ValueWhen(5,Ref(H,-4)=HHV(H,9),Ref(H,-4));
L6:=ValueWhen(6,Ref(H,-4)=HHV(H,9),Ref(H,-4));
L1M:= Max(0,Min(1,Int(L1/C)));
L2M:= Max(0,Min(1,Int(L2/C)));
L3M:= Max(0,Min(1,Int(L3/C)));
L4M:= Max(0,Min(1,Int(L4/C)));
L5M:= Max(0,Min(1,Int(L5/C)));
L6M:= Max(0,Min(1,Int(L6/C))); 
100*(1-(L1M+L2M+L3M+L4M+L5M+L6M)/6)
The WRO and WSO oscillators are generally plotted together on a separate scale from the price plot. It is helpful to add horizontal lines at zero and 100 on this same scale. Horizontal lines can be added by clicking on the indicator and selecting "horizontal lines" from the Indicator Properties menu.

These formulas run much faster (by 40 times) than the earlier formulas, and theyÕve been tested successfully with both end-of-day data and real-time data using MetaStock Professional Version 6.51.

-- Mel Widner, Ph.D., 703 791-5910


E-mail techstrategies@msn.com

GO BACK


METASTOCK

"How Smooth Is Your Data Smoother?" by Patrick E. Lafferty in this issue reviews different types of moving averages, including a sine-weighted moving average. The sine-weighted moving average can easily be created in MetaStock 6.5 or higher. In MetaStock, select Indicator Builder from the Tools menu. In the indicator builder, click New and enter the following formulas:
 

Name: Sine-Weighted Moving Average
Formula:
PI:=3.1415926;
SD:=180/6;
S1:=Sin(1*180/6)*C;
S2:=Sin(2*180/6)*Ref(C,-1);
S3:=Sin(3*180/6)*Ref(C,-2);
S4:=Sin(4*180/6)*Ref(C,-3);
S5:=Sin(5*180/6)*Ref(C,-4);
Num:=S1+S2+S3+S4+S5;
Den:=Sin(SD)+Sin(2*SD)+Sin(3*SD)+Sin(4*SD)+Sin(5*SD);
Num/Den


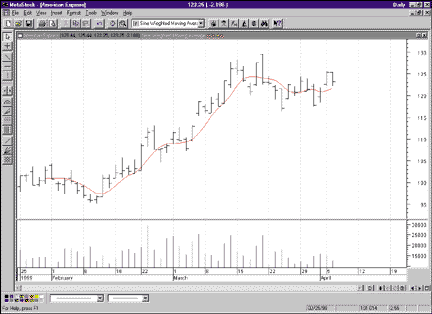
Next, click OK and close out of the Indicator Builder. Open a chart and plot the new formula by dragging it from the Indicator QuickList or by using Indicators from the Insert menu. Figure 1 shows a MetaStock chart with the sine-weighted moving average.

FIGURE 1: METASTOCK. Here's a sine-weighted moving average plotted in MetaStock.
 
-- Cheryl Elton, Equis International


https://www.equis.com

GO BACK


TRADERSTATION / SUPERCHARTS

Patrick Lafferty's article ÒHow Smooth Is Your Data Smoother?Ó uses the sine calculation to create a smoothed moving average. The basis of the sine-weighted moving average is calculated using the sine function in EasyLanguage.

Please note that the radians angle assumption in Excel does not apply to EasyLanguage, so no adjustment is necessary. The sine-weighted moving average calculation was created as a function so that it would be more versatile than if it were integrated in the indicator.

The function can be created in the PowerEditor using the following EasyLanguage:


Name: SWMA
Type: Function

Inputs: Length(Numeric);
Variables: Numerator(0), Denominator(0), Factor(180/6), SWMA(0);

Numerator = 0;
Denominator = 0;

For value1 = 1 To Length Begin
Numerator = Numerator + Sine(value1 * Factor) * 
Close[Length - value1];
        Denominator = Denominator + Sine(value1 * Factor);
End;

If Denominator <> 0 Then
        SWMA = Numerator / Denominator;


Once the function has been created in the PowerEditor, the indicator would simply be made up of two lines:


Name: Mov Avg Sine-Weightd
Type: Indicator

Inputs: Length(5);
Plot1(SWMA(Length), "Sine-Wghtd");
This EasyLanguage code is also available from Omega ResearchÕs Website. The name of the file is SWMA.ELS. Note that all TradersÕ Tips posted at the Omega Research Website can be utilized by both TradeStation and SuperCharts. When possible, the posted analysis techniques will include both QuickEditor and PowerEditor formats.
-- Gaston Sanchez, Omega Research Inc.


800 422-8587, 305 270-1095
Internet: https://www.omegaresearch.com

GO BACK

WINDOW ON WALLSTREET

Here's the formula for implementing the sine-weighted moving average in Window on WallStreet products.
 

Sine-Weighted Moving Average 
Name: Sine Weighted Moving Average
Description: From the article "How Smooth Is Your Data Smoother" by Patrick E. Lafferty..
Variables: none

Formula(s):
(.5 * c + .866* ref(c,-1) + 1* ref(c,-2) + .866 * ref(c,-3) +.5 * ref(c,-4) )/3.732


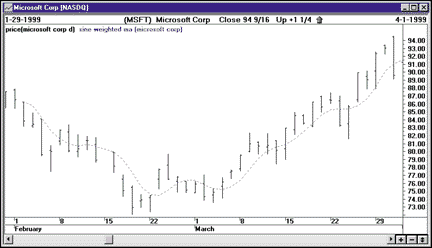
Figure 2 shows the sine-weighted moving average plotted in a Window on WallStreet chart.


FIGURE 2: WINDOW ON WALLSTREET. Here's the sine-weighted moving average in Window On WallStreet.
-- Andrew Laska


Window On WallStreet, Inc.
800 998-8439
wowinfo@wallstreet.net

GO BACK

NEUROSHELL TRADER

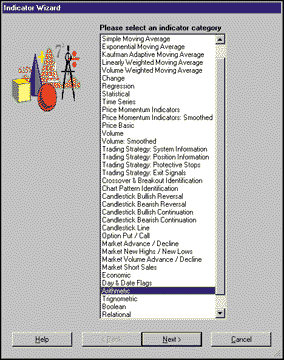
To implement the five-point sine-weighted moving average discussed in Patrick Lafferty's article in this issue, "How Smooth Is Your Data Smoother?" using NeuroShell Trader, begin by inserting a divide indicator from the Indicator Wizard. In the numerator of the divide indicator, sum up the following indicators from the arithmetic, trigonometric, and basic indicator categories (Figure 3):

Multiply( Sin-degrees(30), Close )
Multiply( Sin-degrees (60), Lag(Close,1) )
Multiply( Sin-degrees (90), Lag(Close,2) )
Multiply( Sin-degrees (120), Lag(Close,3) )
Multiply( Sin-degrees (150), Lag(Close,4) )

For the denominator of the divide indicator, sum up the following indicators from the trigonometric category:

Sin-degrees(30)
Sin-degrees (60)
Sin-degrees (90)
Sin-degrees (120)
Sin-degrees (150)

Alternatively, you may use the constant 3.73 for the denominator (which is the sum of the above sine indicators).
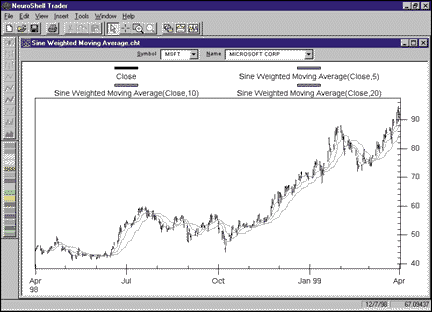
Users of NeuroShell Trader can go to the STOCKS & COMMODITIES section of the NeuroShell Trader technical support Website to download both the five-point SWMA chart (Figure 4) and a variable-point SWMA indicator, which allows the number of points to be specified as a parameter.

FIGURES 3: NEUROSHELL TRADER. To implement the sine-weighted moving average in NeuroShell Trader, begin by using the Indicator Wizard to insert the divide indicator from the arithmetic category.

FIGURES 4: NEUROSHELL TRADER. Here's a chart demonstrating the sine-weighted moving average as implemented in NeuroShell Trader.
-- Marge Sherald, Ward Systems Group, Inc.


301 662-7950
E-mail wardsystems@msn.com
https://www.neuroshell.com

GO BACK

TECHNIFILTER PLUS

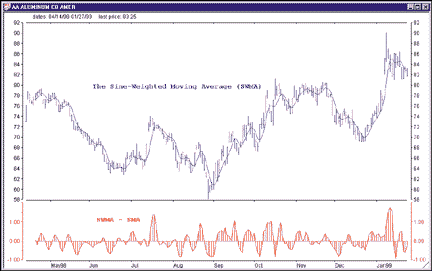
TechniFilter Plus has a modifier (U11) that returns the sine of a value (where the value is in radians). Here's a TechniFilter Plus formula that computes the sine-weighted moving average (SWMA) using weights of sin(n P/6), where n = 1, 2, 3, 4, 5. In Figure 5 is a bar chart of Aluminum Company of America [AA], showing the SWMA overlaid with an oscillator chart of the difference between the SWMA and a five-day simple moving average underneath.

FIGURE 5: TECHNIFILTER PLUS. Here's a TechniFilter Plus chart of Aluminum Co. America showing the sine-weighted moving average (SWMA) and an oscillator of difference between the SWMA and a five-day simple moving average.

SWMA Formula
NAME: swma
SWITCHES: multiline 
FORMULA: 
[1]: 3.14159/6 {pi/6}
[2]: [1]U11+(2*[1])U11+(3*[1])U11+(4*[1])U11+(5*[1])U11
[3]: [1]U11*C+(2*[1])U11*CY1+(3*[1])U11*CY2+(4*[1])U11*CY3+(5*[1])U11*CY4
[4]: [3]/[2]


These formulas and program updates can be downloaded from RTRÕs Website. Release 8.2 is now available.
 

-- Clay Burch, RTR Software


919 510-0608, E-mail rtrsoft@aol.com
https://www.rtrsoftware.com

GO BACK

SMARTRADER

The sine-weighted moving average presented in this issue by Patrick Lafferty is easily implemented using a combination of user calculations and the preprogrammed sine function in SmarTrader.

Since the sine-weighted calculations are duplicated in the numerator and denominator, we elected to shorten the code by calculating the weight values and the sines of those values independently. This greatly simplifies the denominator calculation.

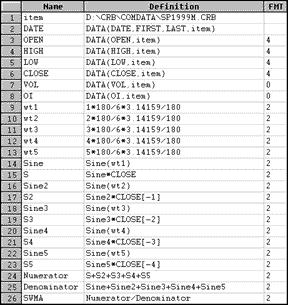
Rows 9 through 13 are user formulas to calculate the weight values. Row 14 uses the sine function to get the sine of the first weight value. Row 15 multiplies the closing price by the weight value, yielding S. This process is repeated in rows 16 through 22 for the remaining weight values.

Row 24 is a user row that sums the sine-weighted Close prices, giving the numerator. Row 25 is the sum of the sine weight values, giving the denominator.

Row 26, SWMA, is a user calculation where the numerator is divided by the denominator, yielding the sine-weighted moving average.

CompuTrac SNAP users can use this system by eliminating the minus (-) sign in the square brackets


FIGURE 6: SMARTRADER. This SmarTrader specsheet shows the formulas to implement the sine-weighted moving average in SmarTrader using a combination of calculations and the preprogrammed sine function in SmarTrader.
-- Jim Ritter, Stratagem Software International


504 885-7353, E-mail Stratagem1@aol.com
https://www.stratagem1.com

GO BACK

WAVE WI$E MARKET SPREADSHEET

The following Wave Wi$e formulas implement the sine-weighted moving average described in the article "How Smooth Is Your Data Smoother?" in this issue. The procedure demonstrates the use of the @For-Next loop to perform the summation of the formulaÕs numerator and denominator components for each day in the lookback period. The @Return statement returns the sine-weighted moving average.
 

A: DATE @TC2000(C:\TC2000\DATA,MSFT,MICROSOFT CP,D)
B: CLOSE 
C: Proc PROCEDURE(SINAVG)

'PROCEDURE SINAVE - SINE MOVING AVERAGE
#NAME PERIOD 5
#NAME DAY       X$1
#NAME NUMER X$2
#NAME DENOM X$3
NUMER=0                 'INITIALIZE SUM
DENOM=0                 'INITIALIZE SUM
@FOR DAY = 1 TO PERIOD  'LOOP THRU LOOKBACK
        NUMER=NUMER+(@SIN(DAY*180/6*@PI()/180))*CLOSE[-PERIOD+DAY]
        DENOM=DENOM+@SIN(DAY*180/6*@PI()/180)
NEXT
@RETURN(NUMER/DENOM)    'RETURN THE RATIO

 ==========End Formulas
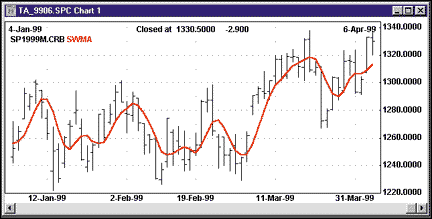
FIGURE 7: SMARTRADER. The sine-weighted moving average is produced on this SmarTrader chart from the specsheet shown in Figure 6.
-- Peter Di Girolamo, Jerome Technology


908 369-7503, E-mail jtiware@aol.com
https://members.aol.com/jtiware

GO BACK


Excerpted from an article originally published in the June 1999 issue of Technical Analysis of STOCKS & COMMODITIES magazine. All rights reserved. © Copyright 1999, Technical Analysis, Inc.

Return to June 1999 Contents