March 1999
TRADERS' TIPS
Here is this month's selection of Traders' Tips, contributed by various developers of technical analysis software to help readers more easily implement some of the strategies presented in this issue.
You can copy these formulas and programs for easy use in your spreadsheet or analysis software. Simply "select" the desired text by highlighting as you would in any word processing program, then use your standard key command for copy or choose "copy" from the browser menu. The copied text can then be "pasted" into any open spreadsheet or other software by selecting an insertion point and executing a paste command. By toggling back and forth between an application window and the open Web page, data can be transferred with ease.
This month's tips include formulas and programs for:
 TRADESTATION/SUPERCHARTS
 TECHNIFILTER PLUS
 WAVE WI$E MARKET SPREADSHEET
 SMARTTRADER
 NEUROSHELL TRADER
or return to March 1999 Contents
 TRADESTATION / SUPERCHARTS
In "Trading Stocks With A Cyclical System" in this issue, Jeffrey Owen Katz and Donna McCormick introduce a system based on stock cycles. In MetaStock 6.5 or higher, you can easily recreate this system.
With MetaStock running, choose System Tester from the Tools menu, click on the New button and enter the following formulas:
Name: StochCustom
Type: Function
Inputs: KPeriods(NumericSimple), KSlow(NumericSimple);
Variables: LoLo(0), HiHi(0), HLDIff(0);
LoLo = Lowest(Low, KPeriods);
HiHi = Highest(High, KPeriods);
HLDIff = HiHi - LoLo;

If HLDIff > 0 Then Begin
        If KSlow <= 1 Then
                StochasticCustom = (Close - LoLo) / HLDIff * 100
        Else
                StochasticCustom = Average(Close-LoLo,KSlow) / Average(HLDIff, KSlow)*100;
End;
Once the function has been created, we can then create the indicator and the system. For both, the KPeriods input determines length of the %K; the DPeriods input determines the length of the %D; and the KSlow input determines the smoothing factor for the %K line. The indicator can be created in the Power Editor using the EasyLanguage shown below:
Name: Stochastic S&C
Type: Indicator
Input: KPeriods(5), DPeriods(12), KSlow(3);
Variables: KVal(0), DVal(0);
KVal = StochasticCustom(KPeriods, KSlow);
DVal = Average(KVal, DPeriods);

If CurrentBar > KPeriods Then
        Plot1(KVal, "%K");
If CurrentBar > DPeriods Then
        Plot2(DVal, "%D");
The EasyLanguage for the system consists of finding a SwingLow for in the %K during an uptrend in the %D for a buy signal, or finding a SwingHigh in the %K during a downtrend in the %D for a sell signal. The exit for both the long and short side occurs after the period specified by the ExitBars input. After creating the system and applying it to a chart, you can then add money-management stops, from which the system would undoubtedly benefit.
Name: Stochastic S&C
Type: System
Input: KPeriods(7), DPeriods(12), KSlow(3), ExitBars(5);
Variables: KVal(0), DVal(0);
KVal = StochasticCustom(KPeriods, KSlow);
DVal = Average(KVal, DPeriods);
Condition1 = DVal > DVal[1] AND DVal[1] > DVal[2];
Condition2 = DVal < DVal[1] AND DVal[1] < DVal[2];

If Condition1 AND SwingLow(1, KVal, 1, 2) <> -1 Then
        Buy This Bar on Close;
If Condition2 AND SwingHigh(1, KVal, 1, 2) <> -1 Then
        Sell This Bar on Close;

If MarketPosition = 1 AND BarsSinceEntry = ExitBars Then
        ExitLong This Bar on Close;
If MarketPosition = -1 AND BarsSinceEntry = ExitBars Then
        ExitShort This Bar on Close;
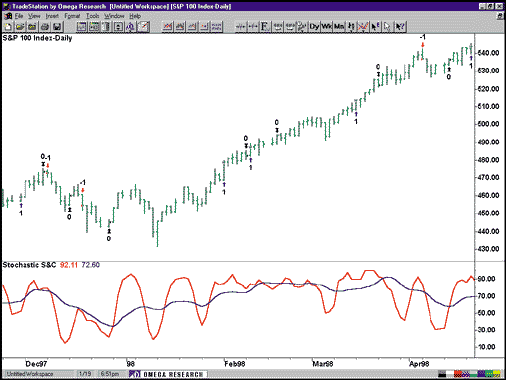
FIGURE 1: TRADESTATION. Here is an example of the stochastics system, as described by Robert Zellner in this month's interview, implemented in TradeStation.
An example of this system is shown in the chart in Figure 1. This EasyLanguage code is also available at Omega Research's Website. The filename is "StochSC.Ela." Note that all Traders' Tips techniques that are posted at the Omega Research Website can be utilized by either TradeStation or SuperCharts. Whenever possible, the posted techniques will include both Quick Editor and Power Editor formats.
-- Gaston Sanchez, Omega Research Inc.
800 422-8587, 305 270-1095
Internet: https://www.omegaresearch.com
GO BACK
 TECHNIFILTER PLUS
Here's a TechniFilter Plus strategy implementing Bollinger bands with Rsi confirmation, as discussed in Stuart Evens's "Bollinger Bands" article in this issue. Formula 2 is the 20-day RSI calculation.
Formula 3 is top Bollinger band and formula 4 is the bottom Bollinger band. The strategy is always invested, with rule 1 reversing from short to long when the low price is less than or equal to the bottom band and the Rsi is less than 30. Rule 2 shows the opposite reversal if the high price is above the top band and the RSI is above 70. Note this strategy requires a position limit, as the signals are not discrete.
Bollinger Band strategy with RSI confirmation
NAME: BBandRSI
POSITION LIMIT: 1
FORMULAS----------------------------------
 [1] Date
 [2] RSI(20)
        CG&1
 [3] TopBand(20,2)
        CA&1+&2*C|&1
 [4] BotBand(20,2)
        CA&1-(&2)*C|&1
 [5] High
        H
 [6] Low
        L

RULES----------------------------------
r1: LowBelowBand
        reverse short to long 1 on Next Open
        at signal: LowBelowBandAndRsiLow(30)    ( [6] <= [4] ) & ( [2] < &1 )
r2: HiAboveBand
        reverse long to short 1 on Next Open
        at signal: HiAboveBandAndRsiHigh(70)    ( [5] >= [3] ) & ( [2] > &1 )
This TechniFilter Plus strategy and the reports, strategies and formulas of earlier Traders' Tips can be downloaded from RTR's Website. Release 8.2 of TechniFilter Plus is now available for download.
-- Clay Burch, RTR Software
919 510-0608
E-mail: rtrsoft@aol.com
Internet: https://www.rtrsoftware.com
GO BACK
 WAVE WI$E MARKET SPREADSHEET
The following Wave Wi$e formulas implement the strategy discussed in Stuart Evens's "Bollinger bands" article in this issue, using Bollinger bands and RSI.
When we backtested this system on S&P data, we found that few signals were generated and most of the recent bull market move would have been missed.
A: DATE @TC2000(C:\TC2000\DATA,SP-500,STANDARD & POORS 500,DB)
B: HIGH
C: LOW
D: CLOSE
E: OPEN
F: VOL
G: Avg  @MAVG(CLOSE,21)
H: BandHi       AVG+2*@STD(CLOSE,21)
I: BandLo       AVG-2*@STD(CLOSE,21)
J: Rsi  @RSI(CLOSE,20)
K: signal       @SIGNAL(CLOSE,BUY,LOW<=BANDLO & RSI<30,
                HIGH>=BANDHI & RSI>70)
L:
M: color        @IF(SIGNAL>0,GREEN,WHITE)
==========End Formulas
-- Peter Di Girolamo
Jerome Technology
908 369-7503
E-mail jtiware@aol.com
https://members.aol.com/jtiware
GO BACK
 SMARTTRADER
This month's interview with Robert Zellner discusses a system based on stochastics using an approach similar to one called the Anti, which was presented in Laurence Connors and Linda Bradford Raschke's 1995 book Street Smarts. Added to the mix is a third variable, which is the number of bars to keep the trade.
The following system allows the optimization of the periods for K, D% and number of bars to keep the trade. It is based on daily data, but it will work on intraday data as well. The SmarTrader specsheet is shown in Figure 2.
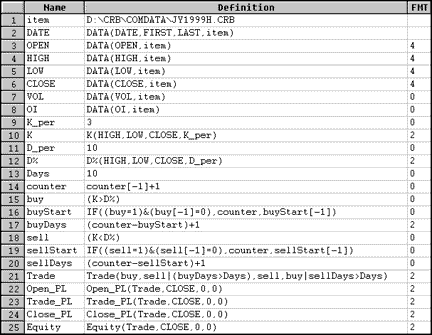
FIGURE 2: SMARTRADER SPECSHEET. This SmarTrader specsheet implements Robert Zellner's stochastics system.
Row 9, "K_per," is a coefficient holding the number of periods for K. Row 10 is a standard K study using the number in K_per as its number of bars to calculate. Row 11, "D_per," is a coefficient holding the number of periods for D%. Row 12 is the D% study using the number in D_per for its calculation. Row 13, "Days," is a coefficient holding the number of days to keep the trade. K_per, D_per and Days will each be assigned a range of values for optimization.
Row 14, "Counter," allows for the capture of a bar number at the entry of each position. Row 15 is a simple crossover of K above D%, indicating a buy signal. Row 16, "buyStart," captures the value of counter at the time of the initial signal and then repeats it during the trade. Row 17, "buyDays," computes the elapsed days in the trade to facilitate the optimization of bars (Days) in the trade. Rows 18, 19, and 20 repeat the process for the sell side of the system.
Row 21, "Trade," executes the actual entry/exit of trades. In this system, the buy exit is based on the presence of a sell signal or accumulated days in the trade exceeding Days. "Sell" is just the opposite. The remaining rows track the accounting functions of the trading system.
This SmarTrader specsheet file is available from Stratagem Software's Website.
-- Jim Ritter, Stratagem Software International
504 885-7353,
E-mail: Stratagem1@aol.com
Internet: https://www.stratagem1.com.
GO BACK
 NEUROSHELL TRADER
To implement the trading strategy specified in Stuart Evens's article "Bollinger Bands" using NeuroShell Trader, insert a trading strategy and follow these steps:
Add the following long entry conditions (Figure 3A) from the "relational" indicator category:
A<=B indicator with the following parameters
A = Low
B = BB Low(Close,20,2) (from the Time Series Category)

A<B indicator with the following parameters
A = RSI(Close,20) (from the Price Momentum Indicators Category)
B = 30
Add the following short entry conditions (Figure 3b) from the "relational" indicator category:
A>=B indicator with the following parameters
A = High
B = BB High(Close,20,2) (from the Time Series Category)

A>B indicator with the following parameters
A = RSI(Close,20) (from the Price Momentum Indicators Category)
B = 70
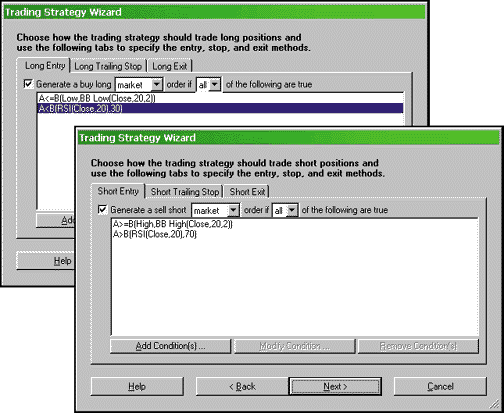
FIGURES 3A AND 3B: NeuroShell Trader. To implement in NeuroShell Trader the trading strategy based on Bollinger bands and RSI, begin by inserting a trading strategy from the Trading Strategy Wizard and add long and short entry conditions.
The article uses $5 for entry commissions and $10 for exit commissions. To match these commissions, choose the following options (Figures 4A and 4B):
From the Modify menu, open the Trading Strategy Parameters window.
Select the size of trades to "Buy as many shares possible with current account balance."
(The article doesn't specify to do this, but it doesn't make sense to trade one share with commissions.)
Select the "costs" tab
Enter the entry commission of $5 per trade
Enter the exit commission of $10 per trade
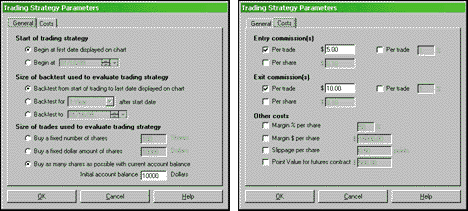
FIGURES 4A AND 4B: NeuroShell Trader. From the Trading Strategy Parameters window, click on "Buy as many shares as possible with current account balance," and from the"costs" tab, set the commissions to $5 for entry and $10 for exit, to match those used in the aritcle.
Users of NeuroShell Trader can download a chart representing this strategy from the STOCKS & COMMODITIES section of the NeuroShell Trader technical support Website. In addition, a sample chart is shown in Figure 5.
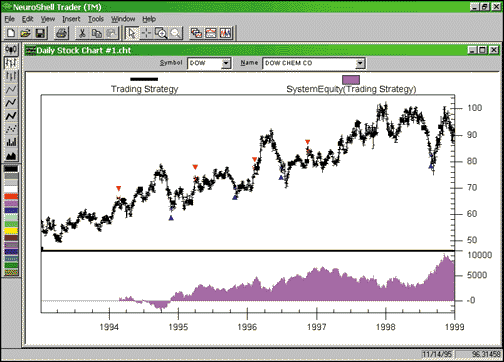
FIGURE 5: NEUROSHELL TRADER. Here's a chart demonstrating the Bollinger bands with RSI strategy as implemented in NeuroShell Trader.
-- Marge Sherald, Ward Systems
301 662-7950
E-mail wardsystems@msn.com
https://www.neuroshell.com
GO BACK
Excerpted from an article originally published in the March 1999 issue of Technical Analysis of STOCKS & COMMODITIES magazine. All rights reserved. © Copyright 1999, Technical Analysis, Inc.
Return to March 1999 Contents
![]() TRADESTATION/SUPERCHARTS
TRADESTATION/SUPERCHARTS ![]() TECHNIFILTER PLUS
TECHNIFILTER PLUS ![]() WAVE WI$E MARKET SPREADSHEET
WAVE WI$E MARKET SPREADSHEET ![]() SMARTTRADER
SMARTTRADER ![]() NEUROSHELL TRADER
NEUROSHELL TRADER 


