F ew books have produced as many indicators of lasting value as J. Welles Wilder's New Concepts in Technical Trading Systems. From that single text came the volatility index, the directional movement index, the relative strength index and the parabolic system, among numerous others. Even today, these four are staples of virtually every technical analysis toolbox after all these years because their robust simplicity gets directly to the concepts that percolate in traders' minds upon viewing a chart.
One of the most robust -- in the sense of simplicity, intuitive appeal and effectiveness -- is the parabolic time/price system, as Wilder referred to it. He named the system so because the curved lines resulting from his computations resembled a parabolic (or French) curve, though they were not true parabolas. It was within the conventions of the period to give indicators zippy, if inaccurate, names -- stochastics being a similar example.

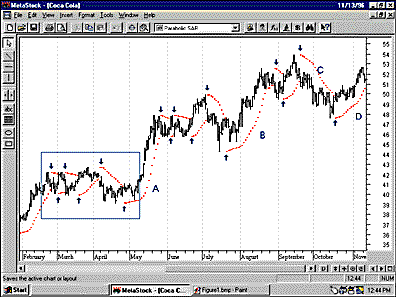
Wilder presented the indicator as a part of a stop-and-reverse (SAR) system -- that is, you used the indicator to go long or short so you were constantly in the market. Thus, it was designed to be a trading indicator, not something to be used for entering into long-term positions. A look at Figure 1 will reinforce that idea.
Figure 1 shows how parabolics curve into the price bars as they advance or decline, providing, if nothing else, an excellent exit point for a trader riding a win. Indeed, these days that is the most common usage for parabolics since, as a pure trading indicator, they have problems with trading range situations, problems discussed later. For now, admire the nifty way the parabolic tracked the rise in the lower left (A) and exited with most of the gains intact. Or check the rises (B, D) and decline (C) well traded in the upper right.