February 2008
TRADERS' TIPS
You can copy these formulas and programs for easy use in your spreadsheet or analysis software. Simply "select" the desired text by highlighting as you would in any word processing program, then use your standard key command for copy or choose "copy" from the browser menu. The copied text can then be "pasted" into any open spreadsheet or other software by selecting an insertion point and executing a paste command. By toggling back and forth between an application window and the open Web page, data can be transferred with ease.
This month's tips include formulas and programs for:
![]() METASTOCK:
TRADING DIVERGENCES
METASTOCK:
TRADING DIVERGENCES
![]() TRADESTATION:
TRADING DIVERGENCES
TRADESTATION:
TRADING DIVERGENCES
![]() eSIGNAL:
TRADING DIVERGENCES
eSIGNAL:
TRADING DIVERGENCES
![]() AMIBROKER:
TRADING DIVERGENCES
AMIBROKER:
TRADING DIVERGENCES
![]() NEUROSHELL
TRADER: TRADING DIVERGENCES
NEUROSHELL
TRADER: TRADING DIVERGENCES
![]() WEALTH-LAB:
TRADING DIVERGENCES
WEALTH-LAB:
TRADING DIVERGENCES
![]() AIQ:
TRADING DIVERGENCES
AIQ:
TRADING DIVERGENCES
![]() STRATASEARCH:
TRADING DIVERGENCES
STRATASEARCH:
TRADING DIVERGENCES
![]() NINJA
TRADER: TRADING DIVERGENCES
NINJA
TRADER: TRADING DIVERGENCES
![]() OMNITRADER:
TRADING DIVERGENCES
OMNITRADER:
TRADING DIVERGENCES
![]() TRADINGSOLUTIONS:
TRADING DIVERGENCES
TRADINGSOLUTIONS:
TRADING DIVERGENCES
![]() SWING
TRADER: TRADING DIVERGENCES
SWING
TRADER: TRADING DIVERGENCES
![]() VT
TRADER: TRADING DIVERGENCES
VT
TRADER: TRADING DIVERGENCES
or return to February 2008 Contents
Editor's note: Code in MetaStock language for "Trading Medium-Term Divergences" in the February 2008 issue was provided by the article's author, Sylvain Vervoort. It is reprinted here for readers' convenience.
20-BAR zero-lagging EMA for MetaStockGO BACKPeriod:= Input("What Period?",1,100,20);
EMA1:= Mov(CLOSE,Period,E);
EMA2:= Mov(EMA1,Period,E);
Difference:= EMA1 - EMA2;
ZeroLagEMA:= EMA1 + Difference;
ZeroLagEMATrailing-stop reversal for MetaStock
stop:= Input("Trailing Stop",0,20,7);
trail:= If(C=PREV,PREV,
If(((Ref(C,-1)<PREV) AND (C<PREV)),
Min(PREV,C*(1+stop/100)),
If((Ref(C,-1)>PREV) AND (C>PREV),
Max(PREV,C*(1-stop/100)),
If(C>PREV,C*(1-stop/100),C*(1+stop/100)))));
trailSVAPO price-only indicator for MetaStock
{calculate heikin ashi closing average haCl and get the input variables}
haO:=(Ref((O+H+L+C)/4,-1) + PREV)/2;
haC:=((O+H+L+C)/4+haOpen+Max(H,haOpen)+Min(L,haOpen))/4;
{input SVAPO period}
period:= Input("SVAPO period :", 2, 20, 8);
{input minimum per thousand price change}
cutoff:= Input("Minimum %o price change :",0.0,10,1);
{Inputs for standard deviation bands}
devH:= Input("Standard Deviation High :", 0.1, 5, 1.5);
devL:= Input("Standard Deviation Low :", 0.1, 5, 1.3);
stdevper:= Input("Standard Deviation Period :", 1, 200, 100);
{Smooth HaCl closing price}
haC:=Tema(haCl,period/1.6);
{MA divisor}
vave:=Ref(Mov(C,period*5,S),-1);
{Basic trend}
vtr:=Tema(LinRegSlope(C,period),period);
{SVAPO result of price only}
SVAPO:=Tema(Sum(If(haC>(Ref(haC,-1)*(1+cutoff/1000))
AND Alert(vtr>=Ref(vtr,-1),2),C,If(haC<(Ref(haC,-1)*(1-cutoff/1000))
AND Alert(vtr>Ref(vtr,-1),2),-C,0)),period)/(vave+1),period);
devH*Stdev(SVAPO,stdevper);
-devL*Stdev(SVAPO,stdevper);
zeroref:=0;
zeroref;
SVAPO--Sylvain Vervoort
![]() TRADESTATION:TRADING
DIVERGENCES
TRADESTATION:TRADING
DIVERGENCES
Sylvain Vervoort's article in this issue, "Trading Medium-Term Divergences," describes the use of divergences between price and various oscillators. He uses the relative strength index (RSI) as an example oscillator. The article includes code for a zero-lag exponential moving average, the SVAPO price-only indicator, and the trailing stop reversal indicator.
The EasyLanguage code for these indicators is shown here. A sample chart implementing them is shown in Figure 1. Since the article does not include a specific algorithm for the divergence calculation, the .Eld file posted on our website will include the indicator RSI_Divergence, written by Mitch Shack of TradeStation Securities. It is a modified version of his CCI_Divergence indicator (2005). The RSI_Divergence code is not provided here, but is included with the code that can be downloaded from our website.
To download the EasyLanguage code for these studies, go to the Support Center at TradeStation.com. Search for the file "VervoortDiv.eld."
TradeStation does not endorse or recommend any particular strategy.
--Mark Mills and Mitch Shack
TradeStation Securities, Inc.
A subsidiary of TradeStation Group, Inc.
www.TradeStation.com
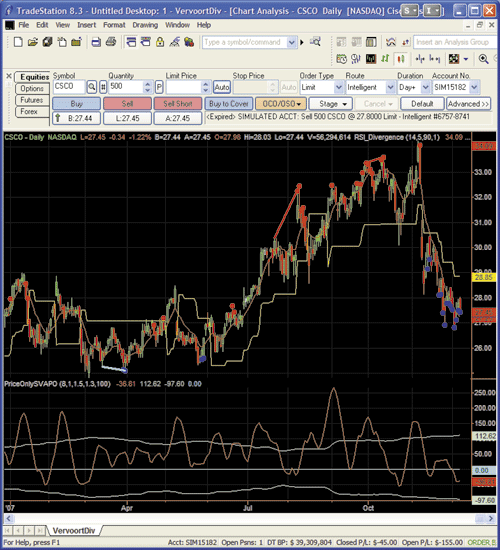
FIGURE 1: TRADESTATION, TRADING DIVERGENCES. Vervoort's PriceOnlySVAPO oscillator is displayed in the lower subgraph. In the price subgraph, the yellow line is the TrailingStopRev indicator. The red line in the price subgraph is the Zero-Lagging ExpAvg indicator. The RSI_Divergence indicator is inserted into the chart twice. It creates the blue and red dots and short trendlines on the price bars and on the RSI oscillator, which indicate areas of possible divergence between RSI and price.
Indicator: PriceOnlySVAPO--Mark Mills and Mitch Shackinputs:
Period( 8 ),
Cutoff( 1 ),
DevH( 1.5 ),
DevL( 1.3 ),
StDevPeriod( 100 ) ;variables:
AP( 0 ),
haO( 0 ),
haCl( 0 ),
haC( 0 ),
VAvg( 0 ),
VTrend( 0 ),
CutoffMult( 0 ),
VTrendCountCond( false ),
HCUpCondition( false ),
HCDnCondition( false ),
Temp( 0 ),
SVAPO( 0 ),
SDSVAPO( 0 ),
UpperBand( 0 ),
LowerBand( 0 ) ;{ calculate the Vervoort version of Heiken-Ashi }
AP = AvgPrice ;
haO = 0.5 * ( AP[1] + haO[1] ) ;
haCl = 0.25 * (AP + haO + Maxlist(AP,Maxlist(High,haO)) + Minlist(AP,Minlist(Low,haO))) ;
haC = TEMA( haCl, 0.625 * Period ) ;{ medium term MA of volume to limit extremes and division factor }
VAvg = Average( Close[1], 5 * Period ) ;{ Vervoot's basic volume trend }
VTrend = TEMA( LinearRegSlope( Close, Period ),
Period ) ;{ SVAPO result of price and volume }
CutoffMult = 0.001 * Cutoff ;
VTrendCountCond = CountIf( VTrend >= VTrend[1], 2 ) =2 ;
HCUpCondition = haC > haC[1] * ( 1 + CutoffMult ) and VTrendCountCond ;
HCDnCondition = haC < haC[1] * ( 1 - CutoffMult ) and VTrendCountCond ;Temp = iff( HCUpCondition, Close, iff( HCDnCondition, -1 * Close, 0 ) ) ;
SVAPO = TEMA( Summation( Temp, Period ), Period ) ;
SDSVAPO = StdDev( SVAPO, StDevPeriod ) ;
UpperBand = DevH * SDSVAPO ;
LowerBand = -1 * DevL * SDSVAPO ;if CurrentBar > StDevPeriod then
begin
Plot1( SVAPO, "SVAPO" ) ;
Plot2( UpperBand, "UpperBand" ) ;
Plot3( LowerBand, "LowerBand" ) ;
Plot4( 0, "Zero" ) ;
end ;Indicator: Zero-Lagging ExpAvg
inputs: Period( 20 ) ;
variables: EMA1( 0 ), EMA2( 0 ), ZLagEMA( 0 ) ;EMA1 = XAverage( Close, Period ) ;
EMA2 = XAverage( EMA1, Period ) ;
ZLagEMA = 2 * EMA1 - EMA2 ;Plot1( ZLagEMA, "ZLagEMA" ) ;
Indicator: TrailingStopRev
inputs:
TrailStopPct( 7 ) ; { enter percentage number, not percentage divided by 100; for example, for 7% enter 7, not 0.07 }variables:
TrailPctPlus( 0 ),
TrailPctMinus( 0 ),
Trail( 0 ) ;if CurrentBar = 1 then
begin
TrailPctPlus = 1 + ( 0.01 * TrailStopPct ) ;
TrailPctMinus = 1 - ( 0.01 * TrailStopPct ) ;
end ;if Close <> Trail then
begin
if Close[1] < Trail and Close < Trail then
Trail = MinList( Trail, Close * TrailPctPlus )
else if Close[1] > Trail and Close > Trail then
Trail = MaxList( Trail, Close * TrailPctMinus )
else if Close > Trail then
Trail = Close * TrailPctMinus
else
Trail = Close * TrailPctPlus ;
end ;Plot1( Trail, "Trail" ) ;
Indicator: PriceOnlySVAPO
inputs:
Period( 8 ),
Cutoff( 1 ),
DevH( 1.5 ),
DevL( 1.3 ),
StDevPeriod( 100 ) ;variables:
AP( 0 ),
haO( 0 ),
haCl( 0 ),
haC( 0 ),
VAvg( 0 ),
VTrend( 0 ),
CutoffMult( 0 ),
VTrendCountCond( false ),
HCUpCondition( false ),
HCDnCondition( false ),
Temp( 0 ),
SVAPO( 0 ),
SDSVAPO( 0 ),
UpperBand( 0 ),
LowerBand( 0 ) ;{ calculate the Vervoort version of Heiken-Ashi }
AP = AvgPrice ;
haO = 0.5 * ( AP[1] + haO[1] ) ;
haCl = 0.25 * (AP + haO + Maxlist(AP,Maxlist(High,haO)) + Minlist(AP,Minlist(Low,haO))) ;
haC = TEMA( haCl, 0.625 * Period ) ;{ medium term MA of volume to limit extremes and
division factor }
VAvg = Average( Close[1], 5 * Period ) ;{ Vervoot's basic volume trend }
VTrend = TEMA( LinearRegSlope( Close, Period ), Period ) ;{ SVAPO result of price and volume }
CutoffMult = 0.001 * Cutoff ;
VTrendCountCond = CountIf( VTrend >= VTrend[1], 2 ) = 2 ;
HCUpCondition = haC > haC[1] * ( 1 + CutoffMult ) and VTrendCountCond ;
HCDnCondition = haC < haC[1] * ( 1 - CutoffMult ) and VTrendCountCond ;Temp = iff( HCUpCondition, Close, iff( HCDnCondition, -1 * Close, 0 ) ) ;
SVAPO = TEMA( Summation( Temp, Period ), Period ) ;
SDSVAPO = StdDev( SVAPO, StDevPeriod ) ;
UpperBand = DevH * SDSVAPO ;
LowerBand = -1 * DevL * SDSVAPO ;if CurrentBar > StDevPeriod then
begin
Plot1( SVAPO, "SVAPO" ) ;
Plot2( UpperBand, "UpperBand" ) ;
Plot3( LowerBand, "LowerBand" ) ;
Plot4( 0, "Zero" ) ;
end ;Indicator: Zero-Lagging ExpAvg
inputs: Period( 20 ) ;
variables: EMA1( 0 ), EMA2( 0 ), ZLagEMA( 0 ) ;EMA1 = XAverage( Close, Period ) ;
EMA2 = XAverage( EMA1, Period ) ;
ZLagEMA = 2 * EMA1 - EMA2 ;Plot1( ZLagEMA, "ZLagEMA" ) ;
Indicator: TrailingStopRev
inputs:
TrailStopPct( 7 ) ; { enter percentage number, not percentage divided by 100; for example, for 7% enter 7, not 0.07 }variables:
TrailPctPlus( 0 ),
TrailPctMinus( 0 ),
Trail( 0 ) ;if CurrentBar = 1 then
begin
TrailPctPlus = 1 + ( 0.01 * TrailStopPct ) ;
TrailPctMinus = 1 - ( 0.01 * TrailStopPct ) ;
end ;if Close <> Trail then
begin
if Close[1] < Trail and Close < Trail then
Trail = MinList( Trail, Close * TrailPctPlus )
else if Close[1] > Trail and Close > Trail then
Trail = MaxList( Trail, Close * TrailPctMinus )
else if Close > Trail then
Trail = Close * TrailPctMinus
else
Trail = Close * TrailPctPlus ;
end ;Plot1( Trail, "Trail" ) ;
TradeStation Securities, Inc.
A subsidiary of TradeStation Group, Inc.
www.TradeStation.com
![]() eSIGNAL:
TRADING DIVERGENCES
eSIGNAL:
TRADING DIVERGENCES
For this month's Traders' Tips, we've provided the formulas ZeroLag_Ema.efs and TrailingStop_Reversal.efs based on the formula code from Sylvain Vervoort's article in this issue, "Trading Medium-Term Divergences."
Both studies contain a formula parameter that may be configured through the Edit Studies option in the Advanced Chart to set the period length or the initial trailing stop value. The RSI study is already included in eSignal (see the Chart Options -- Basic Studies menu).
The RSI study is a nonprice study by default. To overlay the RSI study onto the price pane, click and drag the study over the price pane while holding down the shift key. To set the overlaid RSI study to its own scale, right-click on the chart, select Edit Studies, select the RSI study from the list at the top of the Study Properties window, then select the "Display Left" and Scale Left" options at the bottom of the window. Click OK to apply the settings. A sample chart is shown in Figure 2.
The SVAPO study mentioned in Vervoort's article can be found in our EFS Library, which was completed for the November 2007 issue.
To discuss these studies or download complete copies of the formulas, please visit the EFS Library Discussion Board forum under the Forums link at www.esignalcentral.com or visit our EFS KnowledgeBase at www.esignalcentral.com/support/kb/efs/. The eSignal formula scripts (EFS) are also available for copying and pasting from the STOCKS & CCOMMODITIES website at Traders.com.
--Jason Keck
eSignal, a division of Interactive Data Corp.
800 815-8256, www.esignalcentral.com

/*********************************FIGURE 2: eSIGNAL, TRADING DIVERGENCES. Here is a demonstration of the ZeroLag EMA and trailing stop in eSignal.
Provided By:
eSignal (Copyright �(c) eSignal), a division of Interactive Data Corporation. 2007. All rights reserved. This sample eSignal Formula Script (EFS) is for educational purposes only and may be modified and saved under a new file name. eSignal is not responsible for the functionality once modified. eSignal reserves the right to modify and overwrite this EFS file with each new release.
Description: Trading Divergences by Sylvain Vervoort
Version: 1.0 12/7/2007
Notes:
* February 2008 issue of Stocks &Commodities Magazine
* Study requires version 8.0 or later.
Formula Parameters: Defaults:
Trailing Stop 7
**********************************/
function preMain() {
setPriceStudy(true);
setStudyTitle("Trailing Stop Reversal ");
setCursorLabelName("Stop Rev", 0);
setDefaultBarFgColor(Color.brown, 0);
setDefaultBarThickness(2, 0);
var fp1 = new FunctionParameter("nStop", FunctionParameter.NUMBER);
fp1.setName("Trailing Stop");
fp1.setLowerLimit(0);
fp1.setDefault(7);
}
// Global Variables
var bVersion = null; // Version flag
var nTrail = null;
var nTrail_1 = 0;
function main(nStop) {
var nState = getBarState();
var nIndex = getCurrentBarIndex();
if (bVersion == null) bVersion = verify();
if (bVersion == false) return;
if (nState == BARSTATE_NEWBAR && nTrail != null) {
nTrail_1 = nTrail;
}
var nClose = close(0);
var nClose_1 = close(-1);
if (nClose_1 == null) return;
if (nClose == nTrail_1) {
nTrail = nTrail_1;
} else if (nClose_1 < nTrail_1 && nClose < nTrail_1)
{
� nTrail = Math.min(nTrail_1, (nClose*(1+nStop/100)));
} else if (nClose_1 > nTrail_1 && nClose > nTrail_1) {
nTrail = Math.max(nTrail_1, (nClose*(1-nStop/100)));
} else if (nClose > nTrail_1) {
nTrail = nClose*(1-nStop/100);
� } else {
nTrail = nClose*(1+nStop/100)
}
return nTrail;
}
function verify() {
var b = false;
if (getBuildNumber() < 779) {
drawTextAbsolute(5, 35, "This study requires version 8.0 or later.",
Color.white, Color.blue, Text.RELATIVETOBOTTOM|Text.RELATIVETOLEFT|Text.BOLD|Text.LEFT,
null, 13, "error");
drawTextAbsolute(5, 20, "Click HERE to upgrade.@URL=https://www.esignal.com/download/default.asp",
Color.white, Color.blue, Text.RELATIVETOBOTTOM|Text.RELATIVETOLEFT|Text.BOLD|Text.LEFT,
null, 13, "upgrade");
return b;
} else {
b = true;
}
return b;
}
/*********************************
Provided By:
eSignal (Copyright �(c) eSignal), a division of Interactive Data
Corporation. 2007. All rights reserved. This sample eSignal Formula Script
(EFS) is for educational purposes only and may be modified and saved under
a new file name. eSignal is not responsible for the functionality once
modified. eSignal reserves the right to modify and overwrite this EFS file
with each new release.
Description: Trading Divergences by Sylvain Vervoort
Version: 1.0 12/7/2007
Notes:
* February 2008 Issue of Stocks & Commodities Magazine
* Study requires version 8.0 or later.
Formula Parameters: Defaults:
Periods 20
**********************************/
function preMain() {
setPriceStudy(true);
setStudyTitle("Zero Lag EMA ");
setCursorLabelName("ZEMA", 0);
setDefaultBarFgColor(Color.red, 0);
setDefaultBarThickness(2, 0);
var fp1 = new FunctionParameter("nPeriods", FunctionParameter.NUMBER);
fp1.setName("Periods");
fp1.setLowerLimit(1);
fp1.setDefault(20);
}
// Global Variables
var bVersion = null; // Version flag
var bInit = false; // Initialization flag
var xEma1 = null;
var xEma2 = null;
function main(nPeriods) {
var nState = getBarState();
var nIndex = getCurrentBarIndex();
if (bVersion == null) bVersion = verify();
if (bVersion == false) return;
if (bInit == false) {
xEma1 = ema(nPeriods);
xEma2 = ema(nPeriods, xEma1);
bInit = true;
}
var nZEma = null;
var nEma1 = xEma1.getValue(0);
var nEma2 = xEma2.getValue(0);
if (nEma1 == null || nEma2 == null) return;
nZEma = nEma1 + (nEma1 - nEma2);
return nZEma;
}
function verify() {
var b = false;
if (getBuildNumber() < 779) {
drawTextAbsolute(5, 35, "This study requires version 8.0 or later.",
Color.white, Color.blue, Text.RELATIVETOBOTTOM|Text.RELATIVETOLEFT|Text.BOLD|Text.LEFT,
null, 13, "error");
drawTextAbsolute(5, 20, "Click HERE to upgrade.@URL=https://www.esignal.com/download/default.asp",
Color.white, Color.blue, Text.RELATIVETOBOTTOM|Text.RELATIVETOLEFT|Text.BOLD|Text.LEFT,
null, 13, "upgrade");
return b;
} else {
b = true;
}
return b;
}
![]() AMIBROKER:
TRADING DIVERGENCES
AMIBROKER:
TRADING DIVERGENCES
In "Trading Medium-Term Divergences" in this issue, author Sylvain Vervoort shows a trading technique that combines his own SVAPO indicator with moving averages, RSI, trendlines, and trailing stops. The RSI is a standard indicator already available in AmiBroker.
The AmiBroker Formula Language coding for the remaining three main components of his system are shown in listings 1, 2, and 3. To use them, simply open the AFL Editor window, type in the formula, and press the "Apply Indicator" button. You can overlay the price chart on any of them by simply dragging the "price" from Charts window and dropping it onto the indicator.
A sample chart is shown in Figure 3.
--Tomasz Janeczko, AmiBroker.com
www.amibroker.com
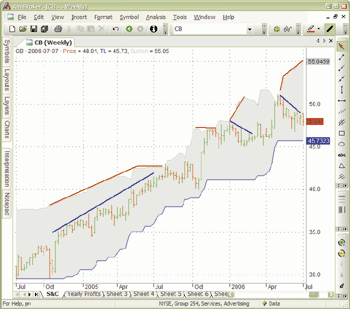
FIGURE 3: AMIBROKER, TRADING DIVERGENCES. Here is a sample AmiBroker chart demonstrating the RSI(14) overlay (lower pane) and five-day SVAPO (upper pane) on a S&P 500 price chart.
LISTING 1: Zero-lag moving average
function ZeroLagMA( data, periods )
{
EMA1 = EMA( data, periods );
EMA2 = EMA( EMA1, periods );
Diff = EMA1 - EMA2;
return EMA1 + Diff;
}
Periods = Param("Periods", 20, 2, 100 );
Plot( ZeroLagMA( Close, Periods ), "ZeroLagMA-"+Periods, colorRed );
LISTING 2: SVAPO price-only
// input parameters
Period = Param("SVAPO period", 8, 2, 20, 1 );
CutOff = Param("Min. % price change", 1, 0, 10, 0.1 );
devH = Param("Std. Dev High", 1.5, 0.1, 5, 0.1 );
devL = Param("Std. Dev Low", 1.3, 0.1, 5, 0.1 );
StDevPer = Param("Std. Dev. Period", 100, 1, 200, 1 );
// heikin-ashi smoothing
Av4 = (O+H+L+C)/4;
HaOpen = AMA( Ref( Av4, -1 ), 0.5 );
HaCl = ( Av4 + HaOpen + Max( Av4, Max( H, HaOpen ) ) + Min( Av4,
Min( L, HaOpen ) ) ) / 4;
HaC = TEMA( HaCl, period/1.6 );
// medium term MA of volume to limit extremes
Vave = Ref( MA( C, period * 5 ), -1 );
// basic trend
Vtr = TEMA( LinRegSlope( C, period ), period );
HaCLimitUp = Ref( HaC, -1 ) * (1 + Cutoff/1000);
HaCLimitDn = Ref( HaC, -1 ) * (1 - Cutoff/1000);
// SVAPO result of price only
SVAPOSum = Sum( IIf( ( HaC > HaCLimitUp ) AND Hold( Vtr >= Ref(
Vtr,-1 ), 2 ), C,
IIf( ( HaC < HaCLimitDn ) AND Hold( Vtr > Ref( Vtr, -1 ), 2
), -C, 0 ) ), period );
SVAPO = TEMA( SVAPOSum / (Vave+1), period );
PlotGrid( 0 );
Plot( SVAPO, "SVAPO", colorBlue, styleThick );
Plot( devH * StDev( SVAPO, StDevPer ), "Up", colorGreen );
Plot( -devL * StDev( SVAPO, StDevPer ), "Dn", colorRed );
LISTING 3: Trailing stop reversal
stop = Param("Trailing Stop", 7, 0, 20 );
trail = Null;
for( i = 1; i < BarCount; i++ )
{
prev = trail[ i - 1 ];
Cur = 0;
if( prev == C[ i ] )
Cur = prev;
else
if( C[ i - 1 ] < prev AND C[ i ] < prev )
Cur = Min( prev, C[ i ] * ( 1 + stop/100 ) );
else
if( C[ i - 1 ] > prev AND C[ i ] > prev )
Cur = Max( prev, C[ i ] * ( 1 - stop/100 ) );
else
if( C[ i ] > prev )
Cur = C[ i ] * ( 1 - stop/100 );
else
Cur = C[ i ] * ( 1 + stop/100 );
trail[ i ] = Cur;
}
Plot( C, "Price", colorBlack );
Plot( trail, "Trailstop", colorRed );
![]() NEUROSHELL
TRADER: CONFIRMING PRICE TREND
NEUROSHELL
TRADER: CONFIRMING PRICE TREND
The zero-lag exponential moving average, short-term volume and price
oscillator (SVAPO), and trailing stop reversal systems described by Sylvain
Vervoort in his article in this issue, "Trading Medium-Term Divergences,"
can be easily implemented in the NeuroShell Trader by combining a few of
NeuroShell Trader's 800+ indicators.
Select "New Indicator" from the Insert menu and use the Indicator Wizard
to set up the indicators as follows:
Zero-lagging exponential moving average:Note: The SVAPO oscillator is based on the HeikinAshiClose and TEMA custom indicators, which NeuroShell Trader users can download for free at www.ward.net.Add2( ExpAvg( Close, Period ), Subtract( ExpAvg( Close, period ), ExpAvg( ExpAvg( Close, period )) ) )
SVAPO price only indicator:
haC = Tema( HeikinAshiClose( Open, High, Low, Close ), 5 )
vave = Lag( MovAvg( Close, 40 ), 1 )
vtr = Tema( LinRegSlope( Close, 8 ), 8 )
vcutoff = IfThenElseIfThen( And2( A>B( %Change(haC, 1 ), cutoff ), A>=B( vtr, Lag( vtr, 1 ) ) ), Close, And2( A<B( %Change(haC, 1 ), Negative(cutoff) ), A>B (vtr, Lag(vtr,1) ) ), Neg(Close), 0 )
SVAPO = Tema( Divide( Sum( vcutoff, 8), Add2( vave, 1 ) ), 8)
StndDevHigh = BollingerBandHigh ( SVAPO, stdevper, devH )
StndDevLow = BollingerBandLow ( SVAPO, stdevper, devL )
To recreate the 2% trailing stop reversal trading strategy, select "New Trading Strategy" from the Insert menu and enter the following in the appropriate locations of the Trading Strategy Wizard:
Long protective stop:If you have NeuroShell Trader Professional, you can also choose whether the system parameters should be optimized. After backtesting the trading strategy, use the "Detailed Analysis" button to view the backtest and trade-by-trade statistics for the trailing reversal strategy. See Figure 4.
Trailing Price % ( Trading Strategy, 2 )Short protective:
Trailing Price % ( Trading Strategy, 2 )
For more information on NeuroShell Trader, visit https://www.NeuroShell.com.
--Marge Sherald, Ward Systems Group, Inc.
301 662-7950, sales@wardsystems.com
www.neuroshell.com
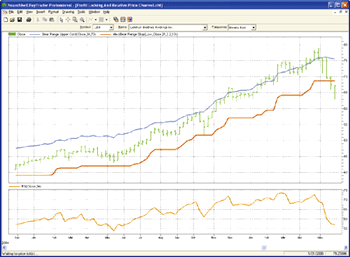
GO BACKFIGURE 4: NEUROSHELL TRADER, TRADING DIVERGENCES. Here is a sample NeuroShell Trader chart demonstrating the zero-lag exponential moving average, short-term volume and price oscillator (SVAPO), and trailing stop reversal systems on the S&P 500.
![]() WEALTH-LAB:
TRADING DIVERGENCES
WEALTH-LAB:
TRADING DIVERGENCES
Since this month's Traders' Tips article is about trading divergences ("Trading Medium-Term Divergences" by Sylvain Vervoort), we looked back to our Traders' Tip code written for the July 2004 issue of STOCKS & COMMODITIES on "VFI Divergence" and modified it for the all-new Wealth-Lab Version 5.0 (.net).
The strategy's PeakDivergence method, which automatically highlights and draws the lines on the chart, can be used to detect any indicator's divergence from a specified price DataSeries. We've included a trading strategy that shorts on "oscillator lower-top divergence" and exits after a specified number of bars, which can readily be changed using the parameter sliders in the lower left corner (Figure 5).
--Robert Sucher
www.wealth-lab.com
WealthScript strategy code:FIGURE 5: WEALTH-LAB, TRADING DIVERGENCES. When using peaks and troughs, keep in mind that price must retrace by some amount before a peak/trough can be seen. Highlighting the detection bars adds realism to what a strategy can achieve.
/* Code for the WealthLab.Strategies namespace */
public class DivergenceDetector : WealthScript
{
private StrategyParameter peakPctPrice;
private StrategyParameter peakPctIndicator;
private StrategyParameter exitBars;
public DivergenceDetector()
{
peakPctPrice = CreateParameter("Price Peak%", 4,2, 10, 1);
� peakPctIndicator = CreateParameter("Indctr Peak%",20, 5, 30,
1);
exitBars = CreateParameter("Exit bars", 5, 1, 30,1);
}
// Strategy logic
protected override void Execute()
{
int pkPctPrice = peakPctPrice.ValueInt;
int pkPctIndicator = peakPctIndicator.ValueInt;
int barsToHold = exitBars.ValueInt;
int lastDetectedBar = 0;
_barLastChecked = 0;
DataSeries rsi = RSI.Series(Close, 14);
ChartPane rsiPane = CreatePane(40, true, true);
PlotSeries(rsiPane, rsi, Color.Brown, WealthLab.LineStyle.Solid,
2);
for(int bar = 20; bar < Bars.Count; bar++)
{
if (IsLastPositionActive) {
Position p = LastPosition;
if (bar + 1 - p.EntryBar >= barsToHold)
CoverAtMarket(bar + 1, p);
}
else if (PeakDivergence(bar, Close, pkPctPrice, rsi, pkPctIndicator,
rsiPane))
ShortAtMarket(bar + 1);
}
}
// Returns true if divergence with indicator detected on the specified
bar
public bool PeakDivergence(int bar, DataSeries price, double pctRev1,
DataSeries ind, double pctRev2, ChartPane indPane)
{
bool divergeDetected = false;
PeakTroughMode mode = PeakTroughMode.Percent;
int pb1 = (int)PeakBar.Value(bar, price, pctRev1, mode);
if (pb1 > _barLastChecked) {
_barLastChecked = pb1;
� int pb2 = (int)PeakBar.Value(pb1, price, pctRev1, mode);
if (pb2 > -1) {
int testBar = Math.Min(bar, pb1 + proxBars);
int ibar1 = (int)PeakBar.Value( testBar, ind, pctRev2, mode);
// test peak proximity
if (Math.Abs(pb1 - ibar1) > proxBars) ibar1 = pb1;
int span = Math.Min(pb1 - pb2 - 1, proxBars);
testBar = Math.Min(ibar1 - 1, pb2 + span);
int ibar2 = (int)PeakBar.Value( testBar, ind, pctRev2, mode);
if (ibar2 < 0) ibar2 = 0;
if (Math.Abs(pb2 - ibar2) > proxBars) ibar2 = pb2;
divergeDetected = Math.Sign(price[pb1] - price[pb2]) != Math.Sign(ind[ibar1]
- ind[ibar2]);
if (divergeDetected) {
// Highlight bar detected
SetPaneBackgroundColor(PricePane, bar, Color.FromArgb(40, Color.Blue));
DrawLine(PricePane, pb1, price[pb1] * 1.01, pb2, price[pb2] * 1.01,
Color.Blue, LineStyle.Solid, 2);
DrawLine(indPane, ibar1, ind[ibar1] * 1.01, ibar2, ind[ibar2] *
1.01, Color.Red, LineStyle.Solid, 2);
if (Math.Sign(price[pb1] - price[pb2]) == 1)
for (int b = pb2; b <= pb1; b++)
SetPaneBackgroundColor(indPane, b, Color.FromArgb(40, Color.Red));
}
}
}
return divergeDetected;
}
private const int proxBars = 6;
private int _barLastChecked = 0;
}
![]() AIQ:
TRADING DIVERGENCES
AIQ:
TRADING DIVERGENCES
The AIQ code for Sylvain Vervoort's indicators discussed in his article in this issue, "Trading Medium-Term Divergences" " zero-lag exponential moving average, SVAPO, and trailing stop reversal -- is given here.
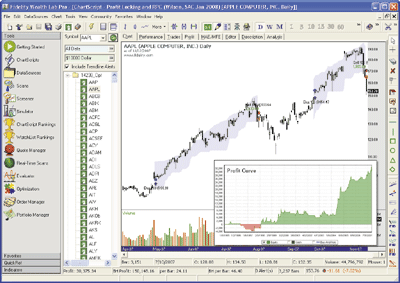
Figure 6 shows the three indicators on a chart of AAPL. The purple line is the SVAPO indicator (lower panel). The zero-lag exponential moving average is shown on the price chart as a yellow line. The trailing stop reversal indicator is shown on the price chart as a green line.
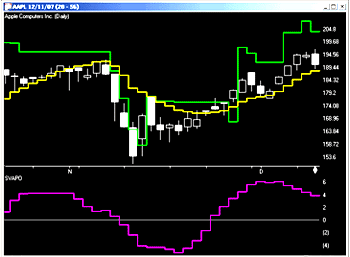
This code can be downloaded from the AIQ website at www.aiqsystems.com and also from www.tradersedgesystems.com/traderstips.htm.FIGURE 6: AIQ, TRADING DIVERENCES. Here is a sample AIQ chart of AAPL showing the zero lag exponential moving average (yellow), the trailing stop reversal (green), and the SVAPO indicator (purple).
--Richard Denning, AIQ Systems
richard.denning@earthlink.net
!! TRADING DIVERGENCESGO BACK
! Author: Sylvain Vervoort, TASC February 2007
! Coded by: Richard Denning 12/11/07! CODING ABBREVIATIONS:
H is [high].
L is [low].
C is [close].
C1 is valresult(C,1).
O is [open].
V is [volume].!---------------20 BAR ZERO-LAG EXP AVG------------------------
! INPUTS:
emaLen is 20.
EMA1 is expavg(C,emaLen).
EMA2 is expavg(EMA1,emaLen).
Diff is EMA1 - EMA2.
zeroLagEMA is EMA1 + Diff.
!-------------------end ZERO LAG EMA--------------------------------! ------------------------------SVAPO-----------------------------------
! INPUTS:
P1 is 8. !Min=2 , max = 20, default=8
cutoff is 1. � !Min=0, max=10, default=1
devH is 1.5. !Min=0.1, max=5, default=1.5
devL is 1.3. !Min=0.1, max=5, default=1.3
devP is 100. !Min 1, max=200, default=100haC is (O + H +L + C) / 4.
DaysInto is ReportDate() - RuleDate().
end if DaysInto > 10.
endHAO is iff(end,O, haO).
haO is (valresult(endHAO,1) + valresult(haC,1)) / 2.haH is Max(H,max(haO,haC)).
haL is Min(L,min(haO,haC)).haCL is (haC + haO + haH + haL) / 4.
P2 is P1 / 1.6.
haTemaCL is 3 * (expavg(haCL,P2))
- 3*(expavg(expavg(haCL,P2),P2))
+ expavg(expavg(expavg(haCL,P2),P2),P2).
haTemaCL1 is valresult(haTemaCL,1).vavg is simpleavg(V,P1 * 5,1).
vmax is vavg * 2.
vc is iff(V < vmax,V,vmax).
vLRs is slope2(vc,P1).
vtr is 3 * (expavg(vLRs,P1))
- 3 * (expavg(expavg(vLRs,P1),P1))
+ expavg(expavg(expavg(vLRs,P1),P1),P1).
vtr1 is valresult(vtr,1).temp1 is iff(haTemaCL > haTemaCL1*(1+cutoff/1000)
and countof(vtr >= vtr1,2)>=1 ,vc,
iff(haTemaCL < haTemaCL1*(1-cutoff/1000)
and countof(vtr > vtr1,2)>=1, -vc,0)).temp2 is sum(temp1,P1) / (vavg+1).
! SVAPO (TASC NOV 2007):
SVAPO is 3 * (expavg(temp2,P1))
- 3 * (expavg(expavg(temp2,P1),P1))
+ expavg(expavg(expavg(temp2,P1),P1),P1).stdev is sqrt(variance(SVAPO,devP)).
upBand is devH * stdev. !Upper band for SVAPO
loBand is -devL * stdev. !Lower band for SVAPO
!-----------------------------end SVAPO-------------------------------!----------------------TRAILING STOP REVERSAL------------------
!INPUTS:
stopLvl is 7.endTrail is iff(end,C,Trail).
prevTrail is valresult(endTrail,1).
Trail is iff(C = prevTrail,prevTrail,
iff(C1 < prevTrail and C < prevTrail,
min(prevTrail,C*(1+stopLvl/100)),
iff(C1 > prevTrail and C > prevTrail,
max(prevTrail,C*(1+stopLvl/100)),
iff(C > prevTrail, C*(1-stopLvl/100),C*(1+stopLvl/100))))).
!------------------end TRAILING STOP REVERSAL------------------
![]() STRATASEARCH:
TRADING DIVERGENCES
STRATASEARCH:
TRADING DIVERGENCES
In "Trading Medium-Term Divergences" in this issue, author Sylvain Vervoort has given us a variety of indicators that can be examined to identify both long and short trading opportunities. These include broken trendlines, moving averages, market tops and bottoms, divergences, trailing stops, and the short-term volume and price oscillator (SVAPO). While we have the code to create any of these indicators, it is up to us to define the specifics of how these indicators will be used.
In a simple test against the NASDAQ 100, we used a combination of an increasing moving average, a recent "W" pattern in the RSI, and the SVAPO rising above its lower band. While the percentage of profitable trades was very low (35%), the system did a very nice job of identifying a number of very strong rallies. In particular, the average gain was almost 12% while the average loss was only 3.5%. The system as a whole backtested with an average annual return of over 30% including commissions and spread adjustments.
A sample chart is shown in Figure 7.
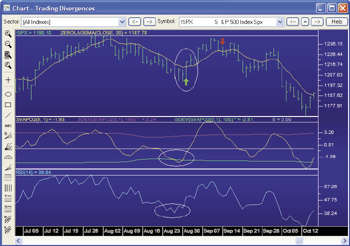
While the tested system might not be ideal for trading on its own, the implementation of additional trading rules may improve the percentage profitability and turn this into a truly winning system. The automated search in StrataSearch can help by allowing users to automatically test the use of additional trading rules alongside this system.FIGURE 7: STRATASEARCH, TRADING DIVERGENCES. The RSI's "W� pattern, the SVAPO coming off its lower band, and the turnaround of the moving average all combine to identify a buying opportunity.
As with all Traders' Tips, a plug-in containing the code for the SVAPO and its supporting formulas can be downloaded from the Shared Area of our User Forum. In addition, this month's plug-in contains a number of trading rules that can be included in your automated search for trading systems. Simply install the plug-in, start your search, and let StrataSearch identify whether this indicator can improve your trading systems.
--Pete Rast
Avarin Systems Inc
www.StrataSearch.com
//****************************************************************GO BACK
// SVAPO -- Price Only
//****************************************************************
period= parameter("period");
cutoff= parameter("cutoff");// calculate the heikin-ashi closing average haCl
haO=(ref((O+H+L+C)/4,-1) + ref((O+H+L+C)/4,-2))/2;
haCl=((O+H+L+C)/4+haO+higher((O+H+L+C)/4,higher(H,haO))+lower((O+H+L+C)/4,lower(L,haO)))/4;
haC=tema(haCl,5);// Smooth HaCl closing price
days = if(period/1.6 >= 1, period/1.6, 1);
haC = tema(haCl,days);// MA divisor
days2 = if(period*5 >= 1, period*5, 5);
vave =Ref(Mov(C,days2,S),-1);// Basic trend
vtr = tema(lrs(C,period),period);// SVAPO - result of price only
SVAPO2=Tema(Sum(If(haC>(Ref(haC,-1)*(1+cutoff/1000))
AND HadAlert(vtr>=Ref(vtr,-1),2), C, If(haC<(Ref(haC,-1)*(1-cutoff/1000))
AND HadAlert(vtr>Ref(vtr,-1),2),-C,0)),period)/(vave+1),period);
![]() NINJA
TRADER: TRADING DIVERGENCES
NINJA
TRADER: TRADING DIVERGENCES
The zero-lagging exponential moving average indicator presented by Sylvain
Vervoort in his article in this issue, "Trading Medium-Term Divergences,"
is available for download at www.ninjatrader.com/SC/February 2008SC.zip.
Once downloaded, from within the NinjaTrader Control Center window,
select the menu File > Utilities > Import NinjaScript and select the downloaded
file. This indicator is for NinjaTrader Version 6.5 or greater.
A sample chart is shown in Figure 8.

You can review the indicator's source code by selecting the menu Tools > Edit NinjaScript > Indicator from within the NinjaTrader Control Center window and selecting ZeroLagEma.FIGURE 8: NINJATRADER, R-SQUARED AND LINEAR REGRESSION SLOPE. This NinjaTrader screenshot shows both the r-squared and linear regression slope indicators on a one-minute S&P Emini December 2007 chart.
NinjaScript indicators are compiled DLLs that run native, not interpreted, which provides you with the highest performance possible.
--Raymond Deux
NinjaTrader, LLC
www.ninjatrader.com
![]() OMNITRADER:
TRADING DIVERGENCES
OMNITRADER:
TRADING DIVERGENCES
We offer two indicators based on the article in this issue by Sylvain Vervoort, "Trading Medium-Term Divergences": a zero-lag exponential moving average (ZeroLaggingEMA.txt) and a modified short-term volume and price oscillator (SVAPOModified.txt).
As discussed in Vervoort's article, these indicators can be used to better identify divergence-based trading opportunities (Figure 9).
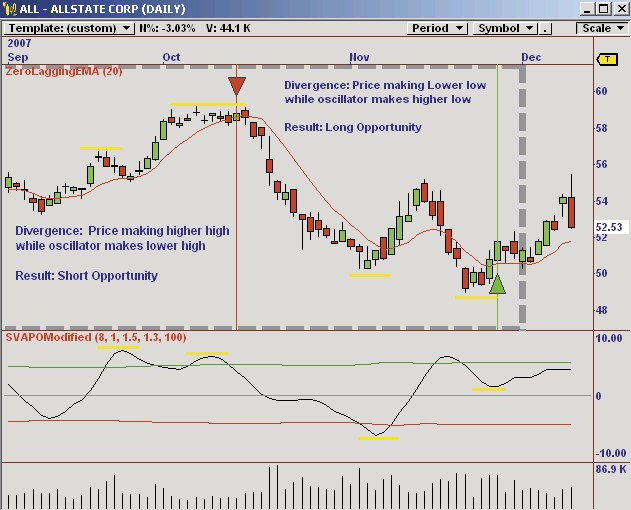
To use the indicators, first copy the files "ZeroLaggingEMA.txt" and "SVAPOModified.txt" to the Indicators subdirectory of C:\Program Files\ Nirvana\ OT2007\ VBA\. Next, open OmniTrader and click Edit:OmniLanguage. You should see the files in the indicators section of the Project Pane. Click compile. Now the new code is ready to use.FIGURE 9: OMNITRADER, TRADING DIVERGENCES. Here is a daily price chart of ALL showing two divergences between price and the modified SVAPO indicator.
For more information and complete source code, visit https://www.omnitrader.com/ProSI.
--Jeremy Williams, Trading Systems Researcher
Nirvana Systems, Inc.
www.omnitrader.com,
www.nirvanasystems.com
OmniTrader code:GO BACK#Indicator
'**************************************************************
'* Zero Lagging Exponential Moving Average (ZeroLaggingEMA.txt)
'* by Jeremy Williams
'* � Dec. 10, 2007
'*
'* Adapted from Technical Analysis of Stocks & Commodities magazine
'* February 2008
'*
'* Summary:
'* This indicator uses differencing to improve the lag
'* characteristics of the exponential moving average. For
'* more information see "Trading Divergences" in the February
'* 2008 issue of Technical Analysis of Stocks and Commodities.
'*
'* Parameters:
'*
'* Periods - Specifies the number of periods for the calculation
'**************************************************************
#Param "Periods",20Dim EMA1 As Single
Dim EMA2 As Single
Dim Difference As Single
Dim indValue As Single' Calculate the Value of the indicator
EMA1 = EMA(Periods)
EMA2 = EMA(EMA1,Periods)
Difference = EMA1 - EMA2
indValue = EMA1 + Difference' Plot the value calculated by the indicator in the price pane
PlotPrice("Zero Lag EMA", indValue)' Return the value calculated by the indicator
Return indValue#Indicator
'**********************************************************************
'* Short-Term Volume and Price Oscillator (SVAPOModified.txt)
'* Modified for use without volume data
'* by Jeremy Williams
'* � Dec. 10, 2007
'*
'* Adapted from Technical Analysis of Stocks & Commodities
'* February 2008
'*
'* Summary:
'*
'* This indicator is based on the Short-Term Volume and Price
'* Oscillator by Sylvain Vervoort in the November 2007 issue of
'* Technical analysis of stocks and commodities. It has been modified
'* for the February 2008 article to be used without volume data.
'* For more information see "Trading Divergences" in the February 2008
'* issue of Technical Analysis of Stocks and Commodities.
'*
'* Parameters:
'*
'* SVAPOPeriod-Specifies the number of periods for SVAPO calculation
'*
'* Cutoff-Specifies the minimal price movement
'*
'* SDHigh-Specifies the number of Standard deviations for the top band
'*
'* SDLow-Specifies the number of Standard deviations for the low band
'*
'* SDPeriod-Specifies the number of periods for the Standard Deviation
'*
'**********************************************************************
#Param "SVAPOPeriod", 8
#Param "Cutoff" , 1
#Param "SDHigh", 1.5
#Param "SDLow", 1.3
#Param "SDPeriod" , 100
Dim haOpen As Single
Dim haClose As Single
Dim haHigh As Single
Dim haLow As Single
Dim haC As Single
Dim haEMA1 As Single
Dim haEMA2 As Single
Dim haEMA3 As Single
Dim VAvg As Single
Dim VMax As Single
Dim Vc As Single
Dim VSlope As Single
Dim VEMA1 As Single
Dim VEMA2 As Single
Dim VEMA3 As Single
Dim VTrend As Single
Dim Downward As Single
Dim Total As Single
Dim mySum As Single
Dim indEMA1 As Single
Dim indEMA2 As Single
Dim indEMA3 As Single
Dim mySD As Single
Dim indValue As Single
Dim UpperBand As Single
Dim LowerBand As Single' Calculate the Heiken Ashi variables
haOpen = (O[1] + H[1] + L[1] + C[1])*.25
haHigh = IIF( haOpen > H ,haOpen, H)
haLow = IIF (haOpen < L , haOpen, L)
haClose = (( o + h + l + c) * .25 + haOpen + haHigh +haLow)*.25
haEMA1 = EMA (haClose,SVAPOPeriod / 1.6)
haEMA2 = EMA (haEMA1, SVAPOPeriod / 1.6)
haEMA3 = EMA (haEMA2, SVAPOPeriod / 1.6)
haC = 3*haEMA1 - 3*haEMA2 + haEMA3' Calculate the Volume Statistics and Volume Trend
' Here we are using price data to mimmick volume.
VAvg = SMA( C, SVAPOPeriod * 5)
VMax = 2*VAvg[1]
Vc = C
VSlope = LNREG_SLOPE(C,SVAPOPeriod)
VEMA1 = EMA(VSlope , SVAPOPeriod)
VEMA2 = EMA(VEMA1, SVAPOPeriod)
VEMA3 = EMA(VEMA2, SVAPOPeriod)
VTrend = 3*VEMA1 -3*VEMA2 + VEMA3'Calculate the sum for the SVAPO
Downward = IIF( haC<haC[1]*(1-Cutoff/1000) AND _
(VTrend > VTrend[1] OR VTrend[1]>VTrend[2]), 0 - Vc , 0 )
Total = IIF( haC > haC[1]*(1+Cutoff/1000) AND _
(VTrend>=VTrend[1] OR VTrend[1] >= VTrend[2]), Vc , Downward)
mySum = SUM(Total,SVAPOPeriod)/(VAvg+1)' After warm-up, calculate the TEMA
If bar > 10*SVAPOPeriod + 5 Then
indEMA1 = EMA(mySum, SVAPOPeriod)
indEMA2 = EMA(indEMA1, SVAPOPeriod)
indEMA3 = EMA(indEMA2, SVAPOPeriod)
indValue = 3*indEMA1 - 3*indEMA2 + indEMA3
Else
indValue = 0
End If' After Warm-up period, calculate the Bands
If bar > SDPeriod + 2*SVAPOPeriod +1 Then
mySD = StD(indValue, SDPeriod)
UpperBand = mySD*SDHigh
LowerBand = 0-mySD*SDLow
End If' Plot the Bands
Plot("SVAPO(Mod)", indValue)
Plot("Upper Band", UpperBand)
Plot("Lower Band", LowerBand)' Return the value calculated by the indicator
Return indValue
![]() TRADINGSOLUTIONS:
TRADING DIVERGENCES
TRADINGSOLUTIONS:
TRADING DIVERGENCES
In his article in this issue, "Trading Medium-Term Divergences," Sylvain Vervoort discusses trading divergences between prices and indicators. Two of the indicators he discusses are the zero-lag EMA and a price-only version of the SVAPO (short-term volume and price oscillator).
The coding for these functions is shown here. They are also available as a function file that can be downloaded from the TradingSolutions website (www.tradingsolutions.com) in the "free systems" section. As with many indicators, these functions could make good inputs to neural network predictions.
Function Name: SVAPO (Price Only)--Gary Geniesse
Short Name: SVAPO_PriceOnly
Requires: SVAPO_VTR from November 2007 Traders' Tip
Inputs: Period, Clipping Period, Minimum %o Price Change, Open, High, Low, Close
EMA (EMA (EMA (Div (Sum (If (And (GT (haClose (Open, High, Low ,Close), Mult (Lag (haClose (Open, High, Low, Close), 1), Add (1, Div (Minimum %o Price Change ,1000)))), WasTrue (GE (SVAPO_VTR (Close, Period),Lag (SVAPO_VTR (Close, Period),1)),2)), Close, If (And (LT (haClose (Open, High, Low, Close), Mult (Lag (haClose (Open, High, Low, Close), 1) ,Sub (1, Div (Minimum %o Price Change, 1000)))), WasTrue (GT (SVAPO_VTR (Close ,Period),Lag (SVAPO_VTR (Close, Period), 1)), 2)), Negate (Close), 0)),Period), Add (Lag (MA (Close, Clipping Period), 1), 1)), Period), Period), Period)Function Name: Moving Average (Exponential, Zero-Lag)
Short Name: EMA_ZeroLag
Inputs: Data, Period
Add (EMA (Data, Period), Sub (EMA (Data, Period), EMA (EMA (Data, Period), Period))Function Name: Trailing Stop Reversal
Short Name: TrailStopRev
Inputs: Close, Trailing Stop
If (EQ (Close, Prev (1)), Prev (1),If (And (LT (Lag (Close, 1), Prev (1)), LT (Close, Prev (1))), Min (Prev (1), Mult (Close, Add (1, Div (Trailing Stop, 100)))),If (And (GT (Lag (Close,1), Prev (1)),GT (Close, Prev (1))), Max (Prev (1), Mult (Close, Sub (1, Div (Trailing Stop, 100)))), If (GT (Close, Prev (1)), Mult (Close, Sub (1, Div (Trailing Stop, 100))), Mult (Close, Add (1, Div (Trailing Stop, 100)))))))
NeuroDimension, Inc.
800 634-3327, 352 377-5144
www.tradingsolutions.com
![]() SWINGTRADER:
TRADING DIVERGENCES
SWINGTRADER:
TRADING DIVERGENCES
The SVAPO (short-term volume and price oscillator) price-only indicator and zero-lagging EMA overlay have been introduced in SwingTracker 5.13.086 based on "Trading Medium-Term Divergences" by Sylvain Vervoort in this issue.
A sample chart is shown in Figure 10.
![]()
FIGURE 10: SWINGTRADER, The parameters and their default values are shown in the preferences window screenshots here.
Here is the preferences window for the SVAPO price-only indicator
in SwingTracker:
![]()
Here is the preferences window for the zero-lagging EMA:
![]()
To discuss these tools, visit forum.mrswing.com. Our development staff will be happy to assist at support.mrswing.com. For more information on our free trial, visit www.swingtracker.com.
--Larry Swing
www.mrswing.com
theboss@mrswing.com
+1 (281) 968-2718
![]() VT
TRADER: SVAPO, ZERO-LAG MOVING AVERAGE, and TRAILING STOP REVERSAL INDICATOR
VT
TRADER: SVAPO, ZERO-LAG MOVING AVERAGE, and TRAILING STOP REVERSAL INDICATOR
Sylvain Vervoort's article in this issue, "Trading Medium-Term Divergences," discusses the merits of identifying medium-term price-indicator divergences and convergences as part of a more complex trading strategy. Vervoort goes on to discuss the other supporting indicators used in the trading strategy, including a price-only version of the SVAPO; the zero-lag exponential moving average; symmetrical trailing stop reversal indicator; the RSI; support and resistance lines; and trendlines.
We'll be offering the price-only SVAPO indicator, the zero-lag moving average, and the trailing stop reversal indicator for download in our user forums.
The VT Trader code and instructions for recreating each of the aforementioned indicators are as follows:
Price-Only SVAPO
1. Navigator Window>Tools>Indicator Builder>[New] button
2. In the Indicator Bookmark, type the following text for each field:
Name: TASC - 02/2008 - "Trading Divergences" (SVAPO - Price Only)
Short Name: vt_SVAPO_PO
Label Mask: TASC - 02/2008 - "Trading Divergences" (SVAPO - Price
Only (%price%, %period%, %cutoff%, %devH%, %devL%, %stdevper%))
Placement: New Frame
Inspect Alias: SVAPO_PO
3. In the Input Bookmark, create the following variables:
[New] button... Name: price , Display Name: SVAPO Price , Type: price
, Default: close
[New] button... Name: period , Display Name: SVAPO Periods , Type:
integer , Default: 8
[New] button... Name: cutoff , Display Name: Minimum Per 10K % Price
Change , Type: float , Default: 1
[New] button... Name: devH , Display Name: Standard Deviation High
, Type: float , Default: 1.5
[New] button... Name: devL , Display Name: Standard Deviation Low ,
Type: float , Default: 1.3
[New] button... Name: stdevper , Display Name: Standard Deviation Periods
, Type: integer , Default: 100
4. In the Output Bookmark, create the following variables:
[New] button...
Var Name: SVAPO
Name: (SVAPO)
Line Color: dark green
Line Width: slightly thicker
Line Type: solid line
[New] button...
Var Name: StDevH
Name: (StDevH)
Line Color: dark green
Line Width: thin
Line Type: dashed line
[New] button...
Var Name: StDevL
Name: (StDevL)
Line Color: dark green
Line Width: thin
Line Type: dashed line
5. In the Horizontal Line Bookmark, create the following variables:
[New] button...
Value: +0.0000
Color: red
Width: thin
Style: dashed line
6. In the Formula Bookmark, copy and paste the following formula:
{Provided By: Visual Trading Systems, LLC & Capital Market
Services, LLC (c) Copyright 2008}
{Description: SVAPO indicator - Modified to calculate Price only}
{Notes: February 2008 Issue - "Trading Divergences"}
{vt_SVAPO_PO Version 1.0}
{Smooth HA Closing Price}
SmoothHaC:= vt_tema(haC,period/1.6,E);
{Medium term MA division factor}
vave:= ref(mov(price,period*5,S),-1);
{Basic Trend}
vtr:= vt_tema(LinRegSlope(price,period),period,E);
{SVAPO Result of Price Only}
SVAPO:= vt_tema(
sum(if(SmoothHaC>(ref(SmoothHaC,-1)*(1+cutoff/10000)) AND
BarsSince(vtr>=ref(vtr,-1))<=2,price, if(SmoothHaC<(ref(SmoothHaC,-1)*(1-cutoff/10000))
AND BarsSince(vtr>ref(vtr,-1))<=2,-price,0)),period)/(vave+1),period,E);
StDevH:= devH*StDev(SVAPO,stdevper);
StDevL:= -devL*StDev(SVAPO,stdevper);
7. Click the "Save" icon to finish building the Price-Only SVAPO indicator.
To attach the price-only SVAPO indicator to a chart, click the right mouse button within the chart window and then select "Add Indicators" -> "TASC -- 02/2008 -- " Trading Divergences" (SVAPO -- Price Only)" from the indicator list.
Zero-Lag Moving Average
1. Navigator Window>Tools>Indicator Builder>[New] button
2. In the Indicator Bookmark, type the following text for each field:
Name: TASC - 02/2008 - "Trading Divergences" (Zero-Lag Moving Average)
Short Name: vt_ZLMA
Label Mask: TASC - 02/2008 - "Trading Divergences" (Zero-Lag Moving
Average (%price%, %period%, %matype%))
Placement: Price Frame
Inspect Alias: ZLMA
3. In the Input Bookmark, create the following variables:
[New] button... Name: price , Display Name: Zero-Lag MA Price , Type:
price , Default: close
[New] button... Name: period , Display Name: Zero-Lag MA Periods ,
Type: integer , Default: 20
[New] button... Name: matype , Display Name: Zero-Lag MA Type, Type:
MA Type , Default: Exponential
4. In the Output Bookmark, create the following variables:
[New] button...
Var Name: ZLMA
Name: (Zero-Lag MA)
Line Color: red
Line Width: slightly thicker
Line Type: solid line
5. In the Formula Bookmark, copy and paste the following formula:
{Provided By: Visual Trading Systems, LLC & Capital Market
Services, LLC (c) Copyright 2008}
{Description: Zero-Lag Moving Average}
{Notes: February 2008 Issue - "Trading Divergences"}
{vt_ZLMA Version 1.0}
MA1:= mov(price,period,matype);
MA2:= mov(MA1,period,matype);
Difference:= MA1 - MA2;
ZLMA:= MA1 + Difference;
6. Click the "Save" icon to finish building the zero-lag moving average indicator.
To attach the zero-lag MA to a chart, click the right mouse button within the chart window and then select "Add Indicators" -> "TASC -- 02/2008 -- " Trading Divergences" (Zero-Lag Moving Average)" from the indicator list.
Trailing Stop Reversal Indicator
1. Navigator Window>Tools>Indicator Builder>[New] button
2. In the Indicator Bookmark, type the following text for each field:
Name: TASC - 02/2008 - "Trading Divergences" (Trailing Stop Reversal)
Short Name: vt_TSR
Label Mask: TASC - 02/2008 - "Trading Divergences" (Trailing Stop Reversal
(%price%, %stop%))
Placement: Price Frame
Inspect Alias: TSR
3. In the Input Bookmark, create the following variables:
[New] button... Name: price , Display Name: Trailing Stop Price , Type:
price , Default: close
[New] button... Name: stop , Display Name: Trailing Stop Percentage,
Type: float (with bounds) , Default: 1, Min Bounds: 0.0000, Max Bounds:
99.0000
4. In the Output Bookmark, create the following variables:
[New] button...
Var Name: TSR
Name: (Trailing Stop Reversal)
Line Color: blue
Line Width: thin
Line Type: dashed line
5. In the Formula Bookmark, copy and paste the following formula:
{Provided By: Visual Trading Systems, LLC & Capital Market
Services, LLC (c) Copyright 2008}
{Description: Trailing Stop Reversal Indicator}
{Notes: February 2008 Issue - "Trading Divergences"}
{vt_TSR Version 1.0}
TSR:= if(price=PREV,PREV,
if(((ref(price,-1)<PREV) AND (price<PREV)),min(PREV,price*(1+stop/100)),
if((ref(price,-1)>PREV) AND (price>PREV),max(PREV,price*(1-stop/100)),
if(price>PREV,price*(1-stop/100),price*(1+stop/100)))));
6. Click the "Save" icon to finish building the Trailing Stop Reversal indicator.
To attach the Trailing Stop Reversal indicator to a chart, click the right mouse button within the chart window and then select "Add Indicators" -> "TASC -- 02/2008 -- " Trading Divergences" (Trailing Stop Reversal)" from the indicator list.
A sample chart is shown in Figure 11.
To learn more about VT Trader, please visit www.cmsfx.com.
-- Chris Skidmore, CMS Forex
(866) 51-CMSFX, trading@cmsfx.com
www.cmsfx.com
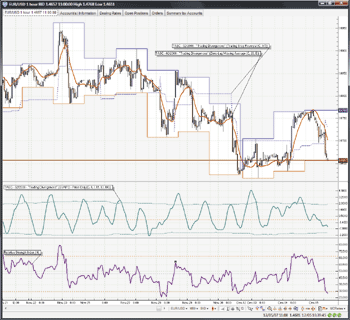
GO BACKFIGURE 11: VT TRADER. Here is a sample EUR/USD 30-minute candle chart with the modified SVAPO, zero-lag MA, trailing stop reversal, and RSI indicators.
Originally published in the February 2008 issue of Technical Analysis of STOCKS & COMMODITIES magazine. All rights reserved. �(c) Copyright 2008, Technical Analysis, Inc.