Novice Traders’ Notebook
Indicators
4. On Balance Volume (OBV)
What is OBV and how is it used?
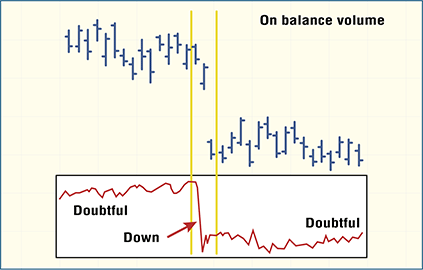
OBV or On Balance Volume is an indicator which sums volume bar by bar. If the price is up for the bar, the volume is added to the running sum; if the bar closes down from the previous bar, the volume for the bar is subtracted from the running sum.

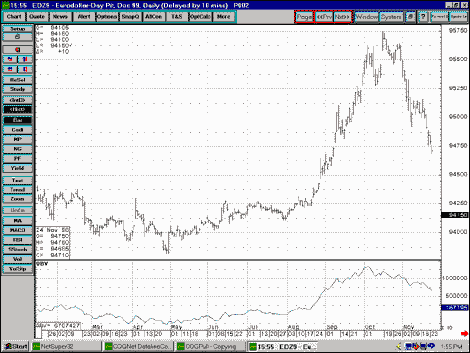
The indicator is best used to define breakouts from price patterns. For example the figure below shows Eurodollars basing in the 9400–9425 range during early 1998. OBV declined into its own base during that period but broke above that level in mid-June. Then it continued to gain ground through July. Indeed it wasn’t until mid-August that Euros decisively broke the 9425 level.

On the same chart, OBV peaked in early October while prices peaked in mid-October, indicating that volume was not supporting further upside moves. Subsequently, OBV broke its neckline of support while prices were still at 9512, about two weeks before prices broke 9500 in the third week of November.
As a running sum, OBV isn’t a precision indicator but it is a valuable guide to the general trend of price movement.