TRADING SYSTEMS
Three, Two, One ... Liftoff!
You’ve heard it time and time again: You need to have a trading plan. But how do you create one? You have to start somewhere, and here’s one system that can lift you into the world of system traders.
Thousands of trading systems are available in the marketplace today; some are relatively inexpensive to buy or lease, while others cost several thousand dollars or more. These systems can be based on volatility breakouts, moving average crossovers, neural networks, genetic optimization, oscillators, and linear regression. But no matter how plain or fancy the trading logic is for a system, all that matters are your answers to the following two questions:
If you can honestly answer “yes” to the first two questions, you might also want to ask yourself a third question, which is:

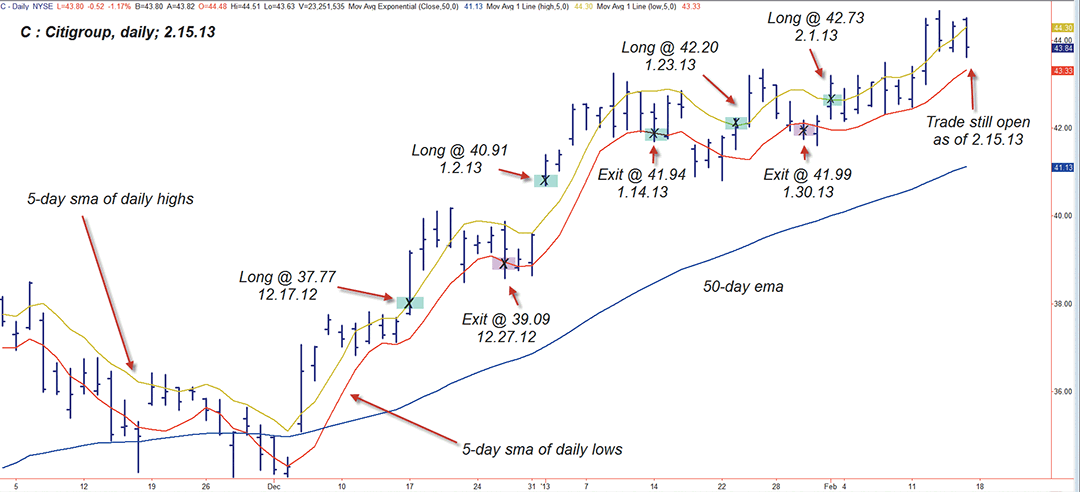
FIGURE 1: THE THREE-INDICATOR TRADING TEMPLATE. In this sample daily chart of Citigroup (C), out of the four most recent long trade entries, two closed out for a gain, one resulted in a small loss, and the last trade is still open. Taking entries when their direction is aligned with the trend bias of the 50-period EMA seems to be effective in historic testing.