CHARTING
The Grand Finale!
Applying The IRSTS Swing Trading Rules
by Sylvain Vervoort
This seven-part series has thus far provided the components of the indicator rules for a swing trading strategy (IRSTS), from color-coding candlesticks to smoothing oscillators to creating an expert system. Now that all of the components have been detailed, here’s how you can put this swing trading strategy to use in your trading.
In this seventh and final part of my series on indicator rules for a swing trading strategy (IRSTS), I will show you how you can apply the IRSTS rules to make trading decisions. But before diving into it, I’ll first review some general trading guidelines and principles.
GENERAL TRADING GUIDELINES
- Trading long and short: It’s as easy to trade a short position as it is a long position. Trading long means buying a stock in anticipation of a price rise. You want to make a profit when the stock price rises by selling it at a higher price. When you trade a short position, you are essentially selling a stock that you do not have in your possession. In other words, you are borrowing the stock. You make money when the stock price goes down by buying the stock back at a lower price, closing the lending transaction. Please keep in mind it is much more difficult to make money trading short because while a stock can drop only 100%, there is no limit to how far it can rise.
- Spread the risk: Trading a single stock or bond of a company is risky. If that company goes broke, all your money is lost.
- Compound profits: One of the most powerful money-making tactics is compounding profits. This means that you must reinvest at least part, if not all, of your profits in upcoming trades.
- Risk and money management: To protect your account, you must use some kind of risk management. This can be done by using stop-loss settings or by building risk management into your trading system. Eventually, you must use a good money management method if you are trading several items in your portfolio. For example, do not risk more than 2% of your total portfolio value in a single trade and do not risk more than 15% loss on the value of a single trade (depending on the underlying stock and the trading period).

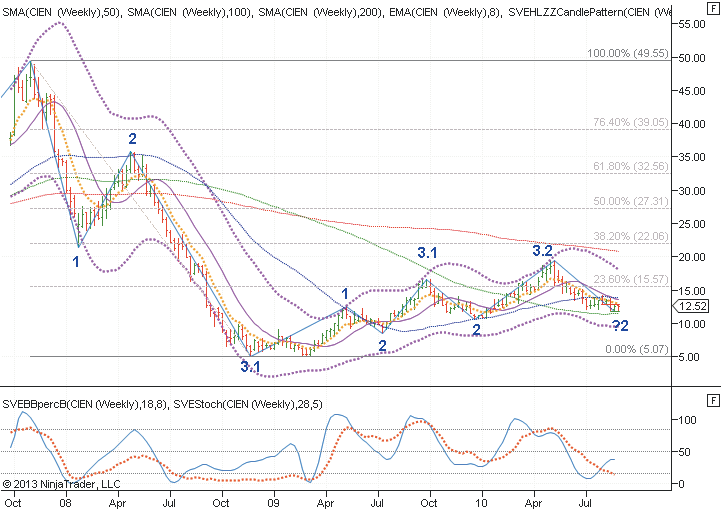
FIGURE 1: START BY LOOKING AT THE BIG PICTURE. It is important to have a long-term view of what you are trading before placing your trades. From this chart you can see where the long-term top was, the 1-2-3 wave pattern, support/resistance levels, and whether price moves are supported by oscillators. There’s enough here that indicates a continuation of the ongoing trend.
Excerpted from an article originally published in the November
2013 issue of Technical Analysis of Stocks & Commodities magazine. All rights reserved. © Copyright 2013, Technical Analysis, Inc.
Return to Contents
