TRADERS’ TIPS
November 2013

For this month’s Traders’ Tips, the focus is Johnny Dough’s article in this issue, “Reversing MACD: The Sequel.” Here we present the November 2013 Traders’ Tips code with possible implementations in various software.
Code for AmiBroker is already provided in Dough’s article. Subscribers will find that code at the Subscriber Area of our website. (Click on “Article Code” from the S&C menu.) Presented here is an overview of possible implementations for other software.
Traders’ Tips code is provided to help the reader implement a selected technique from an article in this issue. The entries are contributed by various software developers or programmers for software that is capable of customization.

TRADESTATION: NOVEMBER 2013
In “Reversing MACD: The Sequel” in this issue, author Johnny Dough describes the calculation of the price during formation of the next bar where the MACD histogram crosses zero on the next bar. We are providing two functions, two indicators, and a strategy. One function (_PMACDLevel2) returns the next bar price required to achieve a particular MACD value (for example, zero, current bar MACD value, and so on). The other function (_PMACDsignal) returns the next bar price required for the MACD histogram to be zero. One indicator (_PMACD_Ind3) plots the PMACDeq, PMACDzero, and PMACDsignal values referred to in the article. These plots can be shown or not shown based on the indicator inputs.
The second indicator (sMACD) is an MACD indicator that uses simple moving averages instead of exponential moving averages. The strategy provided here issues a buy or sell-short stop order at the PMACDsignal price (that is, the price where the histogram is zero).
This strategy is for illustrative purposes only and is not intended to be traded.
To download the EasyLanguage code, please visit our TradeStation and EasyLanguage support forum. The code from this article can be found here: https://www.tradestation.com/TASC-2013. The ELD filename is “_PMACD_Sequel.ELD.”
The EasyLanguage code for the function _PMACDLevel2, indicator _PMACD_Ind3, indicator _sMACD, and strategy_ PMACD_Strategy2 can also be found below.
_PMACDLevel2 (Function)

{ TASC Article - November 2013 }
{ Reversing MACD: The Sequel }
{ Johnny Dough }

{
this function is titled _PMACDLevel2 because a prior
function named _PMACDlevel was developed for the
January 2012 TASC article referred to in the November
2013 article; the _PMACDlevel function can be
downloaded from the TradeStation forum at the
following link:

https://community.tradestation.com/Discussions
/Topic.aspx?Topic_ID=116668
}

inputs:
	double MACDValue( numericseries ), { MACD value to
	 use in calculating the price level that will
	 result in this MACD value; for example, to
	 determine what price level on the next bar will
	 result in a MACD value of zero, pass in zero for
	 this input }
	double MACDPrice( numericseries ), { price used in
	 MACD calculations }
	double p_fast( numericsimple ), { fast moving
	 average length for MACD }
	double p_slow( numericsimple ), { slow moving
	 average length for MACD }
	int p_matype( numericsimple) ; { pass in 1 for
	 EMA; any other value for SMA }

variables:
	intrabarpersist double alphaX( 0 ),
	intrabarpersist double alphaY( 0 ),
	intrabarpersist double One_alphaX( 0 ),
	intrabarpersist double One_alphaY( 0 ),
	double FastSMA( 0 ),
	double SlowSMA( 0 ),
	double RtnPrice( 0 ),
	double sRtnPrice( 0 ) ;

once
	begin
	{ calculate smoothing factors; it is assumed that
	  these values are constant on each bar (i.e., the
	  lengths p_fast and p_slow are not changed) }
	alphaX = 2 / ( 1 + p_fast ) ;
	alphaY = 2 / ( 1 + p_slow ) ;
	One_alphaX = 1 - alphaX ;
	One_alphaY = 1 - alphaY ;

	Value99 = _PMACDLevel2[1] ; { force this function
	 to be a series function since the EMA depends on
	 the prior bar value }
	end ;

{
calculate the price level on the next bar where the
calculated MACD Value for that price is equal to the
"MACDValue" input value ( when using Exponential
Moving Averages )
}
RtnPrice = ( MACDValue + XAverage( MACDPrice, p_slow )
 * One_alphaY - XAverage( MACDPrice, p_fast )
 * One_alphaX ) / ( alphaX - alphaY ) ;

{
calculate the price level on the next bar where the
calculated MACD Value for that price is equal to the
"MACDValue" input value ( when using Simple Moving
Averages )
}
if p_matype <> 1 then
	begin
	FastSMA = Average( MACDPrice, p_fast ) ;
	SlowSMA = Average( MACDPrice, p_slow ) ;

	Value1 = ( FastSMA * p_fast ) -
	 MACDPrice[p_fast-1] ;
	Value2 = ( SlowSMA * p_slow ) -
	 MACDPrice[p_slow-1] ;

	sRtnPrice = ( p_fast * p_slow * MACDValue - p_slow
	 * Value1 + p_fast * Value2 ) /
	 ( p_slow - p_fast ) ;

	end ;

{ return the appropriate value based on moving average
  type passed in via "p_matype" input }
if p_matype = 1 then { return value when using
 Exponential Moving Averages }
	_PMACDLevel2 = RtnPrice
else { return value when using Simple Moving
 Averages }
	_PMACDLevel2 = sRtnPrice ;


_PMACDsignal (Function)

{ TASC Article - November 2013 }
{ Reversing MACD: The Sequel }
{ Johnny Dough }

inputs:
	double MACDPrice( numericseries ), { price used
	 in MACD calculations }
	double p_fast( numericsimple ), { fast moving
	 average length for MACD }
	double p_slow( numericsimple ), { slow moving
	 average length for MACD }
	double p_signal( numericsimple ), { moving average
	 length for MACD Signal }
	int p_matype( numericsimple) ; { moving average
	 type - pass in 1 for EMA; any other value for
	 SMA }

variables:
	intrabarpersist double alphaX( 0 ),
	intrabarpersist double alphaY( 0 ),
	intrabarpersist double alphaZ( 0 ),
	intrabarpersist double XY( 0 ),
	intrabarpersist double XZ( 0 ),
	intrabarpersist double YZ( 0 ),
	intrabarpersist double XYZ( 0 ),
	intrabarpersist double One_alphaX( 0 ),
	intrabarpersist double One_alphaY( 0 ),
	intrabarpersist double One_alphaZ( 0 ),
	double MACDsignal( 0 ),
	double sMACD( 0 ),
	double RtnPrice( 0 ),
	double sRtnPrice( 0 ) ;

once
	begin
	{
	calculate smoothing factors; it is assumed that
	these values are constant on each bar
	(i.e., p_fast, p_slow, and p_signal lengths are
	constant on each bar and are not changed)
	}
	alphaX = 2 / ( 1 + p_fast ) ;
	alphaY = 2 / ( 1 + p_slow ) ;
	alphaZ = 2 / ( 1 + p_signal ) ;
	One_alphaX = 1 - alphaX ;
	One_alphaY = 1 - alphaY ;
	One_alphaZ = 1 - alphaZ ;
	XY = p_fast * p_slow ;
	XZ = p_fast * p_signal ;
	YZ = p_slow * p_signal ;
	XYZ = p_fast * p_slow * p_signal ;

	Value99 = _PMACDsignal[1] ; { force function to be
	 a series function since the EMA depends on the
	 prior bar value }
	end ;

{ calcualte price level where MACD Value is equal to
  the MACD signal value ( histogram = 0 ) using
  Exponential Moving Averages }
MACDsignal = XAverage( MACD( MACDPrice, p_fast,
 p_slow ), p_signal ) ;
RtnPrice = ( MACDsignal - XAverage( MACDPrice,
 p_fast ) * One_alphaX + XAverage( MACDPrice, p_slow )
 * One_alphaY ) / ( alphaX - alphaY ) ;

{ calculate price level on the next bar where MACD
  Value is equal to the MACD signal value
  ( histogram = 0 ) using Simple Moving Averages }
if p_matype <> 1 and p_signal > 1 then
	begin

	sMACD = Average( MACDPrice, p_fast ) -
	 Average( MACDPrice, p_slow ) ;

	sRtnPrice = ( sMACD * ( XYZ - XY ) - XYZ *
	 Average( sMACD, p_signal ) -
	 MACDPrice[p_fast - 1] * ( YZ - p_slow ) +
	 MACDPrice[p_slow - 1] * ( XZ - p_fast ) +
	 XY * sMACD[p_signal - 1] ) /
	 ( XZ - YZ - p_fast + p_slow ) ;

	end ;

{ return the appropriate value based on moving average
 type passed in }
if p_matype = 1 then { return value when using
 Exponential Moving Averages }
	_PMACDsignal = RtnPrice
else { return value when using Simple Moving
 Averages }
	_PMACDsignal = sRtnPrice ;


_PMACD_Ind3 (Indicator)

{ TASC Article - November 2013 }
{ Reversing MACD: The Sequel }
{ Johnny Dough }

{
this indicator is titled ...Ind3 because 2 other PMACD
indicators were developed for the January 2012 TASC
article referred to in the November 2013 article;
these indicators can be downloaded from the
TradeStation forum at the following link:

https://community.tradestation.com/Discussions/
Topic.aspx?Topic_ID=116668
}

inputs:
	double MACDPrice( Close ), { price used in MACD
	 calculations }
	int FastLength( 12 ), { the shorter of the two
	 moving average lengths used to calculate the MACD
	 value, in bars }
	int SlowLength( 26 ), { the longer of the two
	 moving average lengths used to calculate the MACD
	 value, in bars }
	int MACDLength( 9 ), { the number of bars over
	 which to average the MACD value }
	int MAType( 1 ), { moving average type - pass in 1
	 for EMA; any other value for SMA }
	bool ShowPMACDeq( true ), { set to true to plot
	 the value of PMACDeq }
	bool ShowPMACDzero( true ), { set to true to plot
	 the value of PMACDzero }
	bool ShowPMACDsignal( true ) ; { set to true to
	 plot the value of PMACDsignal }

variables:
	double MACDValue( 0 ),
	double PMACDeq( 0 ),
	double PMACDzero( 0 ),
	double PMACDsignal( 0 ) ;

MACDValue = MACD( MACDPrice, FastLength,
 SlowLength ) ;

{ use SMA if MAType is not set to 1 }
if MAType <> 1 then
   MACDValue = Average( MACDPrice, FastLength ) -
    Average( MACDPrice, SlowLength ) ;

{
the functions called below are series function and are
therefore called on each bar regardless of whether
they are placed behind any conditional statements or
not; therefore, they are not placed behind any
conditional statements
}
PMACDeq = _PMACDLevel2( MACDValue, MACDPrice,
 FastLength, SlowLength, MAType ) ;

PMACDzero = _PMACDLevel2( 0, MACDPrice, FastLength,
 SlowLength, MAType ) ;

PMACDsignal = _PMACDsignal( MACDPrice, FastLength,
 SlowLength, MACDLength, MAType ) ;

{ plots; note that the plots are displaced forward 1
  bar because the values returned from the functions
  above are "next bar" price values }
if ShowPMACDeq then
	Plot1[-1]( PMACDeq, "PMACDeq" ) ;

if ShowPMACDzero then
	Plot2[-1]( PMACDzero, "PMACDzero" ) ;

if ShowPMACDsignal then
	Plot3[-1]( PMACDsignal, "PMACDsig" ) ;


_sMACD (Indicator)

{ TASC Article - November 2013 }
{ Reversing MACD: The Sequel }
{ Johnny Dough }

{ MACD indicator using Simple Moving Averages }

inputs:
	double Price( Close ), { price used in MACD
	 calculations }
	int FastLength( 12 ), { the shorter of the two
	 simple moving average lengths used to calculate
	 the MACD value, in bars }
	int SlowLength( 26 ), { the longer of the two
	 simple moving average lengths used to calculate
	 the MACD value, in bars }
	int MACDLength( 9 ), { the number of bars over
	 which to average the MACD value }
	int MACDDiff_Up_Color( Green ), { color to be used
	 to plot positive values of MACDDiff }
	int MACDDiff_Down_Color( Red ), { color to be used
	 to plot negative values of MACDDiff }
	int BackgroundColorAlertCell( DarkGray ) ; { if
	 alert criteria are met, this is the color used
	 for the cell background in RadarScreen;  if it is
	 not desired for the cell background color to
	 change when the alert criteria are met, set this
	 input to the default cell background color }

variables:
	intrabarpersist bool PlotCrossBarsAgo( false ),
	double MyMACD( 0 ),
	double MACDAvg( 0 ),
	double MACDDiff( 0 ),
	double HistogramColor( 0 ),
	int CrossBarsAgo( 0 ) ;

once
	PlotCrossBarsAgo = GetAppInfo( aiApplicationType )
	 <> cChart ;

MyMACD = Average( Price, FastLength ) -
 Average( Price, SlowLength ) ;
MACDAvg = Average( MyMACD, MACDLength ) ;
MACDDiff = MyMACD - MACDAvg ;
HistogramColor = iff( MACDDiff > 0, MACDDiff_Up_Color,
 MACDDiff_Down_Color ) ;

if ( MACDDiff > 0 and MACDDiff[1] <= 0 ) or
( MACDDiff < 0 and MACDDiff[1] >= 0 ) then
	CrossBarsAgo = 0
else
	CrossBarsAgo += 1 ;

Plot1( MyMACD, "MACD" ) ;
Plot2( MACDAvg, "MACDAvg" ) ;
Plot3( MACDDiff, "MACDDiff", HistogramColor ) ;
if PlotCrossBarsAgo = false then
	Plot4( 0, "ZeroLine" )
else
	Plot5( CrossBarsAgo, "CrossBarsAgo",
	 HistogramColor ) ;

{ alert criteria }
if MACDDiff crosses over 0 then
	begin
	SetPlotBGColor( 5, BackgroundColorAlertCell ) ;
	Alert( "MACD diff. crossing over 0." ) ;
	end
else if MACDDiff crosses under 0 then
	begin
	SetPlotBGColor( 5, BackgroundColorAlertCell ) ;
	Alert( "MACD diff. crossing under 0." ) ;
	end ;

_ PMACD_Strategy2 (Strategy)

{ TASC Article - November 2013 }
{ Reversing MACD: The Sequel }
{ Johnny Dough }

{
note that this strategy is for illustrative purposes
only and is not meant to be traded; additionally, the
_PMACD_Strategy referenced below is for illustrative
purposes as well and is not meant to be traded
}


{
this strategy is titled _PMACD_Strategy2 because a
prior strategy named _PMACD_Strategy was developed for
the January 2012 TASC article referred to in the
November 2013 article; the _PMACD_Strategy strategy
can be downloaded from the TradeStation forum at the
following link:

https://community.tradestation.com/Discussions/
Topic.aspx?Topic_ID=116668
}

inputs:
	double MACDPrice( Close ), { price used in MACD
	 calculations }
	int FastLength( 12 ), { the shorter of the two
	 moving average lengths used to calculate the MACD
	 value }
	int SlowLength( 26 ), { the longer of the two
	 moving average lengths used to
	 calculate the MACD value }
	int MACDLength( 9 ), { the number of bars over
	 which to average the MACD value }
	int MAType( 1 ) ; { moving average type - set to 1
	 for EMA; set to any other value for SMA }

variables:
	double MyMACD( 0 ),
	double MACDAvg( 0 ),
	double MACDDiff( 0 ),
	double PMACDsignal( 0 ) ;

MyMACD = MACD( Close, FastLength, SlowLength ) ;
MACDAvg = XAverage( MyMACD, MACDLength ) ;

if MAType <> 1 then
	begin
	MyMACD = Average( MACDPrice, FastLength ) -
	 Average( MACDPrice, SlowLength ) ;
	MACDAvg = Average( MyMACD, MACDLength ) ;
	end ;

MACDDiff = MyMACD - MACDAvg ;

PMACDsignal = _PMACDsignal( MACDPrice, FastLength,
 SlowLength, MACDLength, MAType ) ;

{ entries }
{
note that this strategy uses a stop order for next bar
execution without using IntrabarOrderGeneration; thus,
a histogram cross of zero can occur intrabar, with a
corresponding strategy entry even though the cross may
not be present at the close of the bar when observing
the MACD indicator
}
if MACDDiff > 0 then { issue sell stop order for price
 of cross }
	SellShort ( "PMACDSig SE" ) next bar
	 PMACDsignal stop
else if MACDDiff < 0 then { issue buy stop order for
 price of cross }
	Buy ( "PMACDSig LE" ) next bar PMACDsignal stop	;

{ exits }
{ no exits coded; this strategy reverses }
For more information about EasyLanguage in general, please see https://www.tradestation.com/EL-FAQ.
A sample chart is shown in Figure 1.
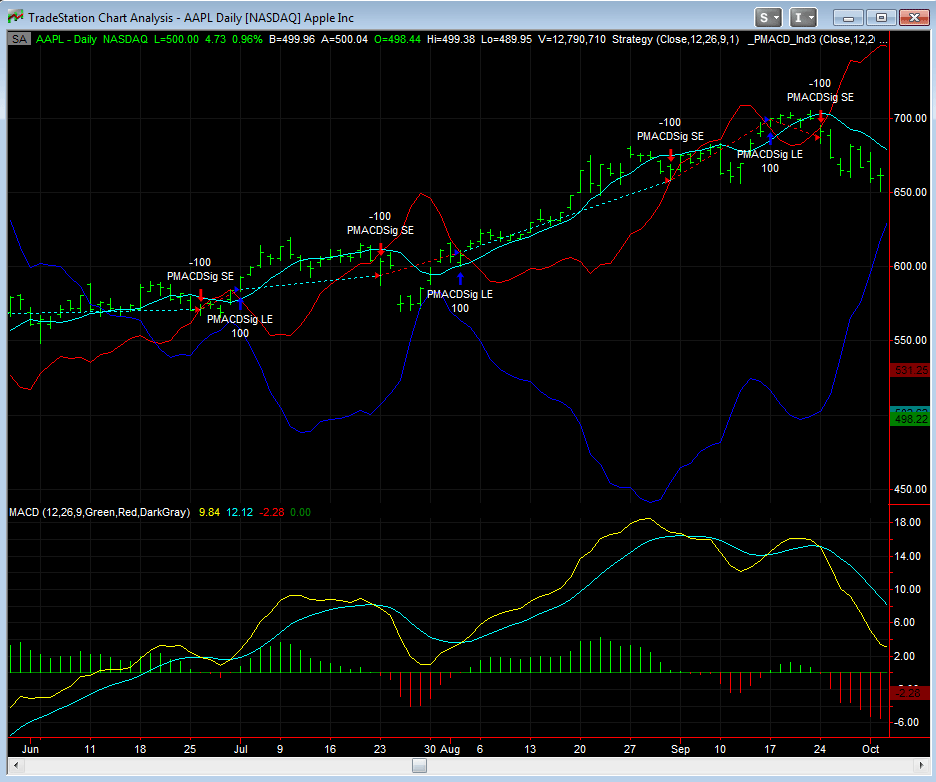
FIGURE 1: TRADESTATION. Here is a daily chart of AAPL with
the referenced indicator and strategy applied to the chart with the calculations
set to use exponential moving averages (set by the indicator and strategy inputs).
This article is for informational purposes. No type of trading or investment recommendation, advice, or strategy is being made, given, or in any manner provided by TradeStation Securities or its affiliates.
—Chris Imhof
TradeStation Securities, Inc.
www.TradeStation.com
BACK TO LIST

METASTOCK: NOVEMBER 2013
Johnny Dough’s article in this issue, “Reversing MACD: The Sequel,” presents additional formulas for getting the price required for the MACD to give a signal on the next bar. The article includes code for an all-in-one indicator. This indicator prompts for the MACD time periods and whether to use simple or exponential moving averages. It then plots the close required on the next bar for three different signals: 1) the MACD to equal zero, 2) the MACD to equal the value on the current bar, and 3) the MACD to cross its signal line. The MetaStock code for this indicator is shown here:
x:= Input("short term MA periods",1,50,12);
y:= Input("long term MA periods",2,50,26);
z:= Input("signal line periods",1,50,9);
type:= Input("MA type < 1=EMA | 2=SMA >",1,2,1);

ax:= 2/(x+1);
ay:= 2/(y+1);
az:= 2/(z+1);
cmacd:= Mov(C,x,E) - Mov(C,y,E);
smacd:= Mov(C,x,S) - Mov(C,y,S);

peflat:= (ax*Mov(C,x,E) - ay*Mov(C,y,E))/(ax-ay);
peeq0:= ((1-ay)*Mov(C,y,E) - (1-ax)*Mov(C,x,E))/(ax-ay);
pesig:= (Mov(cmacd,z,E) - (1-ax)*Mov(C,x,E) + (1-ay)*Mov(C,y,E))/(ax-ay);

psflat:= (x*Ref(C,-Y+1) - y*Ref(C,-x+1))/(x-y);
pseq0:= (x*y*(Mov(C,x,S)-Mov(C,y,S))+x*Ref(C,-y+1)-y*Ref(C,-x+1))/(x-y);
pssig:= ((x*y*z - x*y)*smacd - x*y*z*Mov(smacd,z,S) -
 (y*z - y)*Ref(C,-x+1) + (x*z-x)*Ref(C,-y+1) +
 x*y * Ref(smacd,-z+1) )/(x*z-y*z-x+y);

If(type=1,peflat,psflat);
If(type=1,peeq0,pseq0);
If(type=1,pesig,pssig);
—William Golson
MetaStock Technical Support
www.metastock.com
BACK TO LIST

eSIGNAL: NOVEMBER 2013
For this month’s Traders’ Tip, we’ve provided the formula PMACD_Signal.efs based on Johnny Dough’s article in this issue, “Reversing MACD: The Sequel.”
The study contains formula parameters to set the values for the price source, fast period, slow period, signal period, MA type, and price shift plotting option, which may be configured through the Edit Chart window (right-click on chart and select edit chart).
To discuss this study or download a complete copy of the formula code, please visit the EFS Library Discussion Board forum under the forums link from the support menu at www.esignal.com or visit our EFS KnowledgeBase at https://www.esignal.com/support/kb/efs/. The eSignal formula scripts (EFS) are also available for copying & pasting below.
/*********************************
Provided By:
    Interactive Data Corporation (Copyright © 2013)
    All rights reserved. This sample eSignal Formula Script (EFS)
    is for educational purposes only. Interactive Data Corporation
    reserves the right to modify and overwrite this EFS file with
    each new release.

Description:
    Reversing MACD: The Sequel

Version:            1.00  11/11/2013

Formula Parameters:                        Default:
Price Source                               Close
Period Fast                                12
Period Slow                                26
Period Signal                              9

MA type                                    EMA

Plot computed price shift forward by 1     true

Notes:
    The related article is copyrighted material. If you are not a subscriber
    of Stocks & Commodities, please visit www.traders.com.

**********************************/

var fpArray = new Array();

function preMain()
{
    setPriceStudy(true);
    setStudyTitle("Reversing MACD: The Sequel");

    setDefaultBarFgColor(Color.green, 0);
    setDefaultBarFgColor(Color.blue, 1);
    setDefaultBarFgColor(Color.red, 2);

    var x=0;

    fpArray[x] = new FunctionParameter("fpPriceSource", FunctionParameter.STRING);
    with(fpArray[x++])
    {
        setName("Price Source");
        addOption("Open");
        addOption("Close");
        addOption("Low");
        addOption("High");
        addOption("HLC/3");
        setDefault("Close");
    }

    fpArray[x] = new FunctionParameter("fpFast", FunctionParameter.NUMBER);
    with(fpArray[x++])
    {
        setName("Period Fast");
        setLowerLimit(1);
        setUpperLimit(50);
        setDefault(12);
    }

    fpArray[x] = new FunctionParameter("fpSlow", FunctionParameter.NUMBER);
    with(fpArray[x++])
    {
        setName("Period Slow");
        setLowerLimit(2);
        setUpperLimit(50);
        setDefault(26);
    }

    fpArray[x] = new FunctionParameter("fpSignal", FunctionParameter.NUMBER);
    with(fpArray[x++])
    {
        setName("Period Signal");
        setLowerLimit(0);
        setUpperLimit(50);
        setDefault(9);
    }

    fpArray[x] = new FunctionParameter("fpMAtype", FunctionParameter.STRING);
    with(fpArray[x++])
    {
        setName("MA type");
        addOption("EMA");
        addOption("SMA");
        setDefault("EMA");
    }

    fpArray[x] = new FunctionParameter("fpShift", FunctionParameter.BOOLEAN);
    with(fpArray[x++])
    {
        setName("Plot computed price shift forward by 1");
        setDefault(true);
    }
}

var bInit = false;
var bVersion = null;

var xEq = null;
var xZero = null;
var xSignal = null;

function main(fpPriceSource, fpFast, fpSlow, fpSignal, fpMAtype, fpShift)
{
    if (bVersion == null) bVersion = verify();
    if (bVersion == false) return;

    var nShift = null;
    var xSource = null;

    if (!fpShift) nShift = 0
    else nShift = -1;

    if(!bInit)
    {
        switch (fpPriceSource)
        {
            case "Open":
                xSource = open();
                break;
            case "Close":
                xSource = close();
                break;
            case "High":
                xSource = high();
                break;
            case "Low":
                xSource = low();
                break;
            case "HLC/3":
                xSource = hlc3();
                break;
            default : return;
        }

        switch (fpMAtype)
        {
            case "SMA":
                NameAverage_Eq = "PsMACDeq";
                NameAverage_Zero = "PsMACDzero";
                NameAverage_Signal = "PsMACDsignal";
                break;
            case "EMA":
                NameAverage_Eq = "PMACDeq";
                NameAverage_Zero = "PMACDzero";
                NameAverage_Signal = "PMACDsignal";
                break;
            default : return;
        }

        xEq = efsInternal(NameAverage_Eq, fpFast, fpSlow, xSource);
        xZero = efsInternal(NameAverage_Zero, fpFast, fpSlow, xSource);
        xSignal = efsInternal(NameAverage_Signal, fpFast, fpSlow, fpSignal, xSource)

        setCursorLabelName(NameAverage_Eq, 0);
        setCursorLabelName(NameAverage_Zero, 1);
        setCursorLabelName(NameAverage_Signal, 2);

        bInit = true;
    }

    var nEq = xEq.getValue(nShift);
    var nZero = xZero.getValue(nShift);
    var nSignal = xSignal.getValue(nShift);

    if (nEq == null || nZero == null || nSignal == null)
        return;

    return [nEq, nZero, nSignal]
}

var xEMAx = null;
var xEMAy = null;

function Calc_ValueEMA(nPeriodX, nPeriodY, xSeries)
{
    if (getBarState() == BARSTATE_ALLBARS)
    {
        xEMAx = ema(nPeriodX, xSeries);
        xEMAy = ema(nPeriodY, xSeries);
    }

    var nEMAx = xEMAx.getValue(0);
    var nEMAy = xEMAy.getValue(0);

    if (nEMAx == null || nEMAy == null)
        return;

    var nAlphaX = 2 / (1 + nPeriodX);
    var nAlphaY = 2 / (1 + nPeriodY);

    return new Array(nEMAx, nEMAy, nAlphaX, nAlphaY);
}

function PMACDeq(nPeriodX, nPeriodY, xSeries)
{
    var nReturnValue = null;
    var aValueArray = Calc_ValueEMA(nPeriodX, nPeriodY, xSeries);

    if (aValueArray != null)
    {
        var nEMAx = aValueArray[0];
        var nEMAy = aValueArray[1];
        var nAlphaX = aValueArray[2];
        var nAlphaY = aValueArray[3];

        nReturnValue = (nAlphaX * nEMAx - nAlphaY * nEMAy) / (nAlphaX - nAlphaY);
    }

    return nReturnValue;
}

function PMACDlevel(nPeriodX, nPeriodY, nLevel, xSeries)
{
    var nReturnValue = null;
    var aValueArray = Calc_ValueEMA(nPeriodX, nPeriodY, xSeries);

    if (aValueArray != null)
    {
        var nEMAx = aValueArray[0];
        var nEMAy = aValueArray[1];
        var nAlphaX = aValueArray[2];
        var nAlphaY = aValueArray[3];

        nReturnValue = (nLevel + (1 - nAlphaY) * nEMAy - (1 - nAlphaX) * nEMAx) / (nAlphaX - nAlphaY);
    }

    return nReturnValue;
}

var xEMAx = null;
var xEMAy = null;
var xMACDValue = null;
var xMACDSignal = null;

function PMACDsignal(nPeriodX, nPeriodY, nPeriodZ, xSeries)
{
    if (getBarState() == BARSTATE_ALLBARS)
    {
        xEMAx = ema(nPeriodX, xSeries);
        xEMAy = ema(nPeriodY, xSeries);
        xMACDValue = efsInternal("Calc_MACDValue", xEMAx, xEMAy);
        xMACDSignal = ema(nPeriodZ, xMACDValue);
    }

    var nReturnValue = null;
    var aValueArray = Calc_ValueEMA(nPeriodX, nPeriodY, xSeries);

    if (aValueArray != null)
    {
        var nEMAx = aValueArray[0];
        var nEMAy = aValueArray[1];
        var nAlphaX = aValueArray[2];
        var nAlphaY = aValueArray[3];

        var nMACDSignal = xMACDSignal.getValue(0);

        if (nMACDSignal == null)
            return;

        nReturnValue = (nMACDSignal - nEMAx * (1 - nAlphaX) + nEMAy * (1 - nAlphaY)) / (nAlphaX - nAlphaY);
    }

    return nReturnValue;
}

function Calc_MACDValue(xSeries1, xSeries2)
{
    var nValue1 = xSeries1.getValue(0);
    var nValue2 = xSeries2.getValue(0);

    if (nValue1 == null || nValue2 == null)
        return;

    var nReturnValue = nValue1 - nValue2;

    return nReturnValue;
}

function PMACDzero(nPeriodX, nPeriodY, xSeries)
{
    return PMACDlevel(nPeriodX, nPeriodY, 0, xSeries);
}

function PsMACDeq( nPeriodX, nPeriodY, xSeries)
{
    var nOffsetX = xSeries.getValue(1-nPeriodX);
    var nOffsetY = xSeries.getValue(1-nPeriodY);

    if (nOffsetX == null || nOffsetY == null)
        return;

    var nReturnValue = (nPeriodX * nOffsetY - nPeriodY * nOffsetX) / (nPeriodX - nPeriodY);

    return nReturnValue;
}

var xSMAx_Zer = null;
var xSMAy_Zer = null;

function PsMACDzero( nPeriodX, nPeriodY, xSeries)
{
    if (getBarState() == BARSTATE_ALLBARS)
    {
        xSMAx_Zer = sma(nPeriodX, xSeries);
        xSMAy_Zer = sma(nPeriodY, xSeries);
    }

    var nSMAx = xSMAx_Zer.getValue(0);
    var nSMAy = xSMAy_Zer.getValue(0);

    var nOffsetX = xSeries.getValue(1-nPeriodX);
    var nOffsetY = xSeries.getValue(1-nPeriodY);

    if (nSMAx == null || nSMAy == null || nOffsetX == null || nOffsetY == null)
        return;

    var nReturnValue = (nPeriodX * nPeriodY * (nSMAx - nSMAy) + nPeriodX * nOffsetY - nPeriodY * nOffsetX) / (nPeriodX - nPeriodY);

    return nReturnValue;
}

var xsMACD = null;
var xSMAsMACD = null;

function PsMACDsignal(nPeriodX, nPeriodY, nPeriodZ, xSeries)
{
    var nReturnValue = null;

    if (nPeriodZ != 1)
    {
        if (getBarState() == BARSTATE_ALLBARS)
        {
            xsMACD = efsInternal("Calc_sMACD", nPeriodX, nPeriodY, xSeries);
            xSMAsMACD = sma(nPeriodZ, xsMACD);
        }

        var nsMACD = xsMACD.getValue(0);
        var nSMAsMACD = xSMAsMACD.getValue(0);

        var nOffsetX = xSeries.getValue(1-nPeriodX);
        var nOffsetY = xSeries.getValue(1-nPeriodY);
        var nOffsetZ = xsMACD.getValue(1-nPeriodZ);

        if (nsMACD == null || nSMAsMACD == null || nOffsetX == null || nOffsetY == null || nOffsetZ == null)
            return;

        nReturnValue = (nsMACD * (nPeriodX * nPeriodY * nPeriodZ - nPeriodX * nPeriodY) -
                       nPeriodX * nPeriodY * nPeriodZ * nSMAsMACD -
                       nOffsetX * (nPeriodY * nPeriodZ - nPeriodY) +
                       nOffsetY * (nPeriodX * nPeriodZ - nPeriodX) +
                       nPeriodX * nPeriodY * nOffsetZ) /
                       (nPeriodX * nPeriodZ - nPeriodY * nPeriodZ - nPeriodX + nPeriodY);
    }

    return nReturnValue;
}

var xSMAx_Sig = null;
var xSMAy_Sig = null;

function Calc_sMACD(nPeriodX, nPeriodY, xSeries)
{
    if (getBarState() == BARSTATE_ALLBARS)
    {
        xSMAx_Sig = sma(nPeriodX, xSeries);
        xSMAy_Sig = sma(nPeriodY, xSeries);
    }

    var nSMAx = xSMAx_Sig.getValue(0);
    var nSMAy = xSMAy_Sig.getValue(0);

    if (nSMAx == null || nSMAy == null)
        return;

    var nReturnValue = nSMAx - nSMAy;

    return nReturnValue;
}

function verify()
{
    var b = false;
    if (getBuildNumber() < 779) {
        drawTextAbsolute(5, 35, "This study requires version 8.0 or later.",
            Color.white, Color.blue, Text.RELATIVETOBOTTOM|Text.RELATIVETOLEFT|Text.BOLD|Text.LEFT,
            null, 13, "error");
        drawTextAbsolute(5, 20, "Click HERE to upgrade.@URL=https://www.esignal.com/download/default.asp",
            Color.white, Color.blue, Text.RELATIVETOBOTTOM|Text.RELATIVETOLEFT|Text.BOLD|Text.LEFT,
            null, 13, "upgrade");
        return b;
    } else {
        b = true;
    }
    return b;
}
A sample chart is shown in Figure 2.
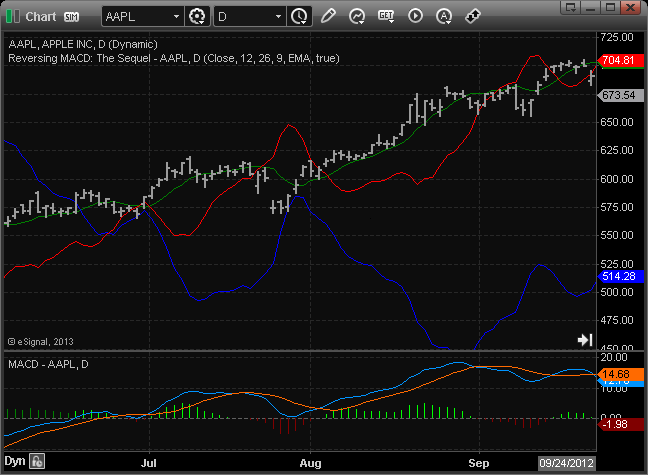
FIGURE 2: eSIGNAL. The study contains formula parameters to set the values for the price source, fast period, slow period, signal period, MA type, and price shift plotting option.
—Jason Keck
eSignal, an Interactive Data company
800 779-6555, www.eSignal.com
BACK TO LIST

WEALTH-LAB: NOVEMBER 2013
In this issue, author Johnny Dough, in his article “Reversing MACD: The Sequel,” shares a new tool: an indicator that anticipates the price when MACD crosses above or below its signal line one bar ahead. It complements his January 2012 article in S&C on the reverse MACD indicator.
We’re including this reverse MACD signal indicator in the latest version of our TASCIndicators library so that Wealth-Lab users can apply it to their charts and strategies, either coded in C# directly or built with the help of the GUI-based strategy wizard.
In addition, Dough provides the formulas for reverse functions for the MACD indicator based on simple moving averages (SMA) rather than the traditional exponential ones (EMA). These can also be found in the TASCIndicators library.
To start using them, please install the “TASC Magazine Indicators” library from the Extensions section of our website if you haven’t done so already, or apply the update directly using Wealth-Lab’s extension manager. In both cases, don’t forget to restart Wealth-Lab.
The strategy code shown here illustrates its application in Wealth-Lab, buying at stop order (or above) at the reverse-engineered price when a bullish MACD is crossing above its signal line, and exiting if the opposite criteria have been met after the MACD has turned bearish. Applying the idea to the short side is equally easy: Simply reverse the rules. Copy/paste the included strategy’s C# code or simply let Wealth-Lab do the job: In the open strategy dialog, click “download” to get this strategy’s code as well as other strategies contributed by the Wealth-Lab community.
A sample chart is shown in Figure 3.
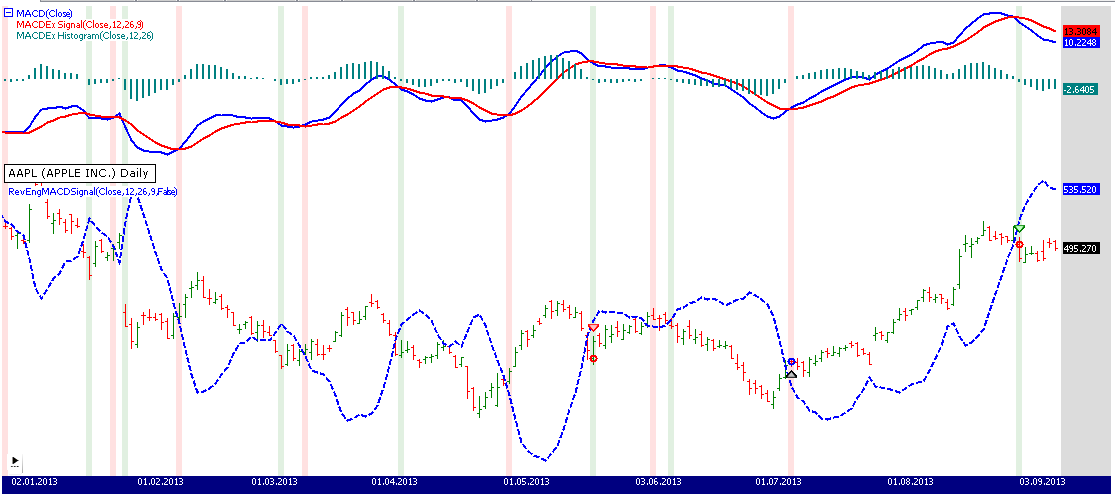
FIGURE 3: WEALTH-LAB. This sample Wealth-Lab 6 chart illustrates the application of the RevEngMACDSignal indicator. Crossovers and crossunders of MACD and its signal line are highlighted in green and red, respectively.
C# Code

using System;
using System.Drawing;
using WealthLab;
using WealthLab.Indicators;
using TASCIndicators;
using Community.Indicators;

namespace WealthLab.Strategies
{
	public class ReversingMACDSequel : WealthScript
	{
		protected override void Execute()
		{
			// Reversing MACD
			HideVolume();
			RevEngMACDSignal r = RevEngMACDSignal.Series( Close,12,26,9,false );
			PlotSeries( PricePane, r, Color.Blue, LineStyle.Dashed, 2 );

			// MACD and MACD signal
			DataSeries macd = MACD.Series( Close );
			DataSeries macdSignal = MACDEx_Signal3.Series( Close,12,26,9 );
			DataSeries macdHist = MACDEx_Histogram.Series( Close,12,26 );
			ChartPane MACDPane = CreatePane( 50, true, true );
			PlotSeries( MACDPane, macd, Color.Blue, LineStyle.Solid, 2 );
			PlotSeries( MACDPane, macdSignal, Color.Red, LineStyle.Solid, 2 );
			PlotSeries( MACDPane, macdHist, Color.Teal, LineStyle.Histogram, 2 );

			for(int bar = r.FirstValidValue; bar < Bars.Count; bar++)
			{
				if( CrossOver( bar, macdSignal, macd ) )
					SetBackgroundColor( bar, Color.FromArgb( 30, Color.Green ) );
				if( CrossUnder( bar, macdSignal, macd ) )
					SetBackgroundColor( bar, Color.FromArgb( 30, Color.Red ) );

				if (IsLastPositionActive)
				{
					if( macd[bar] > 0 )
						SellAtStop( bar+1, LastPosition, r[bar] );
				}
				else
				{
					if( macd[bar] < 0 )
						BuyAtStop( bar+1, r[bar] );
				}
			}
		}
	}
}
—Wealth-Lab team
MS123, LLC
www.wealth-lab.com
BACK TO LIST

NEUROSHELL TRADER: NOVEMBER 2013
The reverse MACD indicators described by Johnny Dough in his article in this issue, “Reversing MACD: The Sequel,” can be easily implemented with a few of NeuroShell Trader’s 800+ indicators. Simply select “New indicator” from the Insert menu and use the Indicator Wizard to recreate the following indicators:
PMACDeq:	Divide( Sub( Mul2( ExpAvg(Close,12), Divide(2,Add2(1,12))), Mul2( ExpAvg(Close,26), Divide(2,Add2(1,26)))), Sub( Divide(2,Add2(1,12)), Divide(2,Add2(1,26))))

PMACDlevel: 	Divide( Add2(LEVEL, Sub( Mul2( ExpAvg(Close,26), Sub(1, Divide(2, Add2(1,26)))), Mul2( ExpAvg(Close,12), Sub(1, Divide(2, Add2(1,12)))))), Sub( Divide(2, Add2(1,12)), Divide(2, Add2(1,26))))

PMACDzero:	PMACDlevel(0)

PMACDsignal:   	Divide( Add2( Sub( MACD Signal(Close,9,12,26), Mul2( ExpAvg(Close,12), Sub(1, Divide(2, Add2(1,12))))), Mul2( ExpAvg(Close,26), Sub(1, Divide(2, Add2(1,26))))),Sub( Divide(2, Add2(1,12)), Divide(2, Add2(1,26))))

sMACD:		Sub( Avg( Close, 12), Avg( Close, 26))

PsMACDeq:	Divide( Sub( Mul2(12, Lag(Close,25)), Mul2(26, Lag(Close,11))), Sub(12,26))

PsMACDzero:	Divide( Add2( Mul3(12,26, Sub( Avg(Close,12), Avg(Close,26))), Sub( Mul2(12, Lag(Close,25)), Mul2(26, Lag(Close,11)))), Sub(12,26))

PsMACDSignal:	Divide( Add3( Sub( Sub( Mul2( SMACD, Sub( Mul3(12,26,9), Mul2(12,26))), Mul4(12,26,9, Avg(SMACD,9))), Mul2( Lag( Close,11), Sub( Mul2(26,9),26))), Mul2( Lag(Close,25), Sub( Mul2(12,9),12)), Mul3(12,26, Lag(SMACD,8))), Add2( Sub( Sub( Mul2(12,9), Mul2(26,9)),12),26))
Users of NeuroShell Trader can go to the STOCKS & COMMODITIES section of the NeuroShell Trader free technical support website to download a copy of this or any previous Traders’ Tips.
A sample chart is shown in Figure 4.
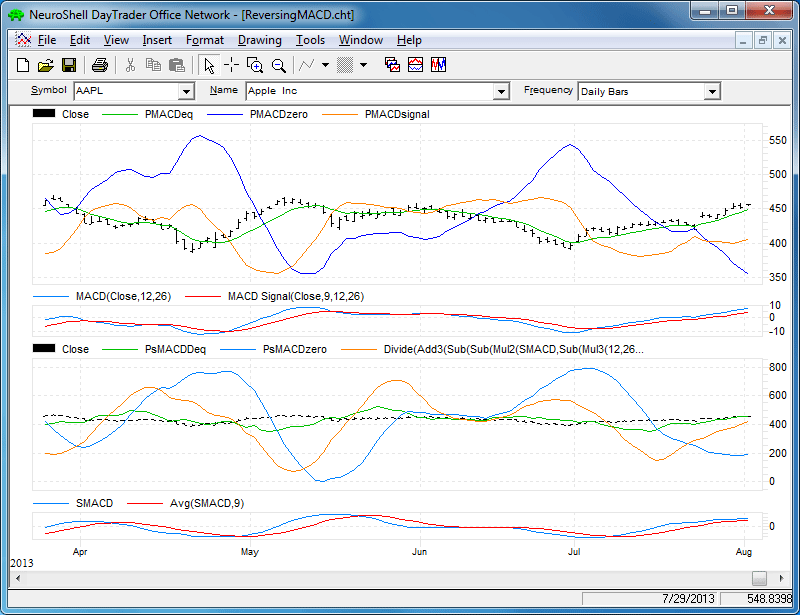
FIGURE 4: NEUROSHELL TRADER, REVERSE MACD. This NeuroShell Trader chart displays the reverse MACD indicators.
—Marge Sherald, Ward Systems Group, Inc.
301 662-7950, sales@wardsystems.comsales@wardsystems.com
www.neuroshell.com
BACK TO LIST

AIQ: NOVEMBER 2013
In “Reversing MACD: The Sequel” in this issue, author Johnny Dough presents functions that return price values for the MACD indicators. I am providing AIQ code for the following functions based on the AmiBroker code given in Dough’s article:
- PMACDsignal returns price where the MACD crosses its signal line or where there is an MACD histogram cross of the zero line
- PMACDlevel returns price where the MACD is equal to the level value
- PMACDeq returns price where the MACD is equal to the previous bar MACD.
I created some additional rules to show reports that display the price values of the functions:
- The ShowValues rule will display all function values for stocks that are over the minPrice level input
- The NearXO rule will list only those stocks that
are less than or equal to the average range percentage of crossing over of
the MACD oscillator
- The PMACxup rule lists cross-ups today on the MACD oscillator using the PMACDsignal price
- The PMACxdn “if” rule lists cross-downs today on the MACD oscillator using the PMACDsignal price.
The NearXO report is useful if you want to enter a position on a buy or sell stop-on-close when the MACD oscillator crosses zero. This report sorts by the MACD oscillator. The ones with a positive MACD oscillator amounts calculate the price that would be used to go short at the close for a cross-down on the oscillator. The ones with negative MACD oscillator amounts calculate the price that would be used to go long at the close for a cross-up on the oscillator.
I ran the NearXO report on September 10, 2013 using the NASDAQ 100 list of stocks. There were 12 that showed up on the report, meaning they were near a cross-up or cross-down of the MACD oscillator.
In Figure 5, I show a chart of Qiagen NV (QGEN), which appeared on the report. The report showed that a next day’s close price of 20.72 or higher would cause the MACD oscillator to go from negative to positive. On September 11, 2013, QGEN closed at 20.98 and the MACD oscillator moves to a positive number.
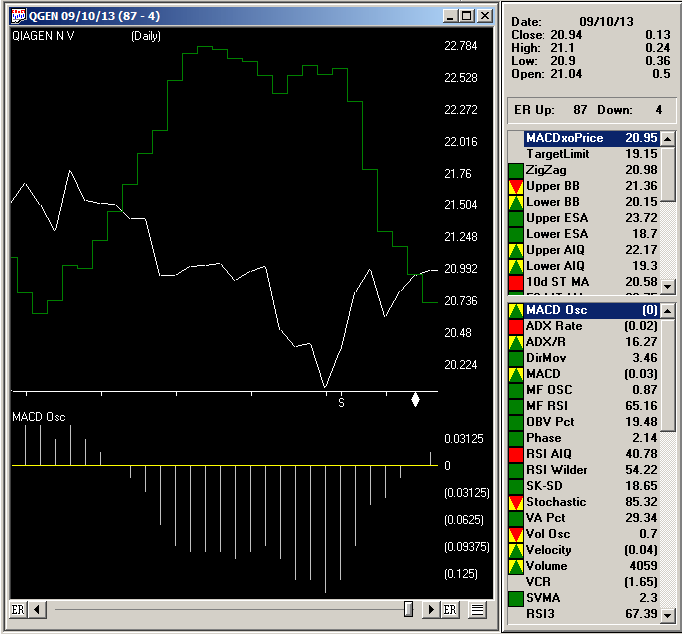
FIGURE 5: AIQ. Here’s a sample chart of QGEN with the MACD oscillator, looking for closing price (white line) and price to make a cross up or cross down on the oscillator (dark green line).
The AIQ code and EDS file can be downloaded from www.TradersEdgeSystems.com/traderstips.htm.
!REVERSING MACD: THE SEQUEL

!Author: Johnny Dough, TASC November 2013

!Coded by: Richard Denning 9/9/2013

!www.TradersEdgeSystems.com


!INPUTS:

price is [close].

period_X is 12.

period_Y is 25.

period_Z is 9.

level is 0.

minPrice is 10.

rangeFactor is 1.


!PMACDsignal returns price where MACD crosses signal line

!  or MACD histogram cross of 0:

  alphaX is 2 / ( 1 + period_X ).

  alphaY is 2 / ( 1 + period_Y ).

  alphaZ is 2 / ( 1 + period_Z ).

  One_alphaX is 1 - alphaX.

  One_alphaY is 1 - alphaY.

  One_alphaZ is 1 - alphaZ.

  MACDvalue is expavg( price, period_X ) - expavg( price, period_Y ).

  MACDvalue_1 is valresult(MACDvalue,1).

  MACDsignal is expavg( MACDvalue, period_Z ).

  PMACDsignal is ( MACDsignal - expavg( price, period_X ) * one_alphaX

   + expavg( price, period_Y ) * one_alphaY ) / ( alphaX - alphaY ).


!PMACDlevel returns price where MACD is equal to level value

! e.g. PMACDlevel(0, C, 12, 16) would return the series

!      where next price would make MACD=0

  PMACDlevel is (Level + expavg( price, period_Y ) * one_alphaY

	- expavg( price, period_X )* one_alphaX ) / ( alphaX - alphaY ).


!PMACDeq returns price where MACD is equal to previous bar MACD

  PMACDeq is ( expavg( price, period_X ) * alphaX

	- expavg( price, period_Y )* alphaY ) / ( alphaX - alphaY ).


!ADDITIONAL CODE NOT PROVIDED BY AUTHOR:

  PMACDsignal_1 is valresult(PMACDsignal,1).    !PLOT-OFFSET BY ONE DAY

  MACDosc_1 is val([MACD osc],1).              !Prior day's MACD oscillator value

!RULES FOR GENERATING REPORTS:

  PMACxup if price > PMACDsignal_1

	and valrule(price <= PMACDsignal_1,1) and price > minPrice.

  PMACxdn if price < PMACDsignal_1

	and valrule(price >= PMACDsignal_1,1) and price > minPrice.


  PMACDsigPct is (PMACDsignal / [close] - 1) * 100.

  AvgRangePct is simpleavg(([high]/[low]-1)*100,200).

  NearXO if price > minPrice and abs(PMACDsigPct) <= AvgRangePct*rangeFactor.

  ShowValues if price > minPrice.
—Richard Denning
info@TradersEdgeSystems.com
for AIQ Systems
BACK TO LIST

TRADERSSTUDIO: NOVEMBER 2013
In “Reversing MACD: The Sequel” in this issue, author Johnny Dough presents functions that return price values for the MACD indicators. The TradersStudio code for these functions is provided at the following websites:
The following code files are contained in the download:
- Function: PMACDsignal returns price where the MACD crosses its signal line or an MACD histogram cross of zero
- PMACDlevel returns price where the MACD is equal to the level value
- PMACDeq returns price where the MACD is equal to the previous bar MACD.
Due to time constraints, I did not write any code that uses the functions, such as an indicator plot or a trading system.The code for the functions themselves is shown here:
'REVERSING MACD: THE SEQUEL

'Author: Johnny Dough, TASC November 2013

'Coded by: Richard Denning 9/12/2013

'wwwTradersEdgeSystemscom


function PMACDsignal(price as bararray,period_X,period_Y,period_Z)

'PMACDsignal returns price where MACD crosses signal line

'  or MACD h=togram cross of 0:

   Dim alphaX, alphaY, alphaZ,One_alphaX,One_alphaY,One_alphaZ,den

   Dim MACDvalue As BarArray

   Dim MACDsignal As BarArray

   alphaX = 2 / ( 1 + period_X )

   alphaY = 2 / ( 1 + period_Y )

   alphaZ = 2 / ( 1 + period_Z )

   One_alphaX = 1 - alphaX

   One_alphaY = 1 - alphaY

   One_alphaZ = 1 - alphaZ

   MACDvalue = XAverage( price, period_X ) - XAverage( price, period_Y )

   MACDsignal = XAverage( MACDvalue, period_Z )

   den = iif( (alphaX - alphaY) <> 0,alphaX - alphaY,0.00001)

   PMACDsignal=(MACDsignal-XAverage(price,period_X)*One_alphaX+XAverage(price,period_Y)*One_alphaY)/den

End Function

'-------------------------------------------------------------------------------------------------------

function PMACDlevel(level,price as bararray,period_X,period_Y)

'PMACDlevel returns price where MACD = equal To level value

' e.g. PMACDlevel(0, C, 12, 16) would return the series

'      where Next price would make MACD=0

   Dim alphaX, alphaY, One_alphaX, One_alphaY, den

   alphaX = 2 / ( 1 + period_X )

   alphaY = 2 / ( 1 + period_Y )

   One_alphaX = 1 - alphaX

   One_alphaY = 1 - alphaY

   den = iif( (alphaX - alphaY) <> 0,alphaX - alphaY,0.00001)

   PMACDlevel=(level+XAverage(price,period_Y)*One_alphaY-XAverage(price,period_X)*One_alphaX)/den

End Function

'--------------------------------------------------------------------------------------------------------

function PMACDeq(price as bararray,period_X,period_Y)

'PMACDeq returns price where MACD is equal to previous bar MACD

   Dim alphaX, alphaY, One_alphaX, One_alphaY, den

   alphaX = 2 / ( 1 + period_X )

   alphaY = 2 / ( 1 + period_Y )

   den = iif( (alphaX - alphaY) <> 0,alphaX - alphaY,0.00001)

   PMACDeq=(XAverage(price,period_X)*alphaX-XAverage(price,period_Y)*alphaY)/den

End Function

'--------------------------------------------------------------------------------------------------------
—Richard Denning
info@TradersEdgeSystems.com
for TradersStudio
BACK TO LIST

NINJATRADER: NOVEMBER 2013
ReversingMACD2, based on Johnny Dough’s article in this issue, “Reversing MACD: The Sequel,” has been implemented as an indicator available for download at www.ninjatrader.com/SC/November2013SC.zip.
Once you have downloaded it, from within the NinjaTrader Control Center window, select the menu File → Utilities → Import NinjaScript and select the downloaded file. This file is for NinjaTrader version 7 or greater.
You can review the indicator source code by selecting the menu Tools → Edit NinjaScript → Indicator from within the NinjaTrader Control Center window and selecting the “ReversingMACD2” file.
A sample chart implementing the strategy is shown in Figure 6.
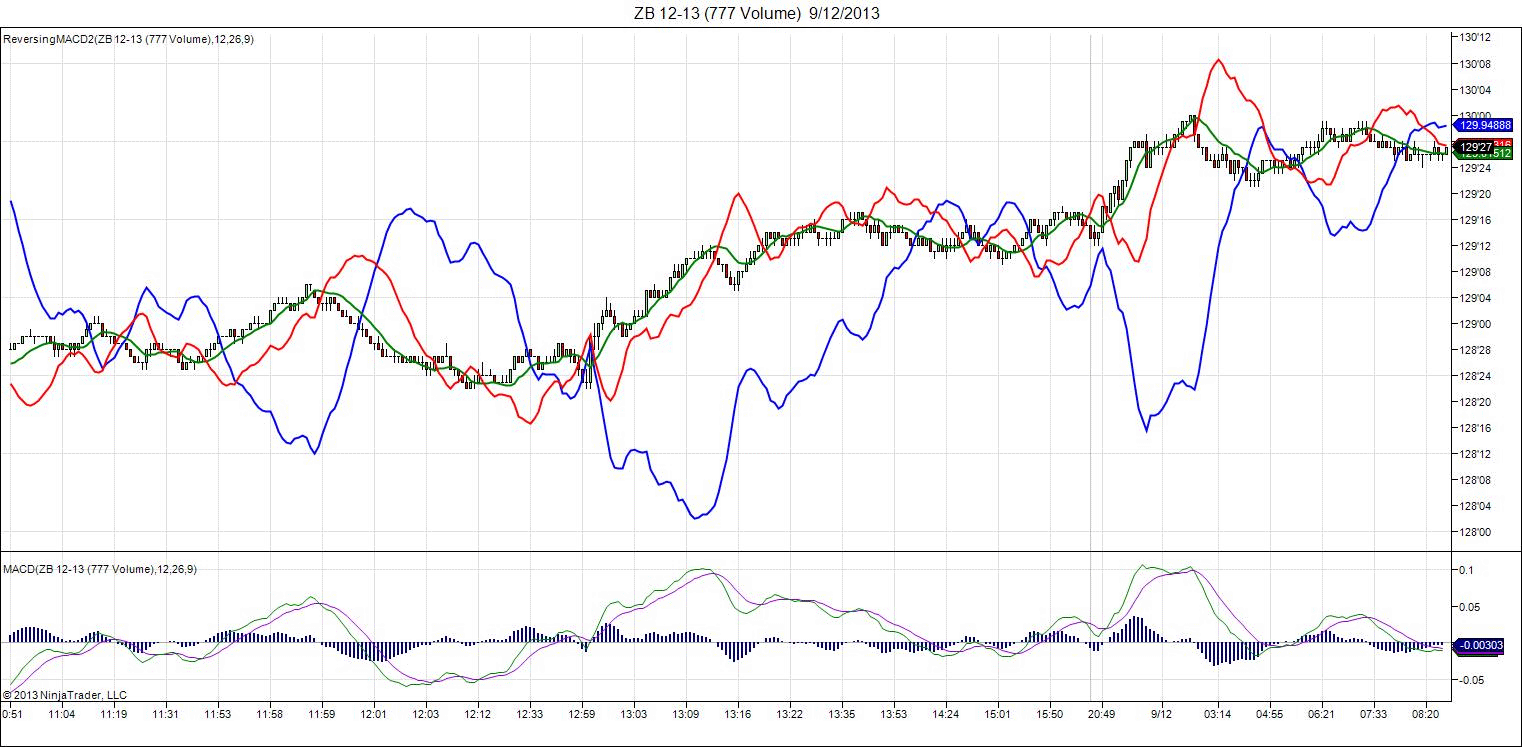
FIGURE 6: NINJATRADER, REVERSE MACD. This screenshot shows the ReversingMACD2 applied to a 777-volume bars intraday chart of the December 2013 ZB futures contract.
—Raymond Deux, Chelsea Bell, and Bertrand Wibbing
NinjaTrader, LLC
www.ninjatrader.com
BACK TO LIST

UPDATA: NOVEMBER 2013
The Traders’ Tip for this month is based on “Reversing MACD: The Sequel” in this issue by Johnny Dough. In the article, Dough builds on January 2012 S&C article, “Reversing MACD,” which uses the indicator PMACDsignal to indicate the price necessary to cause two indicator value levels to meet. In his article in this issue, Dough discusses the underlying price necessary to cause the MACD line to meet its signal line.
Dough also changes the type of moving averages used earlier in his January 2012 article from exponential to simple arithmetic. The moving average indicates the price necessary for the averages to cross each other; to cross a set level; and to cross a signal line. See Figure 7.
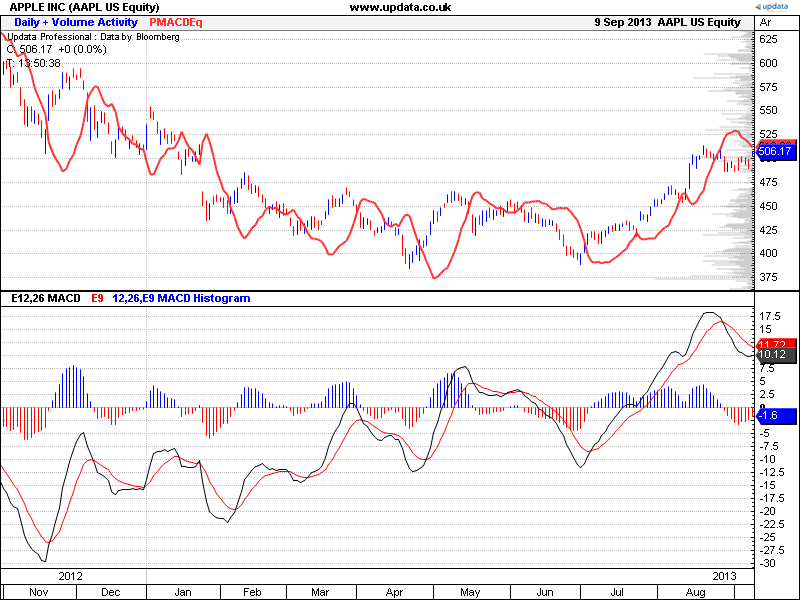
FIGURE 7: UPDATA. Here, the PMACD is applied to Apple (AAPL) in daily resolution.
The Updata code for this technique has been added to the Updata library and may be downloaded by clicking the custom menu and indicator library. Those who cannot access the library due to a firewall may paste the code shown here into the Updata custom editor and save it.
'PMACDsignal
PARAMETER "MACD Period 1" #Period1=12
PARAMETER "MACD Period 2" #Period2=26
PARAMETER "Signal Period" #Signal=5
NAME "PMACDEq" ""
DISPLAYSTYLE 2LINES
INDICATORTYPE TOOL
PLOTSTYLE THICK2 RGB(255,50,50)
@AlphaX=0
@AlphaY=0
@AlphaZ=0
@expAvgX=0
@expAvgY=0
@expAvgZ=0
@MACDSignal=0
@PMACDSignalPrev=0
@PMACDSignal=0
FOR #CURDATE=0 TO #LASTDATE
   If #CURDATE>MAX(#Period1,#Period2)
      @AlphaX=2/(1+#Period1)
      @AlphaY=2/(1+#Period2)
      @AlphaZ=2/(1+#Signal)
      @expAvgX=EAVE(#Period1)
      @expAvgY=EAVE(#Period2)
      @expAvgZ=EAVE(#Signal)
      @MACDSignal=SGNL(MACD(#Period1,#Period2,E),#Signal,E)
      @PMACDSignal=(@MACDSignal-(1-@AlphaX)*@expAvgX+(1-@AlphaY)*@expAvgY)/(@AlphaX-@AlphaY)
      @Plot=@PMACDSignal
   EndIf
NEXT

'PsPMACDzero
PARAMETER "MACD Period 1" #Period1=12
PARAMETER "MACD Period 2" #Period2=26
NAME "PsPMACDzero" ""
DISPLAYSTYLE LINE
INDICATORTYPE TOOL
PLOTSTYLE THICK2 RGB(0,0,200)
@PsPMACDzero=0
FOR #CURDATE=0 TO #LASTDATE
   If #CURDATE>MAX(#Period1,#Period2)
      @PsPMACDzero=(#Period1*#Period2*(MAVE(#Period1)-MAVE(#Period2))+#Period1*Close(#Period2)-#Period2*Close(#Period1))/(#Period1-#Period2)
      @PLOT=@PsPMACDzero
   EndIf
NEXT

'PsPMACDeq
PARAMETER "MACD Period 1" #Period1=12
PARAMETER "MACD Period 2" #Period2=26
NAME "PsPMACDeq" ""
DISPLAYSTYLE LINE
INDICATORTYPE TOOL
PLOTSTYLE THICK2 RGB(0,200,0)
@PsPMACDeq=0
FOR #CURDATE=0 TO #LASTDATE
   If #CURDATE>MAX(#Period1,#Period2)
      @PsPMACDeq=(#Period1*CLOSE(#Period2)-#Period2*CLOSE(#Period1))/(#Period1-#Period2)
      @PLOT=@PsPMACDeq
   EndIf
NEXT

'PsMACDsignal
PARAMETER "MACD Period 1" #Period1=12
PARAMETER "MACD Period 2" #Period2=26
PARAMETER "Signal Period" #Signal=9
NAME "PsPMACDsignal" ""
DISPLAYSTYLE LINE
INDICATORTYPE TOOL
PLOTSTYLE THICK2 RGB(200,0,0)
@sMACD=0
@sMACDsignal=0
@PsPMACDsignal=0
@A=0
@B=0
@C=0
@D=0
@E=0
FOR #CURDATE=0 TO #LASTDATE
   If #CURDATE>MAX(#Period1,#Period2)
      'MACD type changed with 'M' for simple type.
      @sMACD=MACD(#Period1,#Period2,M)
      @sMACDsignal=SGNL(@sMACD,#Signal,M)
      'Code split into 5 parts for easy print in magazine
      @A=@sMACD*(#Period1*#Period2*#Signal-#Period1*#Signal)
      @B=(#Period1*#Period2*#Signal)*@PsPMACDsignal
      @C=Close(#Period1)*(#Period2*#Signal-#Period2)
      @D=Close(#Period1)*(#Period1*#Signal-#Period1)
      @E=#Period1*#Period2*Hist(@sMACD,#Signal)
      @PsPMACDsignal=(@A-@B-@C+@D+@E)/((#Period1*#Signal)-(#Period2*#Signal)-#Period1+#Period2)
      @PLOT=@PsPMACDsignal
   EndIf
NEXT
—Updata support team
support@updata.co.uk
www.updata.co.uk
BACK TO LIST

TRADING BLOX: NOVEMBER 2013
In “Reversing MACD: The Sequel” in this issue, author Johnny Dough takes a look at the MACD indicator and presents multiple functions that calculate what the price of the next bar would need to be for the following actions to occur: a cross of the MACD and its signal line, the MACD crossing the zero level, and the MACD changing direction.
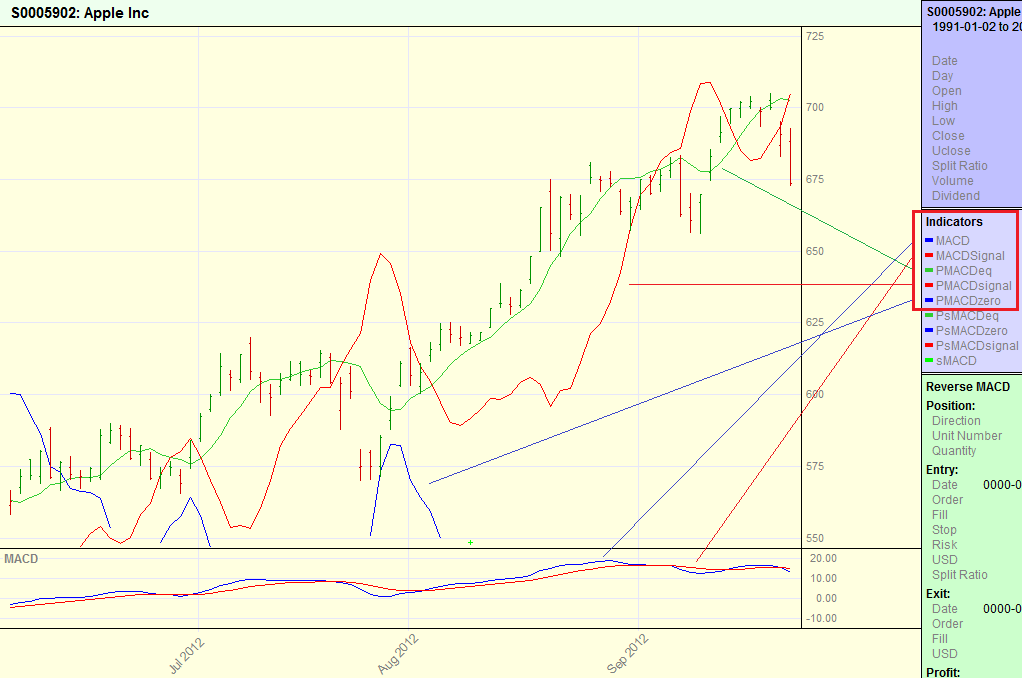
FIGURE 8: TRADING BLOX. Here is a sample plot of the MACD, MACDSignal, PMACDeq, PMACDsignal, and PMACDzero functions.
The functions are given for both the standard exponential moving average (EMA) version of the MACD and the simple moving average (SMA) version. See Figure 8. The functions have been coded in the update indicators script as instrument permanent variables.
Since each function calculates the price of the next bar, the plots of each instrument permanent variable must be offset ahead one bar (Figure 9).
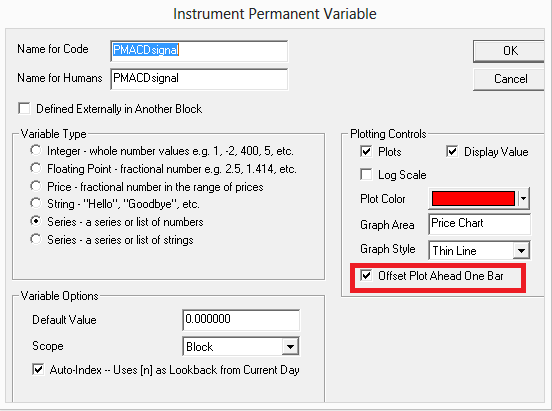
FIGURE 9: TRADING BLOX, CODE SETUP. Plots must be offset ahead one bar.
—Trading Blox
tradingblox.com
BACK TO LIST
MICROSOFT EXCEL: NOVEMBER 2013
The computations needed in Microsoft Excel spreadsheet software to recreate Johnny Dough’s indicator lines that he describes in his article in this issue, “Reversing MACD: The Sequel,” are straightforward translations of the AmiBroker functions given in his article to Excel column formulas.
This spreadsheet uses one set of columns to calculate the EMA-based values and a second adjacent set of columns to calculate the SMA-based values.
The toggle button to display moving averages in the upper right of the chart controls which set of calculations actually appear on the chart (that is, the EMA or SMA). See Figure 10.
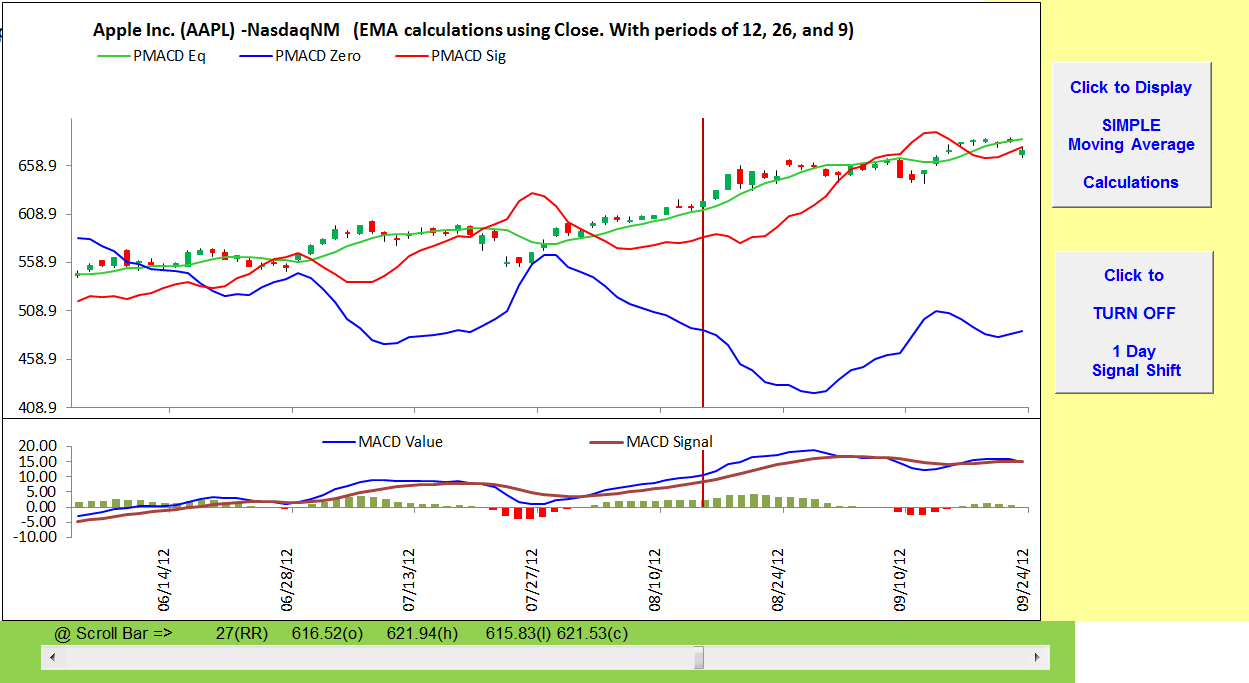
FIGURE 10: EXCEL, MACD & PMACD. This sample chart of AAPL displays the MACD and the PMACD indicator lines as calculated using the EMA.
Because the vertical range of the price indicator lines changes rather dramatically between the EMA setting and the SMA setting, this button also rescales the vertical axis as necessary.
The 1 day signal shift button is a simple on/off toggle that moves the indicator lines forward (to the right) one day when on.
Here are two changes to this user-control interface (Figure 11) to note that are departures from previous Excel Traders’ Tips:
- The set chart button has been moved to align it with the related control values
- A new chart these dates button is included. This button will first copy the values in green to the price windowing control values (in blue) and then perform the same function driven by the older set chart button.
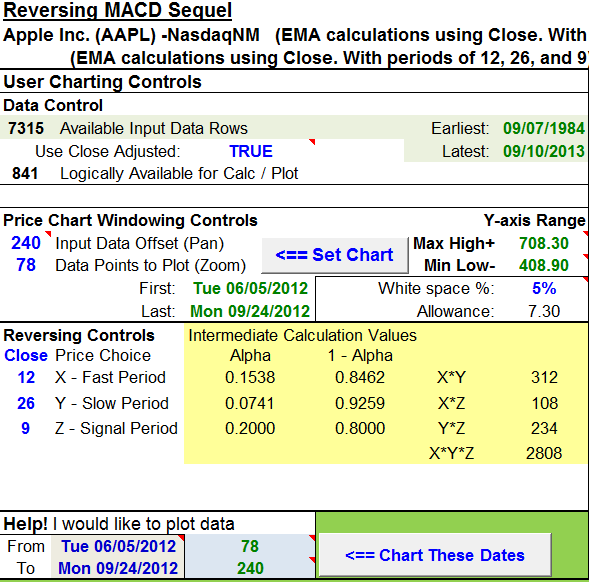
FIGURE 11: EXCEL, USER CONTROLS. User controls (in blue) for this Traders’ Tip are located under the “reversing” heading. The intermediate values are computed from the period values. Computing the intermediate values here greatly simplifies the indicator line formulas.
The spreadsheet file for this Traders’ Tip can be downloaded here. To successfully download it, follow these steps:
- Right-click on the Excel file link, then
- Select “save as” to place a copy of the spreadsheet file on your hard drive.
—Ron McAllister
Excel and VBA programmer
rpmac_xltt@sprynet.com
BACK TO LIST
Originally published in the November 2013 issue of
Technical Analysis of Stocks & Commodities magazine.
All rights reserved. © Copyright 2013, Technical Analysis, Inc.
Return to
Contents


