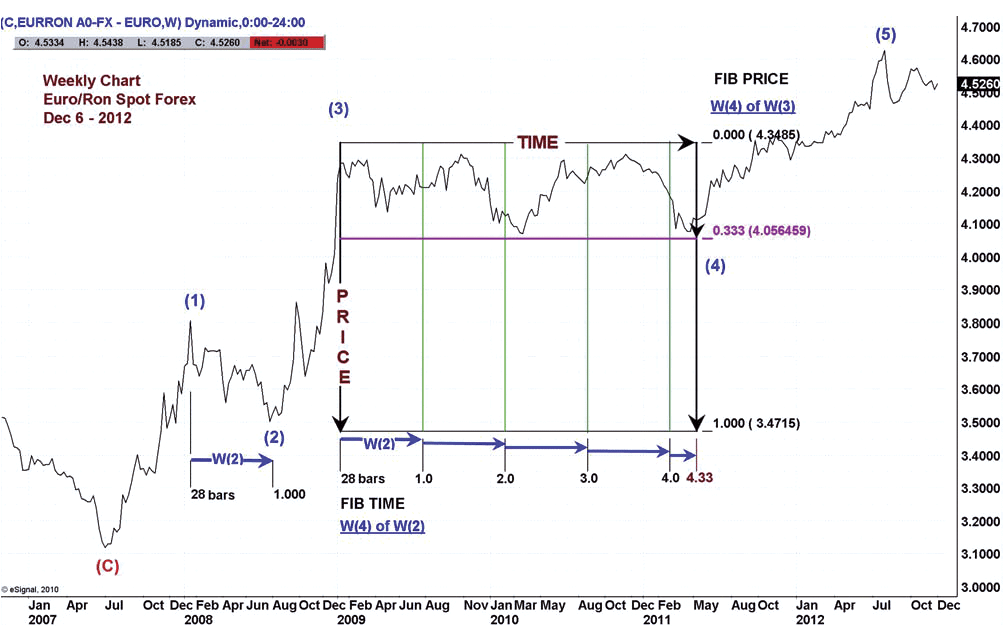
FIGURE 1: TIME AND PRICE RELATIONSHIP. Notice how W(4) retraced 33.3% of W(3) to the 4.0564 level.
CHART PATTERNS
Waves & Boxes
The relationship between time and price has a direct influence on trading profitability. Here’s a look at how you can gain an insight by looking at the euro and the Romanian leu.
As traders progress along their learning curve, they begin to clearly observe the influence of the time/price relation in identifying the optimal trading setup. In spite of this, some traders — novices and experienced — always start the learning process with only price tools and their corresponding indicators, that is, classic technical analysis. Sooner or later, the successful trader will reach an advanced stage where learning the importance of time and its usefulness becomes a priority in the quest to further develop and acquire the much-sought-after professional trading techniques.
THE EVOLUTION OF A TRADER
In the early stages of becoming a trader, we are all motivated to learn tons of techniques and indicators in order to perform the most profitable trades. We quickly observe that if the right approach isn’t selected, we are in great danger of losing our trading capital.
Over time, I began to realize that studying and applying Elliott waves, Gann methodology, and mapping multiple time frames (top-down analysis) are a prelude to any final decision-making. Once this is done, the next step, which is the detailed study of the specific market you are trading, comes naturally. You can then identify the optimal time frame setup that works for you, one that consists of the most efficient elements of modern technical analysis.
ESTABLISHING THE TRADING CONTEXT
Before I describe my time & price technique, I will briefly present and revisit some of the basic elements that contribute to its performance.
In spite of the so-called subjective labeling that many traders give to Elliott waves, I have been successfully using them for more than 20 years. Many traders misunderstand the usage of these waves mainly because of the lack of a probabilistic approach. Without probability, there wouldn’t be a successful trading technique — classic or modern.
FIGURE 1: TIME AND PRICE RELATIONSHIP. Notice how W(4) retraced 33.3% of W(3) to the 4.0564 level.