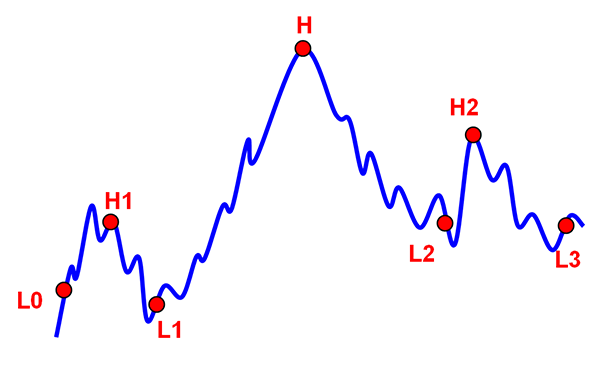
FIGURE 1: MILESTONE POINTS IN A HEAD & SHOULDERS FORMATION. The red points are milestones for the H&S since connecting them one after the other provides an outline of the formation. They also facilitate the creation of an identification algorithm.
PATTERN RECOGNITION
Crossing The (Neck)line
In part 1, we looked at how to find important milestone points in a head & shoulders formation. In this, the second article of a two-part series, we present an algorithm that will let the computer find the formations for us.
In Figure 1, you can see what I call milestone points for a completed closing-price head & shoulders (H&S) formation — that is, an H&S formation generated by the closing price where it has penetrated the neckline. However, these milestones are defined regardless of whether there is an H&S pattern present. In this article, I will elaborate on the necessary conditions that these points must meet in order to outline an H&S. Being aware of these conditions will help you create an identification algorithm.

FIGURE 1: MILESTONE POINTS IN A HEAD & SHOULDERS FORMATION. The red points are milestones for the H&S since connecting them one after the other provides an outline of the formation. They also facilitate the creation of an identification algorithm.
METRICS AND NOTATIONS
Before delving into the conditions, I will define some of the important points and metrics (see Figure 2):
THE CONDITIONS
The first condition has to do with the vertical distance relationship between H1 and H as well as between H2 and H. We want H1 to be sufficiently higher than L1, but not too close to H.