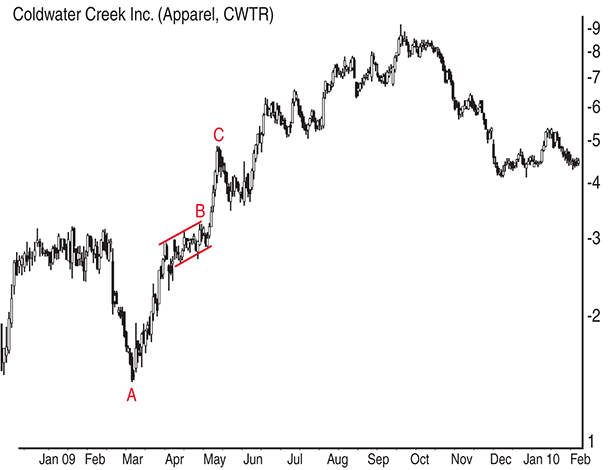
FIGURE 1: MINOR HIGH. A high and tight flag (AB) leads to a straight-line run (BC) after the breakout.
CHARTING
May The Best Pattern Win
Which chart patterns precede a strong breakout move? Find out here.
I never associate chart patterns with being trendy, but when I received an email asking me which chart patterns are trendiest, I had to think twice.
WHAT IS A TRENDY CHART PATTERN?
A chart pattern is trendy if price forms the first minor high or low well after a breakout. In other words, if price changes from moving sideways (consolidating in the chart pattern) to moving up or down (after the breakout), then a new trend has begun. The chart pattern with the highest percentage gain (upward breakout) or loss (downward breakout) to the first minor high or low, respectively, after the breakout, becomes the trendiest; it leads to the strongest trends.
To determine which pattern is the trendiest, you need only measure from the breakout of a chart pattern to the first minor high or low, sort the results, and you will have a list of the trendiest chart patterns. Those chart patterns showing the highest percentage runs to the first minor high or low are the trendiest.

FIGURE 1: MINOR HIGH. A high and tight flag (AB) leads to a straight-line run (BC) after the breakout.