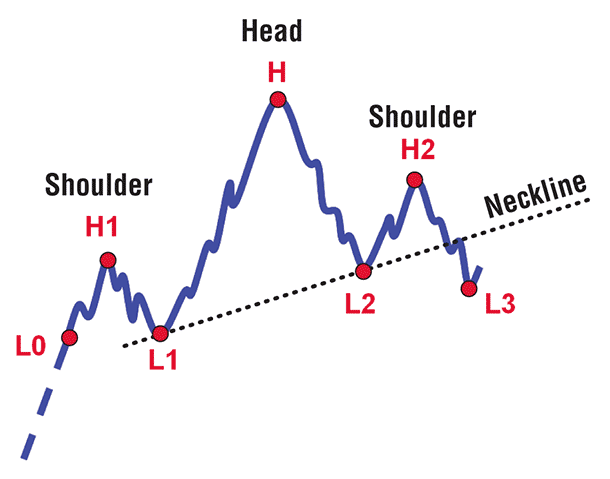
FIGURE 1: TEXTBOOK HEAD & SHOULDERS. Here you see the high and low points defined.
PATTERN RECOGNITION
New Tech For Old Tech
Ever wanted to use a simple mechanical recognition algorithm in your favorite software for spotting head & shoulders patterns? If yes, this two-part article is for you. Here’s the first part.
If you were asked to represent the term “chart analysis” somehow, you would probably start with a drawing of the patriarch of chart formations: the head & shoulders (H&S). The H&S is usually one of the first formations you’ll encounter in chart analysis, and it is certainly an unforgettable one. In this article — the first of two — I will present a way to algorithmically identify milestone points of a H&S in a scale-free fashion. Then, in the second article, I will tell you about the basic conditions these points satisfy so a recognition algorithm will be achievable.
PATTERN RECOGNITION & TECHNICAL ANALYSIS
The difficulty in algorithmic pattern recognition for technical analysis lies mainly in variation and scale problems. They are:
Variation problems
The beauty of a price formation is in the eye of the beholder. This means that since price moves in zigzags, there are endless ways for a textbook pattern to manifest itself in a real price chart. If you try to create a pattern recognition algorithm using a simple swing indicator (that is, a crooked line that connects peaks to troughs based on a percentage threshold), you will probably give up when you realize that your eyes, perception, and probably your charting experience are not satisfied with the results and that numerous cases must be taken into account.
Scale problems
Almost all chart formations of classic technical analysis are scale-free. A formation may take from a few to as many as hundreds of price bars to develop and it may take price swings ranging from minuscule to huge, so again the use of a simple swing indicator is inefficient for decent pattern recognition and of little practical help most of the time.

FIGURE 1: TEXTBOOK HEAD & SHOULDERS. Here you see the high and low points defined.