TRADERS’ TIPS
February 2013
Here is this month’s selection of Traders’ Tips, contributed by
various developers of technical analysis software to help readers more easily
implement some of the strategies presented in this and other issues.
Other code appearing in articles in this issue is posted in the Subscriber
Area of our website here.
Login requires your last name and subscription number (from mailing label).
Once logged in, scroll down to beneath the “Optimized trading systems” area
until you see “Code from articles.” From there, code can be copied
and pasted into the appropriate technical analysis program so that no retyping
of code is required for subscribers.
You can copy these formulas and programs for easy use in your spreadsheet
or analysis software. Simply “select” the desired text
by highlighting as you would in any word processing program, then use your
standard key command for copy or choose “copy” from the browser
menu. The copied text can then be “pasted” into any open spreadsheet
or other software by selecting an insertion point and executing a paste command.
By toggling back and forth between an application window and the open web
page, data can be transferred with ease.

For this month’s Traders’ Tips, the focus is Ron McEwan’s article in this issue, “The Volatility (Regime) Switch Indicator.”
Code for Microsoft Excel is already provided in McEwan’s article by the author, and subscribers will find this code in the Subscriber Area of our website, Traders.com. (Click on “Article Code” from our homepage.) Presented here is additional code and possible implementations for other software.

TRADESTATION: FEBRUARY 2013 TRADERS’ TIPS CODE
In “The Volatility (Regime) Switch Indicator” in this issue, author Ron McEwan describes using the Microsoft Excel spreadsheet application to calculate a switch indicator that may aid in determining whether the security being analyzed is in a trending mode or reversion-to-the mean mode (or soon-to-be transitioning to that mode).
McEwan suggests that this indicator may help the investor/trader determine whether to use trend-trading techniques or countertrend trading techniques. We have coded in Easy-Language the Excel specifics given in the article. We are also providing a function that calculates the volatility switch value, an indicator to plot the volatility switch (see Figure 1), and a strategy that illustrates the use of the function in a strategy. (The strategy is for illustrative purposes only.) For trend-following entries, the strategy uses a cross of a 10-bar simple moving average (SMA) with a 20-bar SMA. For countertrend entries, the strategy uses a cross of the two-bar relative strength index (RSI) with overbought and oversold levels set in the inputs. Strategy exits are simple five-bar price channel exits.
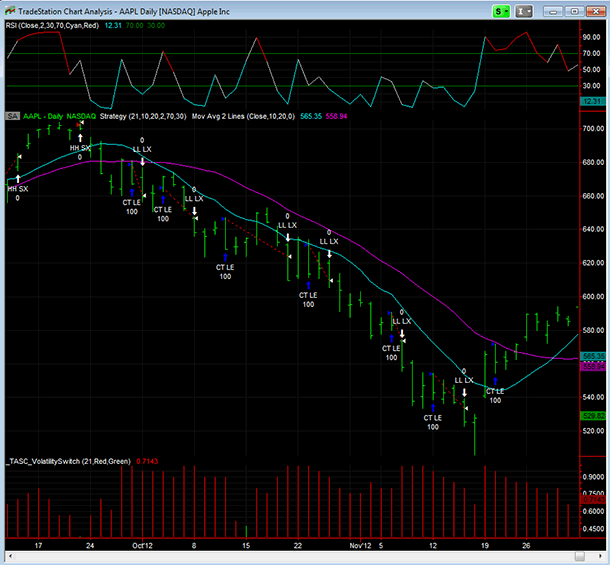
FIGURE 1: TRADESTATION. A daily bar chart of AAPL is plotted in subgraph 2. Indicators displayed include a two-bar RSI of the close plotted in subgraph 1; the built-in “Mov Avg 2 Lines” indicator (10-bar and 20-bar averages of the close) plotted with price; and the indicator referenced in McEwan’s article plotted in subgraph 3. The strategy code we’re providing applies and displays several entries and exits.
To download the EasyLanguage code for this strategy, first navigate to the EasyLanguage FAQs and Reference Posts Topic in the EasyLanguage support forum (https://www.tradestation.com/Discussions/Topic.aspx?Topic_ID=47452), scroll down, and click on the link labeled “Traders’ Tips, TASC.” Then select the appropriate link for the month and year. The ELD filename is “_TASC_VolatilitySwitch.ELD.”
_VolatilitySwitch ( Series Function )

{ TASC Article, Feb 2013 }
{ "The Volatility (Regime) Switch Indicator }
{ Ron McEwan }

inputs:
	int Length( numericsimple ) ; { number of bars for
	 the calculations of volatility and the switch
	 value }

variables:
	int Count( 0 ) ;

Count = 0 ;

for Value1 = 0 to Length - 1
	begin
	if StdDevS( ( Close - Close[1] ) /
	 ( ( Close + Close[1] ) / 2 ), Length )[Value1] <=
 	 StdDevS( ( Close - Close[1] ) /
 	  ( ( Close + Close[1] ) / 2 ), Length ) then
		Count += 1 ;
	end ;

_VolatilitySwitch = Count / Length ;

_TASC_VolatilitySwitch ( Indicator )

{ TASC Article, Feb 2013 }
{ "The Volatility (Regime) Switch Indicator }
{ Ron McEwan }

inputs:
	int Length( 21 ), { number of bars for the
	 calculations of volatility and the switch value }
	int MeanReversionColor( Red ), { color for plot
	 when switch value is greater than 0.5 }
	int TrendingColor( Green ) ; { color for plot
	 when switch value is less than 0.5 }

variables:
	double VolSwitch( 0 ),
	int PlotColor( 0 ) ;

VolSwitch = _VolatilitySwitch( Length ) ;

Plot1( VolSwitch, "VolSwitch" ) ;

{ set plot color based on volatility switch value }
if VolSwitch > 0.5 then
	SetPlotColor( 1, MeanReversionColor )
else if VolSwitch < 0.5 then
	SetPlotColor( 1, TrendingColor ) ;

{ alerts }
if AlertEnabled then
	begin
	if VolSwitch crosses over 0.5 then
		Alert( "Volatility Switch to Red" )
	else if VolSwitch crosses under 0.5 then
		Alert( "Volatility Switch to Green" ) ;
	end ;

_TASC_VolatilitySwitch_Strat ( Strategy )

{ TASC Article, Feb 2013 }
{ "The Volatility (Regime) Switch Indicator }
{ Ron McEwan }

{ THIS STRATEGY IS FOR ILLUSTRATIVE PURPOSES ONLY }

inputs:
	int Length( 21 ), { number of bars for the
	 calculations of volatility and the switch
	 value }
	int FastMALen( 10 ), { length for fast moving
	 average calculation }
	int SlowMALen( 20 ), { length for slow moving
	 average calculation }
	int RSILen( 2 ), { length for RSI calculation }
	double RSIOBLevel( 70 ), { OverBought level for
	 RSI }
	double RSIOSLevel( 30 ) ; { OverSold level for
	 RSI }

variables:
	int MP( 0 ),
	double VolSwitch( 0 ),
	double FastMA( 0 ),
	double SlowMA( 0 ),
	double RSIVal( 0 ),
	bool TrendingMode( false ),
	bool MACrossUp( false ),
	bool MACrossDown( false ) ;

MP = MarketPosition ; { 0 = flat, 1 = long,
 -1 = short }

VolSwitch = _VolatilitySwitch( Length ) ;

{ calculate moving averages to be used for trend
  following entries }
FastMA = Average( Close, FastMALen ) ;
SlowMA = Average( Close, SlowMALen ) ;

{ calculate the RSI; to be used for counter-trend
  entries }
RSIVal = RSI( Close, RSILen ) ;

{ detect crossing of fast and slow moving averages }
MACrossUp = FastMA crosses over SlowMA ;
MACrossDown = FastMA crosses under SlowMA ;

TrendingMode = VolSwitch < 0.5 ;

{ entries }
if TrendingMode and MP = 0 then { use trend trading
 techniques }
	begin
	if MACrossUp then
		Buy ( "Trend LE" ) next bar market ;
	if MACrossDown then
		SellShort ( "Trend SE" ) next bar market ;
	end
else if TrendingMode = false and MP = 0 then { not
 trending; use counter-trend techniques }
	begin
	if RSIVal crosses under RSIOBLevel then
		SellShort ( "CT SE" ) next bar market ;
	if RSIVal crosses over RSIOSLevel then
		Buy ( "CT LE" ) next bar market ;
	end ;

{ exits }
Sell ( "LL LX" ) next bar Lowest( Low, 5 ) stop ;
BuyToCover ("HH SX" )
 next bar Highest( High, 5 ) stop ;
This article is for informational purposes. No type of trading or investment recommendation, advice, or strategy is being made, given, or in any manner provided by TradeStation Securities or its affiliates.
—Chris Imhof
TradeStation Securities, Inc.
www.TradeStation.com
BACK TO LIST

METASTOCK: FEBRUARY 2013 TRADERS’ TIPS CODE
Ron McEwan’s article in this issue, “The Volatility (Regime) Switch Indicator,” explains how to calculate the volatility switch indicator. This indicator can be added to MetaStock using the following formula:
dr:= ROC(C,1,$)/Mov(C,2,S);
vola:= Stdev( dr, 21);
( (Ref( vola, -1) <= vola ) +
  (Ref( vola, -2) <= vola ) +
  (Ref( vola, -3) <= vola ) +
  (Ref( vola, -4) <= vola ) +
  (Ref( vola, -5) <= vola ) +
  (Ref( vola, -6) <= vola ) +
  (Ref( vola, -7) <= vola ) +
  (Ref( vola, -8) <= vola ) +
  (Ref( vola, -9) <= vola ) +
  (Ref( vola, -10) <= vola ) +
  (Ref( vola, -11) <= vola ) +
  (Ref( vola, -12) <= vola ) +
  (Ref( vola, -13) <= vola ) +
  (Ref( vola, -14) <= vola ) +
  (Ref( vola, -15) <= vola ) +
  (Ref( vola, -16) <= vola ) +
  (Ref( vola, -17) <= vola ) +
  (Ref( vola, -18) <= vola ) +
  (Ref( vola, -19) <= vola ) +
  (Ref( vola, -20) <= vola ) + 1) / 21
—William Golson
MetaStock Technical Support
Thomson Reuters
www.metastock.com
BACK TO LIST

eSIGNAL: FEBRUARY 2013 TRADERS’ TIPS CODE
For this month’s Traders’ Tip, we’ve provided the formula “VolatilitySwitch.efs” based on Ron McEwan’s article in this issue, “The Volatility (Regime) Switch Indicator.”
The study contains a formula parameter to set the period for “volatility days,” which may be configured through the Edit Chart window.
To discuss this study or download a complete copy of the formula code, please visit the EFS library discussion board forum under the forums link from the support menu at www.esignal.com or visit our EFS KnowledgeBase at https://www.esignal.com/support/kb/efs/. This eSignal formula script (EFS) is also available for copying and pasting below.
/*********************************
Provided By:
eSignal (Copyright c eSignal), a division of Interactive Data
Corporation. 2012. All rights reserved. This sample eSignal
Formula Script (EFS) is for educational purposes only and may be
modified and saved under a new file name.  eSignal is not responsible
for the functionality once modified.  eSignal reserves the right
to modify and overwrite this EFS file with each new release.

Description:
    The Volatility (Regime) Switch Indicator by Ron McEwan

Version:            1.00  12/10/2012

Formula Parameters:                         Default:
Volatility Days Period                      21


Notes:
The related article is copyrighted material. If you are not a subscriber
of Stocks & Commodities, please visit www.traders.com.

**********************************/

var fpArray = new Array();

function preMain()
{
    setStudyTitle("Volatility Switch");


    var x = 0;

    fpArray[x] = new FunctionParameter("gDays", FunctionParameter.NUMBER);
    with(fpArray[x++])
    {
        setName("Volatility Days Period");
        setLowerLimit(1);
        setDefault(21);
    }
}

var bInit = false;
var bVersion = null;

var xClose = null;


function main(gDays)
{
    if (bVersion == null) bVersion = verify();
    if (bVersion == false) return;


    if(!bInit)
    {
        xClose = close();
        bInit = true;
    }


    if (xClose.getValue(-gDays*2) == null) return;

    addBand(0.5,PS_DASH,1,Color.red,0);


    var vDailyRet_0 = 0;

    var vDailyRet_1 = 0;

    var nDailyRet = 0;


    var nSumDailyRet = 0; //for average

    var nSumDeviation = 0; //for deviation


    var i = 0;

    var j = 0;


    var nCnt = 0;

    var nAvg = 0;

    var nVol = 0;

    var nVol0 = 0;


    for (j=0; j>-gDays; j--)

    {

        //daily return and its average

        nSumDailyRet=0;

        for (i=j; i>j-gDays; i--)

        {

            vDailyRet_0 = xClose.getValue(i);
            vDailyRet_1 = xClose.getValue(i-1);

            nDailyRet = (vDailyRet_0-vDailyRet_1)/((vDailyRet_0+vDailyRet_1)/2);


            nSumDailyRet +=  nDailyRet;

        }

        nAvg = nSumDailyRet/gDays;


        //21nd hist Volatility (standart deviation)

        nSumDeviation = 0; nVol=0;

        for (i=j; i>j-gDays; i--)

        {

            vDailyRet_0 = xClose.getValue(i);
            vDailyRet_1 = xClose.getValue(i-1);

            nDailyRet = (vDailyRet_0-vDailyRet_1)/((vDailyRet_0+vDailyRet_1)/2);


            nSumDeviation += (nAvg - nDailyRet)*(nAvg - nDailyRet);

        }
        nVol=Math.sqrt(nSumDeviation/gDays);


        //remember 21nd hist Volatility for current bar

        if (j==0) nVol0=nVol;

        //compare 21nd hist Volatility for current and previous bars

        if (nVol<=nVol0) nCnt++;

    }


    var nVolSwitch = nCnt/gDays;
    return nVolSwitch;
}


function verify() {
    var b = false;
    if (getBuildNumber() < 779) {
        drawTextAbsolute(5, 35, "This study requires version 8.0 or later.",
            Color.white, Color.blue, Text.RELATIVETOBOTTOM|Text.RELATIVETOLEFT|Text.BOLD|Text.LEFT,
            null, 13, "error");
        drawTextAbsolute(5, 20, "Click HERE to upgrade.@URL=https://www.esignal.com/download/default.asp",
            Color.white, Color.blue, Text.RELATIVETOBOTTOM|Text.RELATIVETOLEFT|Text.BOLD|Text.LEFT,
            null, 13, "upgrade");
        return b;
    } else {
        b = true;
    }
    return b;
}
A sample chart is shown in Figure 2.
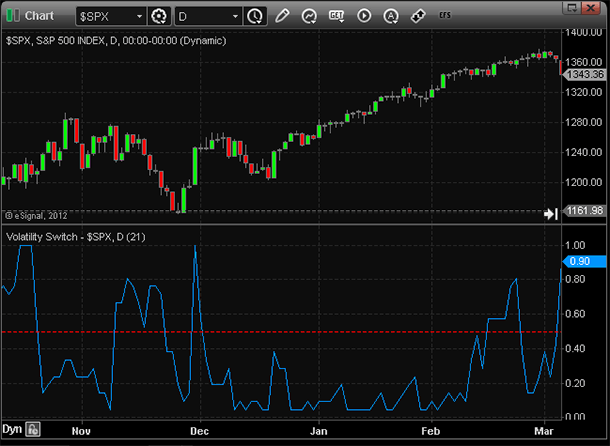
FIGURE 2: eSIGNAL. The chart shows implementation of the VolatilitySwitch.efs formula.
—Jason Keck
eSignal, an Interactive Data company
800 779-6555, www.eSignal.com
BACK TO LIST

BLOOMBERG: FEBRUARY 2013 TRADERS’ TIPS CODE
In his article in this issue, “The Volatility (Regime) Switch Indicator,” author Ron McEwan provides a new tool to help ascertain the stage of the market, from consolidation to trend, using a volatility “switch” based on a simple formula that can be set up in a Microsoft Excel spreadsheet (as was done in the article) or used on a price chart to output PaintBars for simple evaluation (see Figure 3). Depending on the final value of this oscillator, McEwan creates red painted bars for current or upcoming consolidation or “mean reversion,” and green bars when a market is in a trend or when one is imminent.
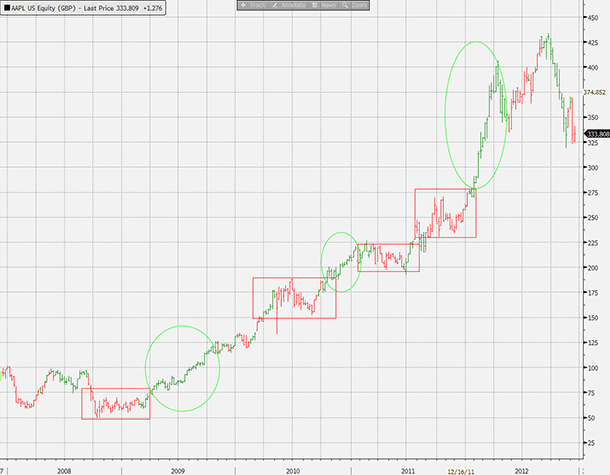
FIGURE 3: BLOOMBERG. This five-year weekly chart of Apple shows the exponential move in this security from 2008 through 2012. While no indicator will prove to be 100% accurate, the circled and boxed areas around portions of the chart show that the volatility switch indicator was able to determine a number of “switches” between trend and mean reversion. Virtually this entire five-year period can easily be broken up into these different market modes simply by looking at the colors painted by the volatility (regime) switch indicator.
While no indicator is always accurate, and McEwan does suggest using complementary indicators for further confirmation, the volatility switch indicator can give a quick and easily recognizable indication of what approach will likely be most successful as a first step in the analysis process. We have recreated this indicator with the ability to also output the actual value of the volatility switch in a subpanel below the price chart for easy verification of its behavior, as well as noting any progression that might also point to an imminent “switch” in the dynamic of the market.
Using the CS.NET framework within the STDY<GO> function on the Bloomberg Terminal, C# or Visual Basic code can be written to display the volatility (regime) switch indicator described here. The C# code for this indicator is also provided here. All Bloomberg code contributions to Traders’ Tips can also be found in the sample files provided with regular SDK updates, and the studies will be included in the Bloomberg global study list.
using System;
using System.Collections.Generic;
using System.Text;
using System.Drawing;
using Bloomberg.Study.API;
using Bloomberg.Study.CoreAPI;
using Bloomberg.Study.Util;
using Bloomberg.Study.TA;
using Bloomberg.Math;

namespace VolatilitySwitchIndicator
{

    public partial class VolatilitySwitchIndicator
    {
        // Create Input for users to change the analysis period of the indicator
        public StudyIntegerProperty VolatilityPeriod = new StudyIntegerProperty(21);

        private void Initialize()
        {

            // Create 2 PaintBar StudySignals for Green or Red Bars
            Output.Add("PaintUp", new TimeSeries());
            StudySignal pntbarUp = new StudySignal("PaintUp");
            pntbarUp.Marker = new PaintBar(Color.Green);
            ParentPanel.Visuals.Add("Paint Up", pntbarUp);

            Output.Add("PaintDn", new TimeSeries());
            StudySignal pntbarDn = new StudySignal("PaintDn");
            pntbarDn.Marker = new PaintBar(Color.Red);
            ParentPanel.Visuals.Add("Paint Dn", pntbarDn);

            // Create a sub-panel with a StudyLine to output the Volatility Switch Value if desired
            // The panel will not show by default
            Panels.Add("Volatility Switch Panel", new StudyPanel());
            Output.Add("Volatility Switch", new TimeSeries());
            StudyLine VS = new StudyLine("Volatility Switch", Color.DeepSkyBlue);
            VS.Width = 2;
            Panels["Volatility Switch Panel"].Visuals.Add("Volatility Switch", VS);
            Panels["Volatility Switch Panel"].Visible = false;

            // Backfill enough data to insure output on the first bar on the chart
            Settings.BackData = new StudyIntegerExpression(VolatilityPeriod) * 2;
        }


        public override void Calculate()
        {
            int vp = VolatilityPeriod.Value;
            TimeSeries close = Input.Close;
            TimeSeries VolatilitySwitch = new TimeSeries(close.Count);
            TimeSeries greenbar = new TimeSeries(close.Count);
            TimeSeries redbar = new TimeSeries(close.Count);

            TimeSeries closePrevious = close.ShiftRight(1); // Create time series for previous close
            TimeSeries DailyReturn = ((close - closePrevious) / ((close + closePrevious) / 2));
            TimeSeries volatility = Indicator.MovingStdDev(DailyReturn, vp);

            for (int ii = vp * 2; ii < close.Count; ii++)
            {
                redbar[ii] = 0;
                greenbar[ii] = 0;


                // Use a counter in a loop for equivalent of Excel "COUNTIF()" in order to count the
                // number of bars over the 'test period' with volatility less than the current bar
                int counter = 0;
                for (int jj = ii; jj > ii - vp; jj--)
                {
                    if (volatility[jj] <= volatility[ii])
                    {
                        counter += 1;
                    }
                }

                VolatilitySwitch[ii] = (double)counter / vp;

                // Establish correct PaintBar color based on Volatility Switch Value
                if (VolatilitySwitch[ii] >= 0.5)
                {
                    redbar[ii] = 1;
                }
                else greenbar[ii] = 1;
            }

            Output.Update("PaintUp", greenbar);
            Output.Update("PaintDn", redbar);
            Output.Update("Volatility Switch", VolatilitySwitch);
        }

    }

}
—Bill Sindel
Bloomberg, LP
wsindel@bloomberg.net
BACK TO LIST

WEALTH-LAB: FEBRUARY 2013 TRADERS’ TIPS CODE
In “The Volatility (Regime) Switch Indicator” in this issue, author Ron McEwan presents a simple, intuitive yet seemingly effective new indicator of which the purpose is to act as a filter in a trading strategy, facilitating it to adapt to changing market conditions. A change from a trending mode to a mean-reverting one is measured through a ratio dividing the number of bars when the historical volatility (HV) of the daily close price change in a given lookback period was lower or equal to today’s daily ROC’s HV.
To take advantage of the volatility switch technique in Wealth-Lab’s charts, code, and interactive rule-based strategies, simply install (or update if you haven’t done so already) the TASCIndicators library from the www.wealth-lab.com site to its latest version.
To illustrate the application of the new regime filter (Figure 4), we created a demo system that takes entries and exits depending on the market’s volatility switch state: above 0.5 is considered choppy with a potential for mean reversion; at or below 0.5 is more likely to trend.
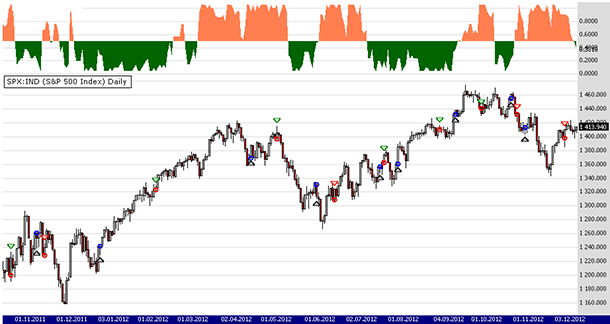
FIGURE 4: WEALTH-LAB, TREND/MEAN REVERSION SYSTEM. Here’s a daily chart of SPY illustrating application of a trend/mean reversion trading system powered by Ron McEwan’s volatility switch filter.
Entry rules
- If the volatility switch is in trend mode, buy at the market on the next bar when today’s close crosses above the 10-day simple moving average of the close price
- If the volatility switch is in mean-reversion mode, buy at the market on the next bar when the seven-day RSI crosses above 30
Exit rules
- If the volatility switch is in trend mode, sell at the market on the next bar when today’s close crosses below the 10-day simple moving average of the close price
- If the volatility switch is in mean-reversion mode, buy at the market on the next bar when the seven-day RSI crosses below 60.
We ran a backtest with $10,000 per trade on five years of SPY daily data. With real-world position sizing and trading cost rules applied, the simplistic system was able to beat buy & hold, returning a 26% net profit figure (versus -6% for buy & hold), proving that the regime switch filter can become a valuable addition to a trader’s arsenal. (See Figure 5.)
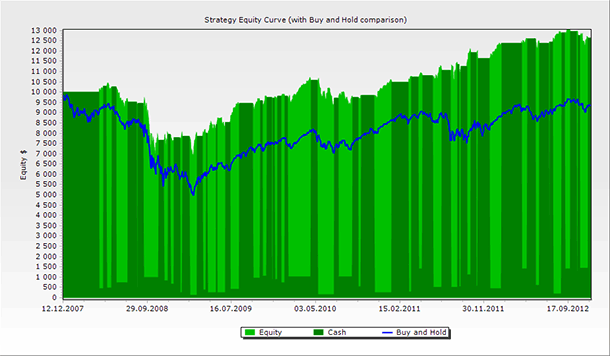
FIGURE 5: WEALTH-LAB, EQUITY CURVE FOR SYSTEM. Here’s a sample chart of the strategy’s equity curve versus that of a buy & hold strategy.
The C# code for Wealth-Lab for this system is shown below.
C# Code:

using System;
using System.Collections.Generic;
using System.Text;
using System.Drawing;
using WealthLab;
using WealthLab.Indicators;
using TASCIndicators;

namespace WealthLab.Strategies
{
	public class EwanRegimeSwitchStrategy : WealthScript
	{
		private StrategyParameter paramPeriod;

		public EwanRegimeSwitchStrategy()
		{
			paramPeriod = CreateParameter("Period", 21, 2, 100, 1);
		}

		protected override void Execute()
		{
			int period = paramPeriod.ValueInt;
			VolatilitySwitch voltSwitch = VolatilitySwitch.Series( Close,period );

			for(int bar = GetTradingLoopStartBar( period * 3 ); bar < Bars.Count; bar++)
			{
				bool regimeSwitchIsTrending = voltSwitch[bar] > 0.5 ? false : true;

				if (IsLastPositionActive)
				{
					Position p = LastPosition;

					if( regimeSwitchIsTrending )
					{
						if( CrossOver( bar, Close, SMA.Series( Close,10 ) ) )
							SellAtMarket( bar+1, p, "Trend exit" );
					}
					else
					{
						if( CrossUnder( bar, RSI.Series( Close,7 ), 60 ) )
							SellAtMarket( bar+1, p, "MR exit" );
					}
				}
				else
				{
					if( regimeSwitchIsTrending )
					{
						if( CrossOver( bar, Close, SMA.Series( Close,10 ) ) )
							BuyAtMarket( bar+1, "Trend" );
					}
					else
					{
						if( CrossOver( bar, RSI.Series( Close,7 ), 30 ) )
							BuyAtMarket( bar+1, "Mean reversion" );
					}
				}
			}

			ChartPane vrsPane = CreatePane( 30,true,true );
			PlotSeriesOscillator( vrsPane, voltSwitch, 0.5, 0.499, Color.Coral, Color.DarkGreen, Color.Transparent, LineStyle.Solid, 1 );
			HideVolume();
		}
	}
}
—Wealth-Lab team
www.wealth-lab.com
BACK TO LIST

AMIBROKER: FEBRUARY 2013 TRADERS’ TIPS CODE
In “The Volatility (Regime) Switch Indicator” in this issue, author Ron McEwan presents a simple volatility switch indicator. A ready-to-use formula for exploration and for the indicator is presented here. To display the indicator, simply input the formulas into the formula editor and press “Apply Indicator” to display the exploration (which is an Excel-like table). Then choose the Tools → Exploration menu item in the formula editor.
function CountLE( array, periods )
{
 Count = 0;
 for( i = 0; i < periods; i++ )
  Count += Ref( array, -i ) <= array;

 return Count;
}

function ExStDev( array, periods )
{
 // AB's StDev is Excel's StdDevP so we need to convert
 return StDev( array, periods ) * sqrt( periods / (periods-1) );
}

C1 = Ref( C, -1 );
DR = (C - C1 ) / (( C+ C1)/2);
HistVol = ExStDev( DR, 21 );
VolSwitch = CountLE( HistVol, 21 )/21;

r = RSI(2);
ms = MA( C, 20 );
ml = MA( C, 50 );


AddColumn( Close, "Close" );
AddColumn( DR, "Daily Return", 1.3 );
AddColumn( HistVol, "Hist Volatility", 1.3 );
AddColumn( VolSwitch, "Volatility Switch", 1.4,
           IIf( VolSwitch < 0.5, colorGreen, colorRed ) );
AddColumn( r, "RSI(2)" );
AddColumn( ms, "MA(20)" );
AddColumn( ml, "MA(50)" );
Filter = 1;


Plot( C, Name(), colorDefault , styleCandle);

Plot( ms, "MA(20)", colorRed );
Plot( ml, "MA(50)", colorBlue );
A sample chart is shown in Figure 6.
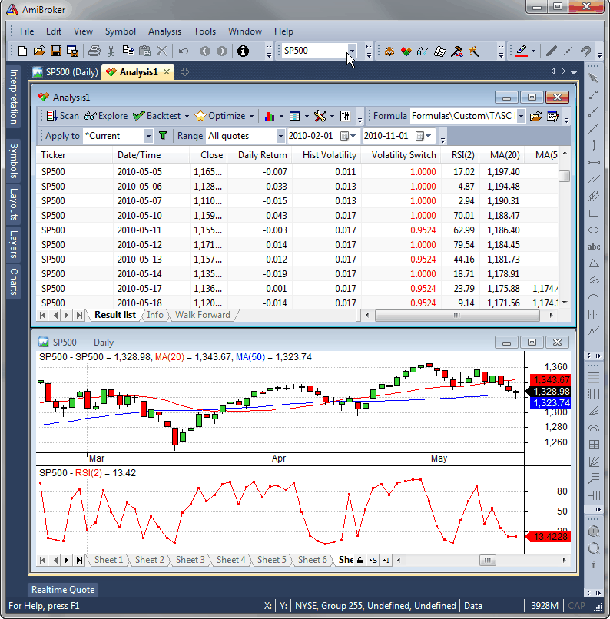
FIGURE 6: AMIBROKER. Here is an exploration (upper window) and a chart (lower window) created using the volatility switch formula.
—Tomasz Janeczko, AmiBroker.com
www.amibroker.com
BACK TO LIST

AIQ: FEBRUARY 2013 TRADERS’ TIPS CODE
The AIQ code based on Ron McEwan’s article in this issue, “The Volatility (Regime) Switch Indicator,” is provided at the website www.TradersEdgeSystems.com/traderstips.htm.
To test the author’s volatility switch indicator, I used the NASDAQ 100 list of stocks and AIQ’s Portfolio Manager. A long-only trading simulation was run with the following capitalization, cost, and exit settings:
- Maximum of 10 open positions
- Size each position at 10% of mark-to-market total capital
- Take no more than three new positions per day
- Compute the mark-to-market capital each day
- Three cents per share was deducted for each round-turn trade
- Select trades based on the lowest three-bar RSI reading
- Exit trades only with a system exit; no stop-loss or profit target stop used.
I coded four similar test systems. All systems enter & exit on the next bar at open after the respective entry or exit rule becomes true at the close of the bar:
System 1: A basic trend-following system that buys when the close of a stock is above its moving average and the moving average is higher than it was 10 bars ago. Exit when the close is below the moving average.
System 2: The same as System 1 with the volatility switch filter added to the entry and exit rules for the stock.
System 3: The same as System 2 with System 2 rules also added to the market using the NASDAQ 100 index (NDX) to represent the market conditions.
System 4: The same as System 1 but with the volatility switch filter and the trend-following rules added to the market index (NDX).
I used the author’s parameters of 21 days for the volatility length and 50 for the volatility switch level. Note that my coding of the indicator is multiplied by 100. To determine the trend, I used a 50-bar moving average. For the period 12/30/1994 to 12/12/2012, the systems returned the results shown in the table in Figure 7.
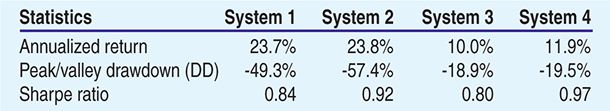
Figure 7: AIQ, SYSTEM BACKTEST RESULTS. For the period 12/30/1994 to 12/12/2012, the four system variations returned these results.
In Figure 8, I show the equity curves for all four systems, with the largest graph showing the equity curve for System 4, which is the one I prefer due to the relatively low drawdown and the highest Sharpe ratio. Adding the volatility switch filter only to the stocks (System 2) did not reduce the drawdown but the return increased very slightly and the Sharpe ratio was one of the highest. Adding the filter to both the stock and the market (System 3) dramatically reduced the drawdown, but the return and Sharpe ratio also were significantly reduced. Adding the filter only to the market index thus seems the best compromise. The tests tend to show that the filter can be used to reduce drawdown and increase reward-to-risk ratios.
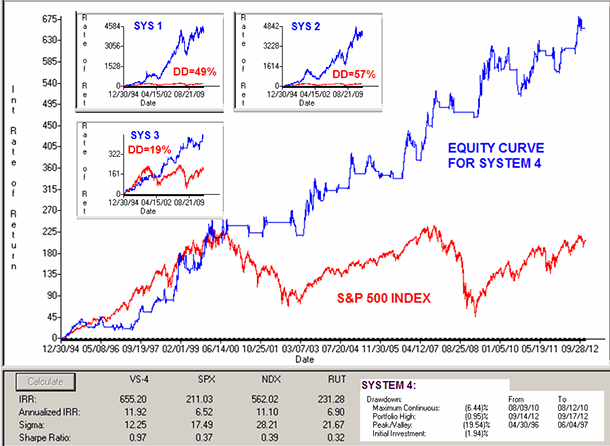
FIGURE 8: AIQ. Long-only equity curves (blue) compared to the S&P 500 (red) for the test period 12/30/1994 to 12/12/2012 trading the NASDAQ 100 list of stocks.
The code and EDS file can be downloaded from www.TradersEdgeSystems.com/traderstips.htm. The code is also shown below.
!THE VOLATILITY (REGIME) SWITCH INDICATOR
!Author: Ron McEwan
!Coded by: Richard Denning 12/7/12
!www.TradersEdgeSystems.com

!INPUTS:
volaLen is 21.
maLen 	is 50.
volaLvl is 50.
rsiExitLvl is 90.

!ABREVIATIONS:
C is [close].
C1 is valresult(C,1).

!INDICATOR FUNCTIONS:
MA 	is simpleavg(C,maLen).
RC1 	is (C-C1)/((C+C1)/2).
SD 	is sqrt(variance(RC1,volaLen)).
Count 	is countof(SD <= ∧SD,volaLen).
VolaSwitch is Count / volaLen * 100.

!TRADING SYSTEM RULES:
!SYSTEM 1: TREND FOLLOWING WITHOUT VOLASWITCH FILTER:
	Buy if C > MA and MA > valresult(MA,10).
	ExitBuy if C < MA.
!SYSTEM 2: TREND FOLLOWING WITH VOLASWITCH FILTER:
	BuyVS if VolaSwitch < volaLvl and C > MA and MA > valresult(MA,10).
	ExitBuyVS if (VolaSwitch > volaLvl and C < MA)
	  or (VolaSwitch > volaLvl and rsi3 > rsiExitLvl).
!SYSTEM 3: TREND FOLLOWING WITH VOLASWITCH & MARKET TIMING:
	BuyVSM if BuyVS and TickerRule("NDX",BuyVS).
	ExitBuyVSM if ExitBuyVS or TickerRule("NDX",ExitBuyVS).
!SYSTEM 4: TREND FOLLOWING WITH VOLASWITCH MARKET TIMING APPLIED ONLY TO NDX:
	BuyMvs if Buy and TickerRule("NDX",BuyVS).
	ExitBuyMvs if ExitBuy or TickerRule("NDX",ExitBuyVS).

!RSI WILDER (FOR SYSTEM 2 EXIT):
U 	is [close]-val([close],1).
D 	is val([close],1)-[close].
W1	is 3.
rsiLen1	is 2 * W1 - 1.
AvgU 	is ExpAvg(iff(U>0,U,0),rsiLen1).
AvgD 	is ExpAvg(iff(D>=0,D,0),rsiLen1).
rsi3 	is 100-(100/(1+(AvgU/AvgD))).
—Richard Denning
info@TradersEdgeSystems.com
for AIQ Systems
BACK TO LIST

TRADERSSTUDIO: FEBRUARY 2013 TRADERS’ TIPS CODE
The TradersStudio code based on Ron McEwan’s article in this issue, “The Volatility (Regime) Switch Indicator,” is provided at the following sites:
The following code files are provided in the download:
- Function: “VOLA_SWITCH” is a function that returns the volatility switch of the price inputs
- Indicator plot: “DMI_OSC_IND” is indicator code that plots the volatility switch oscillator with a line at the 50 level
- System: “VOLA_SWITCH_SYS” is a system of my design to test the author’s indicator.
Parameters:
- volaLen = The length used for the volatility calculation
- maLen = Length of the moving average used to determine trend direction
- vsLvl = The maximum level for a trending market
- exitBuyLvl = Level on the RSI when in nontrending mode for an exit.
The rules of the test system are as follows (long-only):
Go long when:
- The close is greater than the moving average, and
- The moving average is higher than it was 10 bars ago, and
- The volatility switch indicator is below the critical level (“vsLvl”).
Exit longs when:
- The volatility switch is greater than the critical level and the close is below the moving average, or
- The volatility switch is greater than the critical level and the three-bar RSI is above the critical level (“exitBuyLvl”).
I set up a test session using the PowerShares QQQ exchange traded fund (using data from Pinnacle Data). I then optimized the parameters and found the RSI exit level of 75 to be in a good zone. Note that I did not optimize the length of the moving average. In Figure 9, I show the parameter optimization map for trading only the long side with the system on the QQQ from 1/2/1990 through 12/10/2012. The buy level parameters between 55 and 65, together with the volatility length between 120 and 180, look good without any spikes in the map. There is a spike at the 200 length but that was my maximum value tested, so more optimization with longer values is recommended. I then ran a backtest trading 100 shares for the same period with the parameter set (160, 50, 50, 75) trading long only.
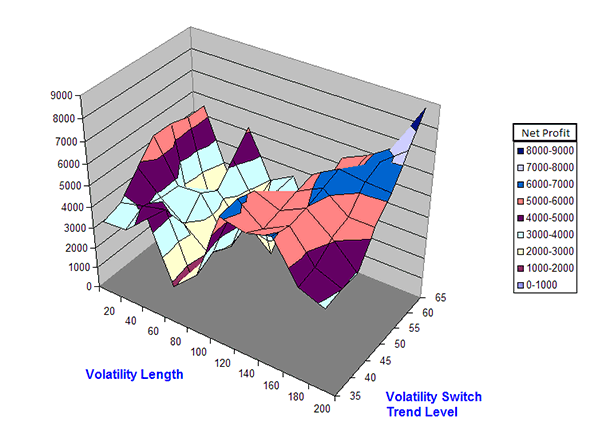
FIGURE 9: TRADERSSTUDIO, PARAMETER OPTIMIZATION GRAPH. Here is a three-dimensional parameter optimization graph for the system trading the QQQ ETF for the period 1990 through 2012.
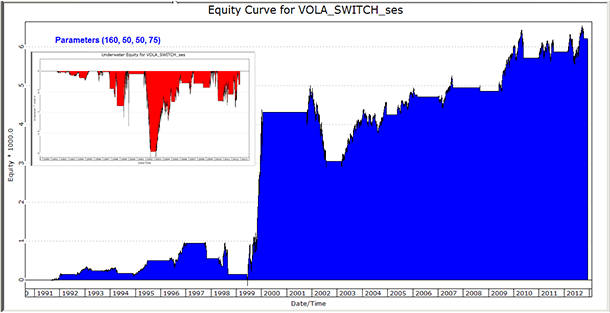
The resulting equity curve and underwater equity curve are shown in Figure 10. Trading just 100 shares of the QQQ, the system returned a profit of $6,221 with a maximum drawdown of $2,094 on 7/18/2002 with a profit factor of 3.55.
'VOLATILITY (REGIME) SWITCH INDICATOR
'Author: Ron McEwan TASC Feb 2013
'Coded by: Richard Denning 12/10/12
'www.TradersEdgeSystems.com

'FUNCTION TO COMPUTE INDICATOR VALUES
Function VOLA_SWITCH(price as bararray,volaLen)
Dim change1 As BarArray
Dim stdev As BarArray
Dim todaySD 'As BarArray
Dim counter, n
change1 = (price - price[1]) / (price + price[1])/2
stdev = StdDev(change1,volaLen,0)
todaySD = stdev
counter = 0
For n = 1 To volaLen - 1
    If stdev[n] <= stdev[0] Then counter = counter + 1
Next
'Print FormatDateTime(Date)," count ",counter
VOLA_SWITCH = counter / volaLen
End Function
'------------------------------------------------------
'INDICATOR PLOT
Sub VOLA_SWITCH_IND(volaLen)
Dim VS As BarArray
VS = VOLA_SWITCH(C,volaLen)*100
plot1(VS)
plot2(50)
End Sub
'------------------------------------------------------
'TRADING SYSTEM
Sub VOLA_SWITCH_SYS(volaLen,maLen,vsLvl,exitBuyLvl)
Dim VS As BarArray
Dim MA As BarArray
VS = VOLA_SWITCH(C,volaLen)*100
MA = Average(C,maLen)
If VS <= vsLvl And C > MA Then Buy("LE",1,0,Market,Day)
If VS > vsLvl And C < MA Then ExitLong("LX_MA","",1,0,Market,Day)
If VS > vsLvl And rsi(C,3,0) > exitBuyLvl Then ExitLong("LX_RSI","",1,0,Market,Day)
End Sub
'------------------------------------------------------
—Richard Denning
info@TradersEdgeSystems.com
for TradersStudio
BACK TO LIST

NEUROSHELL TRADER: FEBRUARY 2013 TRADERS’ TIPS CODE
The volatility switch indicator, described by Ron McEwan in his article in this issue (“The Volatility (Regime) Switch Indicator”), can be implemented in NeuroShell Trader using NeuroShell Trader’s ability to call external programs. The programs may be written in C, C++, Power Basic, or Delphi.
After coding the indicator in your preferred compiler and creating a DLL, you can insert the resulting volatility indicator as follows:
- Select “New Indicator...” from the Insert menu.
- Choose the “External Program & Library Calls” category.
- Select the appropriate “External DLL Call” indicator.
- Set up the parameters to match your DLL.
- Select the Finished button.
Users of NeuroShell Trader can go to the Stocks & Commodities section of the NeuroShell Trader free technical support website to download a copy of this or any previous Traders’ Tips.
A sample chart is shown in Figure 11.
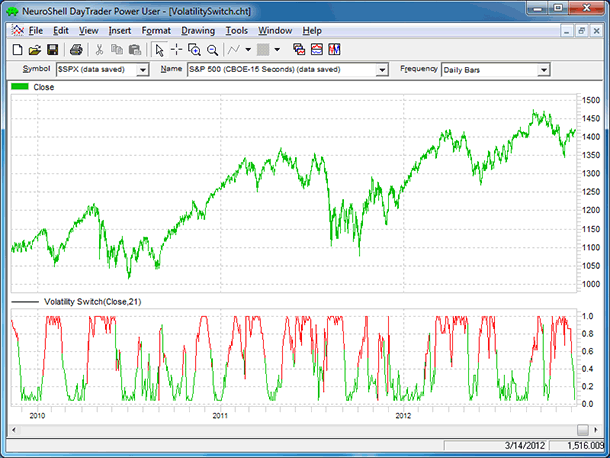
FIGURE 11: NEUROSHELL TRADER. This NeuroShell Trader chart displays the volatility switch indicator.
—Marge Sherald, Ward Systems Group, Inc.
301 662-7950, sales@wardsystems.com
www.neuroshell.com
BACK TO LIST

NINJATRADER: FEBRUARY 2013 TRADERS’ TIPS CODE
We have implemented in NinjaTrader the volatility switch indicator as discussed by author Ron McEwan in his article in this issue, “The Volatility (Regime) Switch Indicator.”
Users can download the indicator from www.ninjatrader.com/SC/February2013SC.zip.
Once it has been downloaded, from within the NinjaTrader Control Center window, select the menu File → Utilities → Import NinjaScript and select the downloaded file. This file is for NinjaTrader version 7 or greater.
You can review the indicator source code by selecting the menu Tools → Edit NinjaScript → Indicator from within the NinjaTrader Control Center window and selecting “VolatilitySwitch.”
A sample chart implementing the strategy is shown in Figure 12.
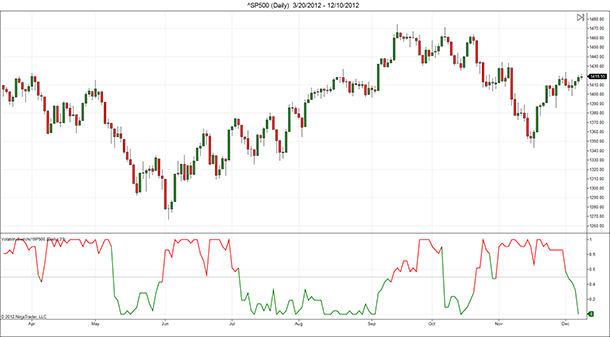
FIGURE 12: NINJATRADER. The screenshot shows VolatilitySwitch applied to a daily chart of S&P 500 (∧SP500).
—Raymond Deux & Ryan Millard
NinjaTrader, LLC
www.ninjatrader.com
BACK TO LIST

UPDATA: FEBRUARY 2013 TRADERS’ TIPS CODE
This is based on “The Volatility (Regime) Switch Indicator” in this issue by Ron McEwan.
In his article, McEwan delivers a volatility regime switching model based on the normalization of the standard deviation of returns. Price candles are colored according to the indicator’s reading above or below 0.5: the greater the indicator value, the greater the volatility, and thus a mean-reverting phase is indicated. The converse is true for trending phases. Consistent with the recommendations from the author, all parameters of these indicators are optimizable within Updata.
The Updata code for both versions of this indicator (either combined with RSI, as displayed in Figure 13, or with two moving averages, as shown in Figure 14) is in the Updata Library and may be downloaded by clicking the Custom menu and then “Indicator Library.” Those who cannot access the library due to a firewall may paste the code shown below into the Updata Custom editor and save it.
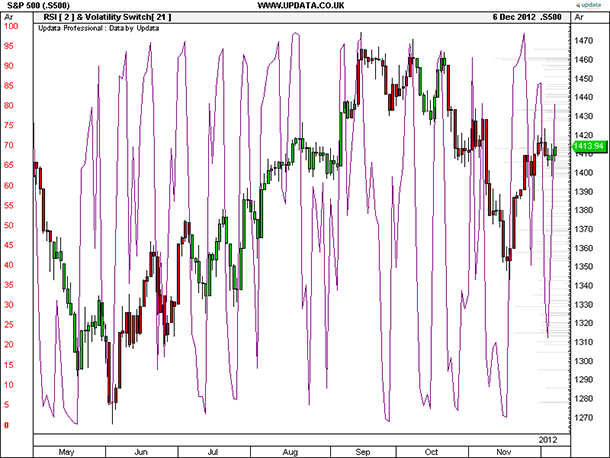
FIGURE 13: UPDATA. Here is the daily S&P 500 with candles colored according to the volatility regime: green (<0.5) indicates trending, red (>0.5) indicates mean-reverting, with a two-period RSI overlaid.
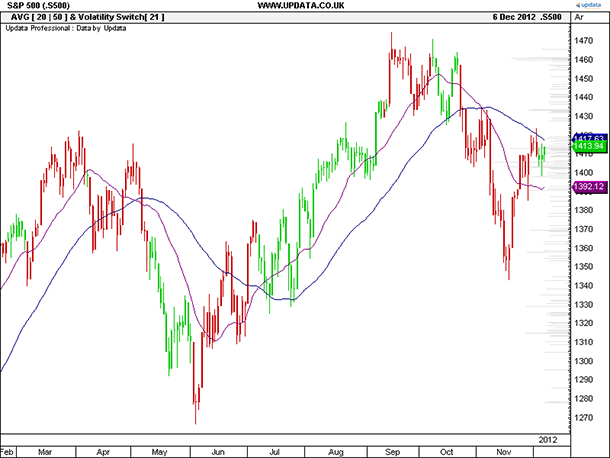
FIGURE 14: UPDATA, INDICATOR WITH TWO MOVING AVERAGES. Here is the daily S&P 500 with candles colored according to the volatility regime: green (<0.5) indicates trending, red (>0.5) indicates mean-reverting, with 20- and 50-period moving averages overlaid.
'VolatilitySwitchMovAvg

DISPLAYSTYLE 3LINES
INDICATORTYPE CHART REPLACE
INDICATORTYPE2 CHART SUPERIMPOSERIGHT
INDICATORTYPE3 CHART SUPERIMPOSERIGHT
PLOTSTYLE CANDLE
PLOTSTYLE2 LINE RGB(128,0,128)
PLOTSTYLE3 LINE RGB(0,0,128)
PARAMETER "Volatility Period" #volPERIOD=21
PARAMETER "Avg. Period 1" #avgPERIOD1=20
PARAMETER "Avg. Period 2" #avgPERIOD2=50
NAME "AVG [" #avgPERIOD1 "|" #avgPERIOD2 "] & Volatility Switch[" #volPERIOD "]" ""
@DAILYRETURN=0
@HISTORICVOLATILITY=0
#i=0
#COUNT=0
@VOLATILITYSWITCH=0
@AVG1=0
@AVG2=0
FOR #CURDATE=#volPERIOD TO #LASTDATE
   @DAILYRETURN=(CLOSE-CLOSE(1))/((CLOSE+CLOSE(1))/2)
   @HISTORICVOLATILITY=STDDEV(@DAILYRETURN,#volPERIOD)
   #COUNT=0
   @AVG1=MAVE(#avgPERIOD1)
   @AVG2=MAVE(#avgPERIOD2)
   For #i=0 TO (#volPERIOD-1)
       if HIST(@HISTORICVOLATILITY,#i)<=@HISTORICVOLATILITY
          #COUNT=#COUNT+1
       endif
   Next
   @VOLATILITYSWITCH=#COUNT/#volPERIOD
  'Draw Candles Coloured According to Vol Indicator
   IF @VOLATILITYSWITCH>0.5
      COLOUR RGB(200,0,0)
      @PLOTOPEN=OPEN
      @PLOTHIGH=HIGH
      @PLOTLOW=LOW
      @PLOT=CLOSE
   ELSE
      COLOUR RGB(0,200,0)
      @PLOTOPEN=OPEN
      @PLOTHIGH=HIGH
      @PLOTLOW=LOW
      @PLOT=CLOSE
   ENDIF
   @PLOT2=@AVG1
   @PLOT3=@AVG2
NEXT

'VolatilitySwitchRSI

DISPLAYSTYLE 2LINES
INDICATORTYPE CHART REPLACE
INDICATORTYPE2 CHART SUPERIMPOSELEFT
PLOTSTYLE CANDLE
PLOTSTYLE2 LINE RGB(128,0,128)
PARAMETER "Volatility Period" #volPERIOD=21
PARAMETER "RSI Period" #rsiPERIOD=2
NAME "RSI [" #rsiPERIOD "] & Volatility Switch[" #volPERIOD "]" ""
@DAILYRETURN=0
@HISTORICVOLATILITY=0
#i=0
#COUNT=0
@VOLATILITYSWITCH=0
@RSI=0
FOR #CURDATE=#volPERIOD TO #LASTDATE
   @DAILYRETURN=(CLOSE-CLOSE(1))/((CLOSE+CLOSE(1))/2)
   @HISTORICVOLATILITY=STDDEV(@DAILYRETURN,#volPERIOD)
   #COUNT=0
   @RSI=RSI(#rsiPERIOD)
   For #i=0 TO (#volPERIOD-1)
       if HIST(@HISTORICVOLATILITY,#i)<=@HISTORICVOLATILITY
          #COUNT=#COUNT+1
       endif
   Next
   @VOLATILITYSWITCH=#COUNT/#volPERIOD
  'Draw Candles Coloured According to Vol Indicator
   IF @VOLATILITYSWITCH>0.5
      COLOUR RGB(200,0,0)
      @PLOTOPEN=OPEN
      @PLOTHIGH=HIGH
      @PLOTLOW=LOW
      @PLOT=CLOSE
   ELSE
      COLOUR RGB(0,200,0)
      @PLOTOPEN=OPEN
      @PLOTHIGH=HIGH
      @PLOTLOW=LOW
      @PLOT=CLOSE
   ENDIF
   @PLOT2=@RSI
NEXT
—Updata support team
support@updata.co.uk
www.updata.co.uk
BACK TO LIST

TRADING BLOX: FEBRUARY 2013 TRADERS’ TIPS CODE
Coding the volatility switch indicator in Trading Blox can be achieved in a few easy steps:
Open the Blox editor, create a new auxiliary type block, and name it “volatility switch indicator.” This block only requires one script, which is the “update indicators” script. Make sure that script is already in the block, or add it using the “script/add” menu item in the Blox editor. The logic to calculate the volatility switch indicator will reside in this script.
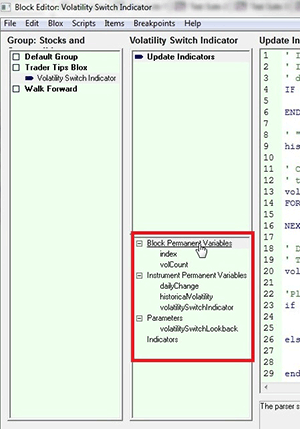
We also need to create two block permanent variables (BPVs), three instrument permanent variables (IPVs), and one parameter for this block. Create them by double-clicking the item or right-clicking and choosing “New” on the appropriate item.
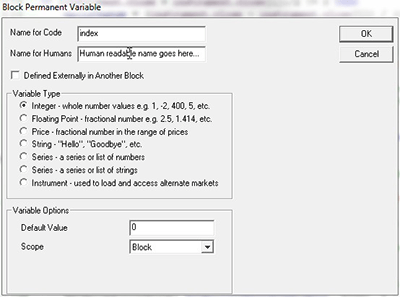
Create the first BPV and name it “index.” Check the box next to “integer,” since this variable will be used as a simple counter by the logic on the “update indicators” script. Create a second integer-type BPV named “volCount” in the same way as the first BPV. This variable will also be used by the “update indicators” script to track an intermediate value in our indicator calculation.
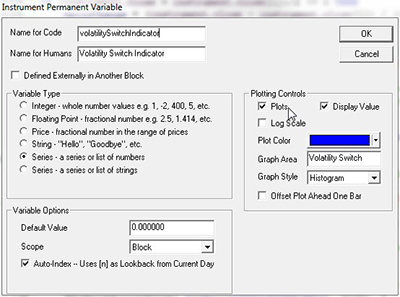
In a similar manner, we need to create three new IPVs: dailyChange, historicalVolatility, and volatilitySwitchIndicator. They are all auto-indexed series types, but only volatilitySwitchIndicator is plotted on the trade chart by checking the “plots” box in the plotting controls section of the IPV editor window. It is also the only variable where we need to populate the “name for humans” field, which will show on the trade chart.
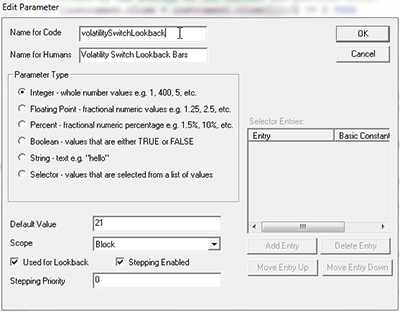
Once we have the two BPVs and three IPVs defined, we need to create an integer-type parameter called “volatilitySwitchLookback.” This will determine the number of bars over which the volatility switch indicator is calculated. The default period is 21 bars.
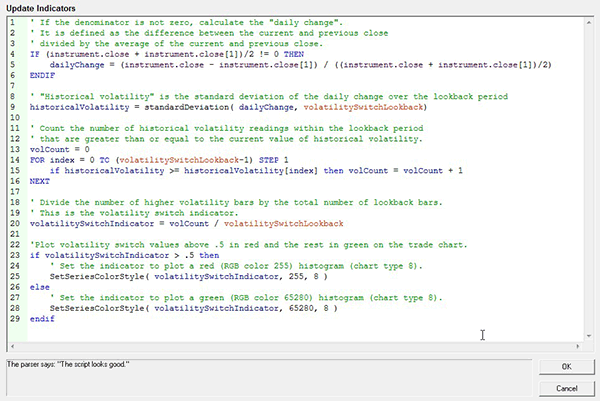
Finally, we can fill in the scripting logic needed to calculate the volatility switch indicator and plot it on the trade chart in the appropriate format. Place the code shown here in the scripting section of the Blox editor for the “update indicators” script. An apostrophe indicates a comment line in the code, and that line is colored green in the script and is descriptive of the code following the comment. It is ignored for the purposes of calculating the indicator.
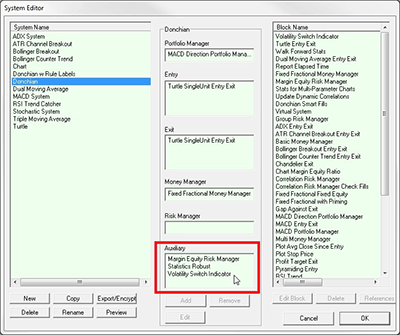
This new block may be dropped into the auxiliary section of any Trading Blox system to calculate and plot the volatility switch indicator for each market in the system’s portfolio.
FIGURE 15: TRADING BLOX. Here is a plot of the indicator.
TradingBlox Script:
' If the denominator is not zero, calculate the "daily change".
' It is defined as the difference between the current and previous close
' divided by the average of the current and previous close.
IF (instrument.close + instrument.close[1])/2 != 0 THEN
 	dailyChange = (instrument.close - instrument.close[1]) / ((instrument.close + instrument.close[1])/2)
ENDIF

' "Historical volatility" is the standard deviation of the daily change over the lookback period
historicalVolatility = standardDeviation( dailyChange, volatilitySwitchLookback)

' Count the number of historical volatility readings within the lookback period
' that are greater than or equal to the current value of historical volatility.
volCount = 0
FOR index = 0 TO (volatilitySwitchLookback-1) STEP 1
	if historicalVolatility >= historicalVolatility[index] then volCount = volCount + 1
NEXT

' Divide the number of higher volatility bars by the total number of lookback bars.
' This is the volatility switch indicator.
volatilitySwitchIndicator = volCount / volatilitySwitchLookback

'Plot volatility switch values above .5 in red and the rest in green on the trade chart.
if volatilitySwitchIndicator > .5 then
	' Set the indicator to plot a red (RGB color 255) histogram (chart type 8).
	SetSeriesColorStyle( volatilitySwitchIndicator, 255, 8 )
else
	' Set the indicator to plot a green (RGB color 65280) histogram (chart type 8).
	SetSeriesColorStyle( volatilitySwitchIndicator, 65280, 8 )
endif
—Jake Carriker
for Trading Blox
www.TradingBlox.com
BACK TO LIST
Originally published in the February 2013 issue of
Technical Analysis of Stocks & Commodities magazine.
All rights reserved. © Copyright 2013, Technical Analysis, Inc.
Return to
Contents