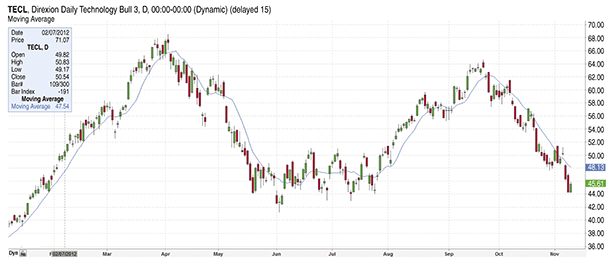
FIGURE 1: DIREXION DAILY TECHNOLOGY BULL 3X SHARES (TECL). Here you see the daily chart of TECL with the 10-day moving average. Note areas where the trend clearly changes.
TRADING TICKET
How do you know what direction the market is taking and where to invest with prevailing trends? How can you recognize a new trend developing? Starting in 2009 until recently, several exchange traded funds (ETFs) have gained the attention of the market since they have been showing prevailing trends.
ETFs are made up of a fund of individual stocks that trade like a single stock. Because they are made up of many stocks — for example, 500 stocks in the case of the Standard & Poor’s 500 — they are diverse and have low or moderate volatility. A single action like a CEO mismanaging assets does not have the same impact on ETFs as it does on that specific stock and its resulting value from the CEO’s poor choices. I chose to track 10 pairs of ETFs, with each pair having an inverse ETF or an opportunity to make money when the stock market pulls back.
BOTH SIDES OF THE COIN
During pullbacks and trend reversals, the key is to look at pairs of ETFs — upside and downside ETFs. The real power comes from knowing when to enter the market, exit the market, reenter the market, and go to or stay in cash.
Trends begin to emerge or typically start from patterns in certain sectors or areas of the market where you see continued growth and opportunity over a period of time. The trend can continue for a few weeks, months, or even years. Being able to focus on trends and recognize the patterns takes close personal scrutiny, a loyal advisor, or the use of a trend-following tool.

FIGURE 1: DIREXION DAILY TECHNOLOGY BULL 3X SHARES (TECL). Here you see the daily chart of TECL with the 10-day moving average. Note areas where the trend clearly changes.