CHART PATTERNS
Eavesdropping The Bear
The Cat’s Ears Pattern
by Giorgos E. Siligardos, PhD
Here’s a rare but reliable bearish formation: the cat’s ears. A visual hybrid of double-top and failed-cup formations, the cat’s ears formation occurs during downtrends, predicting further price decline with a price target.
Many technical analysts believe the most profitable patterns are the continuation ones. This is because the market has already established a trend and the odds favor its continuation after a short pause. Flags, pennants, rectangles, wedges, and head & shoulders are the widely known bearish continuation patterns. Some time ago, I discovered one more continuation pattern that occurs during downtrends, which I named “cat’s ears” (CE) due to its distinctive appearance. The CE is rare but reliable and offers a well-defined price target.
The model
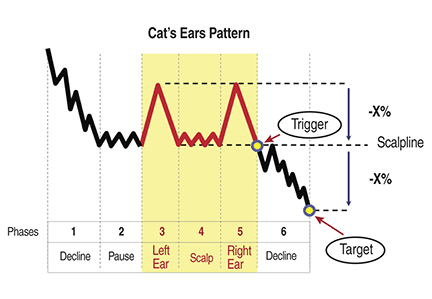
In Figure 1 you can see the textbook model of the CE pattern. The CE takes place in the middle of a six-phase context:
- Phase 1: The price is in a severe downtrend
- Phase 2: The price pauses for a while and oscillates
- Phase 3: The price bumps up then quickly recedes, creating the “cat’s left ear”
- Phase 4: The price oscillates again, creating the “scalp of the cat”
- Phase 5: The price makes a second bump up but again recedes, creating the “cat’s right ear”
- Phase 6: The price breaks the “scalp line” (the support line defined by the lows in the cat’s scalp) and resumes its previous downtrend.

FIGURE 1: THE TYPICAL CAT’S EARS PATTERN. The typical cat’s ears pattern takes place in a context of six phases. The price declines (phase 1), pauses for a while (phase 2), bumps up abruptly, and quickly falls back, creating the cat’s left ear (phase 3). In the sequence, it oscillates in a relatively narrow range, giving shape to the cat’s scalp (phase 4) and again bumps up and recedes, creating the cat’s right ear (phase 5). As soon as the price breaks the support line defined by the cat’s scalp (scalp line), it falls further down.
Usual variants
Figure 2 summarizes the usual variants of the pattern. The left and right ears may not be exactly the same height and the scalp line may be slightly above or below the low level of phase 2. While the cat’s ears usually develops in a context of six phases, there are cases where the second phase is absent. There are also cases where phase 2 is long and volatile, so the price appears as if it forms a bottom, but the emergence of the cat’s ears pattern is the last attempt of the price to recover before it dips again.
All these variations in the context of the pattern or the pattern itself do not alter its bearish implications.
Excerpted from an article originally published in the December 2012 issue of Technical Analysis of Stocks & Commodities magazine. All rights reserved. © Copyright 2012, Technical Analysis, Inc.
Return to Contents
