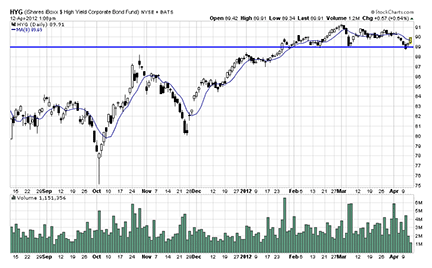
FIGURE 1: DAILY CHART OF HYG (AUGUST 2011–APRIL 2012). Here you see price movement of HYG with respect to its support level. Are high-yield bond funds getting toppy?
TRADING TICKET
According to the March 11, 2012, Financial Times article “Warning On High-Yield ETF Returns,” high-yield exchange traded funds (ETFs), which mostly consist of junk bonds, have seen net inflows of $6.6 billion so far (and at that time, we were not even done with the first quarter). Total net inflows into high-yield ETFs in all of 2011 was $8.4 billion. Is it an indication that investors are willing to take higher risks? Or are they attracted to them because their yields are much better than short-term interest rates?
Junk bonds typically carry a high risk, given that they are bonds that carry a credit rating below BBB (Standard & Poor’s) or Baa3 (Moody’s). The main risk concern with high-yield bonds is the increased likelihood of the companies defaulting on their loans. But besides that, you need to be mindful of how closely the ETF tracks its benchmark index (tracking error).
It is well known that ETFs tend to underperform their benchmark indexes, but you’ll find that high-yield bond ETFs underperform their benchmark indexes even more than other ETFs. The reason behind this is the high turnover and high transaction costs. In addition, the pricing in the junk bond market is not transparent, making the bid/ask spread relatively wide.
It would be to your benefit to keep an eye on the correlation between the equity markets and the high-yield bond market. Typically, bonds and equities are negatively correlated, but studies have shown that when high-yield bonds start to become highly correlated with equities, there is reason to be cautious.
High-yield ETFs may seem like an attractive option in times of super-low short-term interest rates. However, they do carry a high amount of risk. “[That is because] junk bonds are issued by relatively shaky companies. Investors, therefore, demand a higher yield because the risk of default is higher, and hence the higher return,” said Arthur Hill, CMT, of StockCharts.com.
Let’s take a further look at the ETFs mentioned in the article in this issue by Brooke Gardner, “Trading High-Yield Bonds Using ETFs.”
FIGURE 1: DAILY CHART OF HYG (AUGUST 2011–APRIL 2012). Here you see price movement of HYG with respect to its support level. Are high-yield bond funds getting toppy?