CHARTING
On The Way To Profits
Riding The Velocity Express
by Martha Stokes, CMT
Understanding the difference between momentum, velocity, and volatility in price and volume patterns will improve trading results for swing traders. Here’s an in-depth look.
Analyzing price action starts with an examination of the market condition. There are six primary market conditions in today’s stock market. Within each of these market conditions are various trading conditions. Swing traders must be aware of the trading conditions so they can find stocks to trade that are going to move with momentum of velocity action or avoid volatility action. Let’s look at the difference among momentum, velocity, and volatility price actions.
Momentum
Momentum is the price action that most swing traders use. A momentum run is an abrupt move up with inconsistent energy and frequent resting day candles and/or consolidations within the run. A resting day candle is a candle that forms at or near the high of the previous day and is a continuation candle pattern indicating continued upward or downward action. Momentum moves can last longer than a velocity run because the angle of ascent is mitigated by the resting or brief consolidations that form during the duration of the run.
To trade a momentum run successfully, swing traders need to understand the price to volume relationships that form during a momentum run (Figure 1).
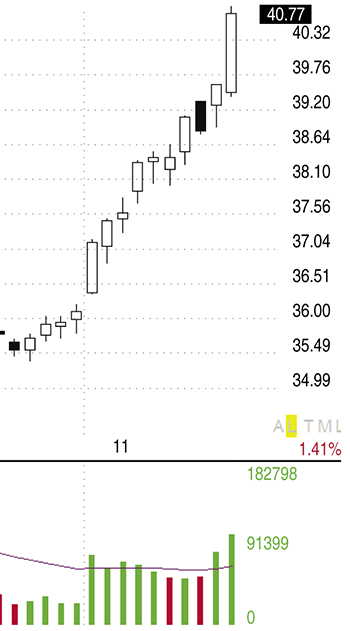
FIGURE 1: MOMENTUM RUN. Momentum runs occur during moderately trending, platform, and trading range market conditions. They are characterized by inconsistent volume patterns and frequent pauses in the price moves, which create the resting day or brief consolidation patterns within the run.
Momentum runs occur during moderately trending and trading range market conditions. They are characterized by inconsistent volume patterns and frequent pauses in price movement, which create the resting day or brief consolidation patterns within the run.
Excerpted from an article originally published in the May
2012 issue of Technical Analysis of Stocks & Commodities magazine. All rights reserved. © Copyright 2012, Technical Analysis, Inc.
Return to Contents