CHARTING
Would It Work For You?
Spotting Momentum Reversals And Deriving Price Forecasts
Spotting a reversal in the current momentum of the market and forecasting its price movement is every trader’s objective. Here’s a look at the X-sequentials X7 pattern, a technique that has been applied to the Dax futures, Nasdaq 5 100, and mini-crude oil contracts.
Daily financial market transactions based on news, fundamental data, and emotional decisions are reflected in prices as momentum. Momentum has direction and magnitude and can be seen on a chart in the form of uptrends, downtrends, countermoves, and trading ranges. The nice thing is that when you can identify a reversal in the current momentum of the market, there is a method with which you can derive price forecasts. Here’s how you can spot a reversal in the current momentum of the market and derive a forecast by applying the X-sequentials X7 pattern, forecasts based upon measured momentum reversals.
The X-sequentials X7 pattern
To apply the X-sequentials analysis, you need to use a bar chart with swing lows and swing highs identified. These swing highs and lows will enable you to draw the two lines necessary to apply the X7 pattern. These two lines are the base line and price line.
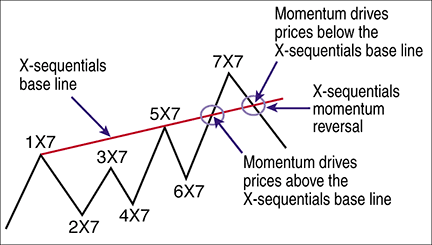
To locate an X-sequentials X7 pattern, first you have to sum up seven market moves. This will allow you to draw the base line. The base line is mandatory to locate the primary characteristic of this pattern: the momentum reversal. The diagram in Figure 1 describes the principle of a bearish X-sequentials momentum reversal.

Figure 1: bearish x-sequentials momentum reversal. First, find two highs with a lower high in between. You can draw the base line by connecting the two highs and extending to the right. The break of the base line downward indicates a momentum reversal and completes the X7 pattern.
Bearish X-sequentials momentum reversal
Since an X-sequentials X7 pattern consists of seven market swings, you need to search for two highs with a lower high in between on your chart. You can then draw the X-sequentials base line by connecting the two highs and extending it to the right side of the chart. The first high is marked as “1X7” and the second high as “5X7.” The lower high is termed as “3X7.” The low, “4X7,” can be higher or lower than the low “2X7.” After the “6X7” downleg, the market’s momentum must drive prices above the base line.