TRADING SYSTEMS
About Fibonacci And Lucas
Automated Techniques For Intraday Traders 
Find out how you can automate several time-based techniques to apply to intraday charts. In the first part of this series, we discuss the Fibonacci bar-counting technique and the Lucas number series.
It’s fair to say that technical analysis has made its biggest strides in relation to price-based forecasting rather than time-based studies. Moreover, when time-based techniques are developed, they are applied to higher time frame charts. The result is that the intraday trading context has seen little exposure to time-based forecasting techniques comparable to higher time frame approaches such as the delta system, the spiral calendar, and Ermanometry.
Beyond this, a major problem in applying time-based techniques intraday is that unless they can be automated, their application demands a great deal from a trader. With a variety of screens and indicators, a daytrader’s attention is more than occupied: the last thing he needs are calculations running through his head. For higher time frames, which are forgiving of a more leisurely pace, these issues are not a concern.
In these articles, I want to do two things: first, to automate several time-based techniques so that they can be applied to intraday charts; and second, to assess their effectiveness intraday in relation to price-based technical analysis. Time-based techniques to be considered this time include the Fibonacci bar-counting technique and the Lucas number series.
Fibonacci bar counting
The Fibonacci bar-counting technique is based on the Fibonacci number series. The numbers in the sequence are derived from the seed values zero and 1 and from the formula Fn+1 = Fn-1 + Fn. As the sequence progresses, the ratio of a number to the one before it gets closer and closer to the golden ratio, which is 1.618. Here I’ve programmed the sequence inclusive of 5, 8, 13, 21, 34, 55, 89, 144, 233, 377, 610, 987, 1597, 2584, 4181, and 6765. The bar-counting technique that derives from this sequence is well-established on higher time frame charts, especially in Elliott wave circles.
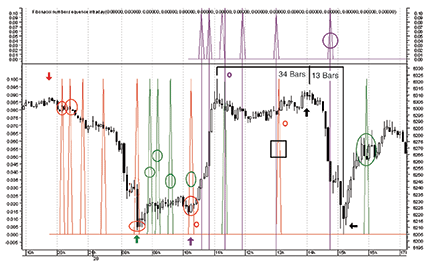
Figure 1: 5m chart of Xetra DAX December 2010 futures. The needle-like projections are created when a true condition is met — that is, a bar is reached that corresponds to a number in the Fibonacci sequence.