CANDLESTICK CORNER
They’re The Trendiest
Top 10 Candles That Work
Which candlestick patterns trend the most in 10 days?
In my last article, I described 13 candlesticks that worked best as reversal or continuation patterns. That means price closed above the top of the candle pattern or below the bottom of it, signaling a reversal or continuation not just once, but reliably in thousands of cases. However, just because a candle acts as a reversal 66% of the time doesn’t mean that price moves far beyond the candlestick boundaries.
This article discusses candles that perform best over time — that trend furthest — but they may not be good reversal or continuation candidates.
Start at the beginning
Doing research on candlesticks means making decisions on how to test them. How do you determine the best performance? Since candles are often short-duration patterns (most are three price bars or shorter), their trend often does not lead to a big, long-duration move. I would make that statement based on working with chart patterns, where the tallest ones outperform their shorter brethren, but also from testing more than 100 candlestick types using daily price data and 4.7 million lines (a candle line is a single price bar).
I decided to measure the price move from the close of the day the candle pattern ended (not the breakout) to one, three, five, and 10 trading days into the future. This article discusses the 10-day performance results in a bull market. For details on other varieties, such as bear market performance over five days, please refer to my book Encyclopedia Of Candlestick Charts.
Up breakouts: Collapsing doji star
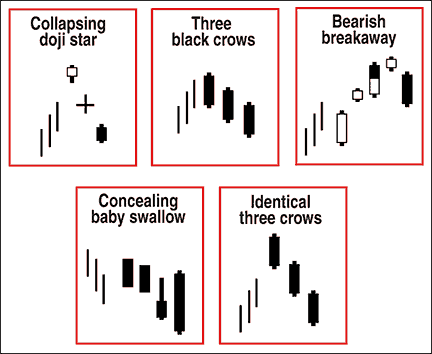
The top-performing candle with an upward breakout is the collapsing doji star. I show the ideal configuration in Figure 1. It’s a three-line pattern with an uptrend leading to the start of the candlestick. The first line is white, but it can be tall or short. What matters is that it gaps above the next candle — a doji.

Figure 1: Up breakouts. Here you see the top-performing candlesticks with upward breakouts.