INDICATORS
Trending Or Nontrending?
In The Volume Zone 
Here’s a look at the volume zone oscillator, which can be applied to trending and nontrending markets. Find out how it can be used to trade the Djia, Spy, and gold.
An axiom of technical analysis states that with few exceptions, all technical indicators can be classified as either trending or oscillating (nontrending) in their design. This new indicator, the volume zone oscillator (Vzo), addresses both.
In his book Technical Analysis Of The Financial Markets, John J. Murphy explains that using oscillators provides three benefits:
- Overbought and oversold conditions warn that price trend is overextended and vulnerable.
- Divergence between oscillator and price action shows hidden strength or weakness in the market, which is not apparent in the price action.
- The crossing of the zero line can give an important trading signal.
The formula depends on only one condition: If today’s closing price is higher than yesterday’s, then the volume will have a positive value (bullish). Otherwise, it will have a negative value (bearish). So:
Volume zone oscillator = 100 x (VP/TV)
where:
VP (Volume position) = X-days Ema (± volume)
and
TV (Total volume) = X-days Ema (volume)
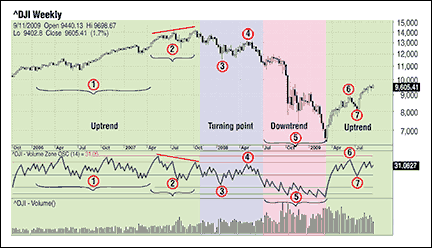
The volume zone oscillator
Volume is simply the number of shares or contracts that have been traded throughout the day, so the higher the volume, the more active the security. Volume is always treated as a secondary indicator, despite its importance in confirming trends and chart patterns.
Volume analysis is a key component of analyzing and predicting the future direction of an asset. Joe Granville introduced the on-balance volume (Obv) indicator in his Granville’s New Key To Stock Market Profits. This was one of the first and most popular indicators to measure positive and negative volume flow. The concept behind Obv is that volume precedes price. Obv adds a period’s volume when the close is up and subtracts the period’s volume when the close is down.

Figure 1: the volume zone oscillator (vzo). On this weekly chart of the DJIA you see all the components of the VZO: the 60-period EMA, 14-period ADX, and the seven oscillator zones.