Letters To The Editor
November 2010 Letters To The Editor
The editors of S&C invite readers to submit their opinions and information on subjects relating to technical analysis and this magazine. This column is our means of communication with our readers. Is there something you would like to know more (or less) about? Tell us about it. Without a source of new ideas and subjects coming from our readers, this magazine would not exist.
Address your correspondence to: Editor, Stocks & Commodities, 4757 California Ave. SW, Seattle, WA 98116-4499, or E-mail to editor@traders.com. All letters become the property of Technical Analysis, Inc. Letter-writers must include their full name and address for verification. Letters may be edited for length or clarity. The opinions expressed in this column do not necessarily represent those of the magazine. —Editor
GANN AND THE TIME FACTOR
 Editor,
I am writing from Mumbai, India, and am a subscriber to S&C magazine. I trade index futures, options, and equities. I have been following the technicals for three years and am a keen student of them.
I liked Koos van der Merwe’s article in the August 2010 S&C, “Gann And The Time Factor,” and the way he highlights the importance of the x-axis on a chart (which is mostly overlooked by analysts all over). Most of the studies I have found are on the y-axis (price).
I personally follow Elliott wave analysis along with time (that is, number of bars) taken to form a particular wave in any degree. I compare it to the previous wave of the same degree and I examine its Fibonacci relationship while confirming the time taken. I have read some books on Gann and have tried to implement the technique using our Nifty index.
I also liked van der Merwe’s previous articles on Elliott wave analysis published in earlier issues of S&C.
The Gann squares I applied to our index have worked well and have shown good results on daily charts using an important low or high. I look forward to more articles of this sort from van der Merwe in S&C. I would also like to know generally if we should apply the Gann box on a weekly chart from a particular important pivot low or high. How would that be helpful while analyzing the same chart in a lower time frame — that is, daily or hourly?
—Nilesh
Koos van der Merwe replies:
Thank you for your kind words.
I have used the Gann fan as a time factor on weekly charts and even monthly charts with success, always from a major low or high. Of course, one must allow a margin of error with the dates suggested by the Gann fan, but they do give an idea of what to expect. Elliott wave analysis can act as a confirmatory signal in this case; by this I mean identify the wave you are currently in, and consider what the wave could be in the future as suggested by the Gann fan.
I must admit I have never tried a time analysis using the fan on an intraday (minute or hourly) chart.
All the best in your trading.
GANN FANS
 Editor,
Great article in the July 2010 S&C by Koos van der Merwe (“Projecting Price And Time With Gann Fans And Angles”).
I use the Wyckoff method in my trading. I look for climactic events in the market using price, volume, supply & demand, as well as trend. I also use Andrews pitchfork, and I came across the Gann fan by accident. I am having problems identifying trend. I would like to see how I can incorporate the Gann fan in my chart studies. How does the author read the meaning of the lines on the chart?
—Franklin
Koos van der Merwe replies:
I use the Gann fan purely to determine time — that is, when a turning point could occur. I use the word “could” because it need not happen on that date, but it does give me an idea of what to expect. So calculate your Gann square, and then draw your Gann fan from a low or high point, as shown in Figure 4 of my article in the August 2010 issue of S&C, “Gann And The Time Factor”:
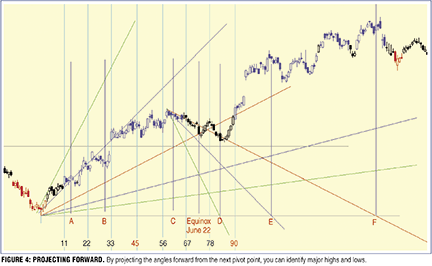
Note that the fan lines must cross the horizontal line drawn from the pivot point where you have drawn the previous fan. Where they cross gives you the dates when you can expect future turning points — trend changes in the share you are watching. I have shown this at points D, E, and F in the chart.
For market direction, I use Elliott wave analysis. I don’t use the Andrews pitchfork or Wyckoff method, even though both are effective. I simply prefer Elliott wave.
Volume can play an important part in trading. Joe Granville showed this in the 1980s, and I watch volume closely. But with today’s computers, one can develop strategies that are earlier at determining a trend. Then, of course, you must decide whether you are a trader or an investor, and find a strategy that suits your personality.
After years of trading and profitability, I still enjoy looking for and testing new strategies with the many programs available today. Somehow, I always return to Elliott wave and Gann, plus a strategy I call the JM internal band strategy for long-term investing.
COMPUTER-DRAWN ELLIOTT WAVE COUNTS?
 Editor,
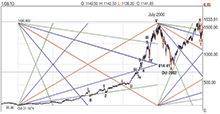
I am reading Koos van der Merwe’s article in July 2010 S&C (“Projecting Price And Time With Gann Fans And Angles”) and see he has noted Elliott wave degrees on his charts on pages 30 and 32. Does he have software that automatically draws the degrees of waves for the user? If so, what service does he use?
—Micki
Koos van der Merwe replies:
I use Advanced Get to draw and label charts, simply because it is easy to use. The program does supply Elliott waves, but I rarely look at those labels — I prefer to do my own counts by looking at the charts. My rules for working with charts are:
- The chart must look simple. Too many people make them complicated and get lost in where they want the market to go, rather than let the chart talk to them.
- Never become fixated on a count. Elliott wave is simply a signpost, and just down the road is another signpost, with a different count and direction. Always keep an open mind.
My counts at the moment are very much influenced by the monthly wave count of the S&P 500 index, which tells me that the market is in a Wave II of a new bull market. The problem is that Wave IIs can be a 70% retracement in an abc pattern, so I am looking for opportunities to buy stocks for a long-term hold. You can see my counts in Figures 1a and 1b, which are monthly and daily charts of the S&P 500 index.
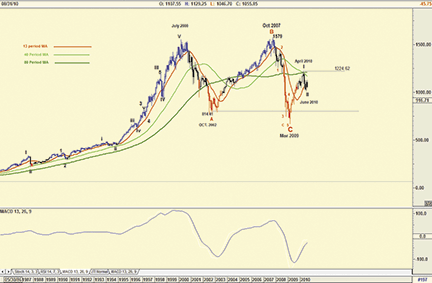
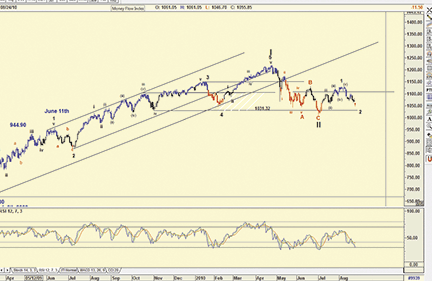
FIGURE 1A AND 1B: S&P 500 MONTHLY (TOP) AND S&P 500 DAILY (BOTTOM) WITH ELLIOTT WAVE COUNTS. These charts submitted by author Koos van der Merwe shows his Elliott wave counts.
ERRATA: SEPTEMBER 2010 METASTOCK TRADERS’ TIP
 Editor,
The following is a correction to the MetaStock code that appeared in the September 2010 Traders’ Tips section of S&C.
The formula we originally provided was:
THE CLEAR METHOD
If(Cum(1)=11, If(H>Ref(H,-1), H, L),
If(PREV>=Ref(H,-1) AND ROC(H,1,$)>0, Max(H,PREV),
If(PREV<=Ref(L,-1) AND ROC(L,1,$)<0, Min(L,PREV),
If(PREV>=Ref(H,-1) AND H<=HHV(L,10), L,
If(PREV<=Ref(L,-1) AND L>=LLV(H,10), H, PREV)))))
It should have read:
upswa:= If(Cum(1)=11, If(H>Ref(H,-1), H, L),
If(PREV>=Ref(H,-1) AND ROC(H,1,$)>0, Max(H,PREV),
If(PREV<=Ref(L,-1) AND ROC(L,1,$)<0, Min(L,PREV),
If(PREV>=Ref(H,-1) AND H<=HHV(L,10), L,
If(PREV<=Ref(L,-1) AND L>=LLV(H,10), H, PREV)))));
upsw:= If(upswa=H, 1, If(upswa=L, 0, PREV));
If(upsw=1, HHV(L,10),LLV(H,10))
Note there is a slight change in the first line of the above code and two new lines at the bottom of the code block.
—William Golson
MetaStock Technical Support
Thomson Reuters
www.equis.com/customer/support