FOREX FOCUS
Gold And The New Technical Triad
Forecast gold prices by combining Elliott wave, Fibonacci, and candlesticks.
Most market analysts will agree that supply and demand economics are a major influence on the current price of a commodity. It is, however, market sentiment that determines the perceived future price. If you can understand and quantify market psychology or market sentiment, you can more effectively forecast price. This has been the underlying assumption of Elliott wave and Fibonacci retracement theories.
Elliott, Fibonacci, and candlesticks
To the market technician, Elliott wave and Fibonacci retracement theories go together like peas and carrots. Elliott wave incorporates many aspects of the Fibonacci sequence and retracement theory. It uses different retracement levels as benchmarks that certain waves should use. When R.N. Elliott devised his wave concept, he was not familiar with Fibonacci theory and only made this correlation later on.
Then there’s a third ingredient that could be added to the mix: candlestick patterns. Adding this technique in combination with both wave and retracement theories can deliver greater market insight.
These techniques are all based on the assumption that market behavior is based upon the laws of nature and market psychology. These natural cycles can be identified and quantified to use in market forecasting. All three techniques, although different, have identified a specific and mathematically definable set of rules and guidelines.
Elliott wave, Fibonacci retracement, and candlesticks are all descriptions of how markets might perform. They are all able to define market sentiment or psychology in mathematical terms. By combining these three techniques, the synergistic effect is a more reliable and effective process for price forecasting.
As of this writing, gold is trading at $1,230, which at this time is a record high. The price of gold has moved in a predictable manner, if you know the right roadmaps to follow. Let’s apply the Elliott wave count.
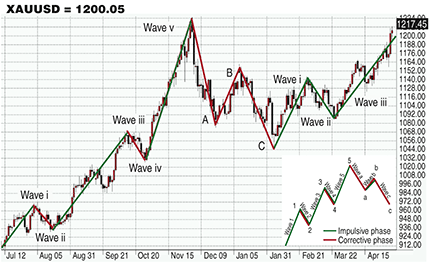
Figure 1: daily us/uax (Forex gold) candlestick chart with elliott wave count. The motive phase drove gold to a new historical high of $1,221 in December 2009. The corrective phase in forex gold lasted from December 2009 to February 2010.