TRADING TECHNIQUES
Simple But Good
Short-Term Gap Trading
Using one of the most widely recognized market events, this simple technique provides a useful framework for any trader looking to develop a short-term method.
Every trader looks for an edge in the markets. Sometimes that edge might involve a complex set of mathematical calculations, while at other times it might involve a gut feel for a situation that the trader has experienced before. For others still, it might involve:
- A simple technique that is
- Combined with the recognition that the technique will not always be correct, and
- Understanding that risk controls and money management methods must be included in order to
- Maximize profits when things go as planned and
- Cut losses when they do not.
To illustrate this concept, let’s talk about one such technique using one of the simplest market events, commonly known as the gap.
The simple gap
For our purposes, an “up” gap day occurs when the low of one day for a given security is above the high price established during the previous trading day, while a “down” gap day occurs when the high of one day for a given security is below the low price established during the previous trading day.
A day is deemed a “gap day” if today’s high to low price range does not intersect with yesterday’s high to low range. So if a security gaps higher to a price that is above yesterday’s high but falls back below the previous day’s high, it does not meet our definition.
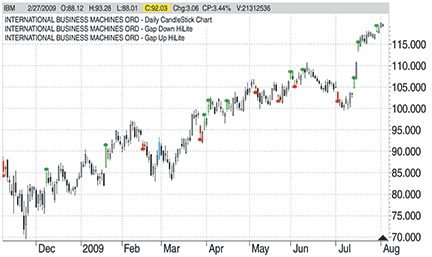
Figure 1 displays a candlestick chart for Ibm. On the chart, you will note a number of such gap days. Up gaps are highlighted with green dots, while down gaps are highlighted with red dots. The days marked in green and red have no intersection with the previous day’s price range.

Figure 1: gap days. Note the number of gap days on the chart. Up gaps are highlighted with green dots, while down gaps are highlighted with red dots. Note that the days marked in green and red have no intersection with the previous day’s price range.