TRADERS’ TIPS
May 2010
Here is this month’s selection of Traders’ Tips, contributed by various developers of technical analysis software to help readers more easily implement some of the strategies presented in this and other issues.
Other code appearing in articles in this issue is posted in the Subscriber Area of our website at https://technical.traders.com/sub/sublogin.asp. Login requires your last name and subscription number (from mailing label). Once logged in, scroll down to beneath the “Optimized trading systems” area until you see “Code from articles.” From there, code can be copied and pasted into the appropriate technical analysis program so that no retyping of code is required for subscribers.
You can copy these formulas and programs for easy use in your spreadsheet or analysis software. Simply “select” the desired text by highlighting as you would in any word processing program, then use your standard key command for copy or choose “copy” from the browser menu. The copied text can then be “pasted” into any open spreadsheet or other software by selecting an insertion point and executing a paste command. By toggling back and forth between an application window and the open web page, data can be transferred with ease.
This month’s tips include formulas and programs for:
- TRADESTATION: SVE_BB%b INDICATOR
- eSIGNAL: SVE_BB%b INDICATOR
- WEALTH-LAB: SVE_BB%b INDICATOR
- AMIBROKER: SVE_BB%b INDICATOR
- WORDEN BROTHERS STOCKFINDER: SVE_BB%b INDICATOR
- NEUROSHELL TRADER: SVE_BB%b INDICATOR
- AIQ: SVE_BB%b INDICATOR
- TRADERSSTUDIO: SVE_BB%b INDICATOR
- STRATASEARCH: SVE_BB%b INDICATOR
- TRADINGSOLUTIONS: SVE_BB%b INDICATOR
- NINJATRADER: SVE_BB%b INDICATOR
- TRADECISION: SVE_BB%b INDICATOR
- NEOTICKER: SVE_BB%b INDICATOR
- WAVE59: SVE_BB%b INDICATOR
- TRADE NAVIGATOR: SVE_BB%b INDICATOR
- UPDATA: SVE_BB%b INDICATOR
- CHARTSY: SVE_BB%b INDICATOR
- TRADING BLOX: SVE_BB%b INDICATOR
- VT TRADER: SVE_BB%b INDICATOR
- METASTOCK: SVE_BB%b INDICATOR — VERVOORT ARTICLE CODE
![]() TRADESTATION: SVE_BB%b INDICATOR
TRADESTATION: SVE_BB%b INDICATOR
Sylvain Vervoort’s article in this issue, “Smoothing The Bollinger %b,” reviews John Bollinger’s band calculations and then suggests some modifications of them. Vervoort finds the raw calculation of “%b” too choppy, so he proposes algorithms to smooth it while minimizing the introduction of delay. These algorithms are implemented in the EasyLanguage code provided here.
The original (choppy) calculation of %b is provided in the indicator BB%b. The smoothed %b calculation is provided in the indicator Sve_BB%b. In addition, bands can be plotted around prices on a price chart using the indicator Sve_BB.
To download the adapted EasyLanguage code, go to the TradeStation and EasyLanguage support forum (https://www.tradestation.com/Discussions/forum.aspx?Forum_ID=213). Search for the file “Sve_BB%b.eld.”
A sample chart is shown in Figure 1.
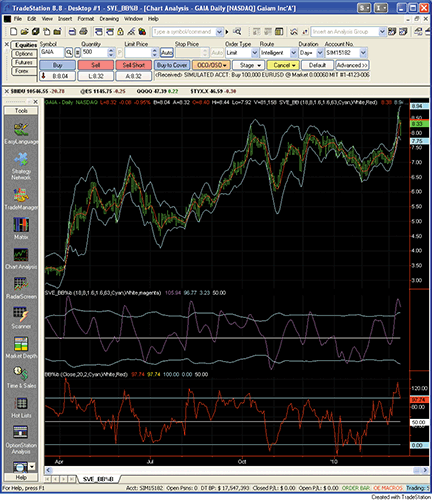
Figure 1: TRADESTATION, Sve_BB%b indicator. Here is an example of Sylvain Vervoort’s SVE_BB%b indicator plotted on a daily chart of Gaiam Inc. (GAIA). The top pane displays price movement within Vervoort’s smoothed Bollinger bands. The second pane displays the SVE_BB%b calculations. The magenta line displays the SVE_BB%b (smoothed BB%b). The Bollinger bands of the SVE_BB%b are cyan. In the bottom pane, the raw BB%b calculation is displayed in red.
Function:  TEMA
inputs:
	Price( numericseries ),
	Length( numericsimple ) ;

variables:
	XMA( 0 ),
	XMA2( 0 ),
	XMA3( 0 ) ;

XMA = XAverage( Price, Length ) ;
XMA2 = XAverage( XMA, Length ) ;
XMA3 = XAverage( XMA2, Length ) ;

if CurrentBar > 2 then
	TEMA = 3 * XMA - 3 * XMA2 + XMA3 ;

Indicator:  BB%b
inputs:
	Price( Close ),
	Period( 18 ),
	Deviations( 2 ),
	BandColor( Cyan ),
	SignalLineColor( Red ),
	MidPointColor( White ) ;

variables:
	MidLine( 0 ),
	BandOffset( 0 ),
	UpperBand( 0 ),
	LowerBand( 0 ),
	PerB( 0 ) ;

MidLine = Average( Price, Period ) ;
BandOffset = Deviations * StandardDev( Price, Period, 1 ) ;
UpperBand = MidLine + BandOffset ;
LowerBand = MidLine - BandOffset ;

if UpperBand <> LowerBand then
	PerB = 100 * ( Price - LowerBand ) / ( UpperBand -
	 LowerBand ) ;

Plot1( PerB, "%b" ) ;
Plot2( 100, "100", BandColor ) ;
Plot3( 0, "0", BandColor ) ;
Plot4( 50, "50", MidPointColor ) ;

Indicator:  SVE_BB%b
inputs:
	TEMA_Period( 8 ),
	Period( 18 ),
	UpperBandDev( 1.6 ),
	LowerBandDev( 1.6 ),
	StandardDevPeriod( 63 ),
	BandColor( Cyan ),
	SignalLineColor( Magenta ),
	MidPointColor( White ) ;

variables:
	OkToPlot( false ),
	haOpen( 0 ),
	haC( 0 ),
	TMA1( 0 ),
	TMA2( 0 ),
	Diff( 0 ),
	Z1HA( 0 ),
	TMAZ1HA( 0 ),
	SD_TMAZ1HA( 0 ),
	SVEPerB( 0 ),
	SDPerB( 0 ),
	PerBUpperBand( 0 ),
	PerBLowerBand( 0 ) ;

Once( CurrentBar > StandardDevPeriod )
	OkToPlot = true	;

haOpen = 0.5 * ( AvgPrice + haOpen[1] ) ;
haC = 0.25 * ( AvgPrice + haOpen + MaxList( High,
 haOpen ) + Minlist( Low, haOpen ) ) ;
TMA1 = TEMA( haC, TEMA_Period ) ;
TMA2 = TEMA( TMA1, TEMA_Period ) ;
Diff = TMA1 - TMA2 ;
Z1HA = TMA1 + Diff ;
TMAZ1HA = TEMA( Z1HA, TEMA_Period ) ;
SD_TMAZ1HA = StandardDev( TMAZ1HA, Period, 1 ) ;

if SD_TMAZ1HA <> 0 then
	SVEPerB = 25 * ( TMAZ1HA + 2 * SD_TMAZ1HA -
	 WAverage( TMAZ1HA, Period ) ) / SD_TMAZ1HA ;

SDPerB = StandardDev( SVEPerB, StandardDevPeriod, 1 ) ;

PerBUpperBand = 50 + UpperBandDev * SDPerB ;
PerBLowerBand = 50 - LowerBandDev * SDPerB ;

if OkToPlot then
	begin
	Plot1( SVEPerB, "SVE_%b", SignalLineColor ) ;
	Plot2( PerBUpperBand, "PerBUpBand", BandColor ) ;
	Plot3( PerBLowerBand, "LowerBand", BandColor ) ;
	Plot4( 50, "MidPoint", MidPointColor ) ;
	end ;

Indicator:  SVE_BB
inputs:
	TEMA_Period( 8 ),
	Period( 18 ),
	UpperBandDev( 1.6 ),
	LowerBandDev( 1.6 ),
	BandColor( Cyan ) ;

variables:
	OkToPlot( false ),
	haOpen( 0 ),
	haC( 0 ),
	TMA1( 0 ),
	TMA2( 0 ),
	Diff( 0 ),
	Z1HA( 0 ),
	TMAZ1HA( 0 ),
	SD_TMAZ1HA( 0 ),
	UpperBand( 0 ),
	LowerBand( 0 ) ;

Once( CurrentBar > Period + TEMA_Period )
	OkToPlot = true ;

haOpen = 0.5 * ( AvgPrice + haOpen[1] ) ;
haC = 0.25 * ( AvgPrice + haOpen + MaxList( High,
 haOpen ) + Minlist( Low, haOpen ) ) ;
TMA1 = TEMA( haC, TEMA_Period ) ;
TMA2 = TEMA( TMA1, TEMA_Period ) ;
Diff = TMA1 - TMA2 ;
Z1HA = TMA1 + Diff ;
TMAZ1HA = TEMA( Z1HA, TEMA_Period ) ;
SD_TMAZ1HA = StandardDev( TMAZ1HA, Period, 1 ) ;
UpperBand = Z1HA + UpperBandDev * SD_TMAZ1HA ;
LowerBand = Z1HA - LowerBandDev * SD_TMAZ1HA ;

if OkToPlot then
	begin
	Plot1( TMAZ1HA, "TMAZ1HA" ) ;
	Plot2( UpperBand, "UpperBand", BandColor ) ;
	Plot3( LowerBand, "LowerBand", BandColor ) ;
	end ;
This article is for informational purposes. No type of trading or investment recommendation, advice, or strategy is being made, given, or in any manner provided by TradeStation Securities or its affiliates.
![]() eSIGNAL: SVE_BB%b INDICATOR
eSIGNAL: SVE_BB%b INDICATOR
For this month’s Traders’ Tip, we’ve provided the formula “SmoothBollingerB.efs” based on the formula code from Sylvain Vervoort’s article in this issue, “Smoothing The Bollinger %b.”
The study contains the formula parameters %b period, Tema average length, standard deviation high, standard deviation low, and standard deviation period, which may be configured through the Edit Studies window (Advanced Chart menu → Edit Studies).
To discuss this study or download complete copies of the formula code, please visit the Efs Library Discussion Board forum under the Forums link at www.esignalcentral.com or visit our Efs KnowledgeBase at www.esignalcentral.com/support/kb/efs/. The eSignal formula scripts (Efs) are also available for copying and pasting from the Stocks & Commodities website at Traders.com.
A sample chart is shown in Figure 2.
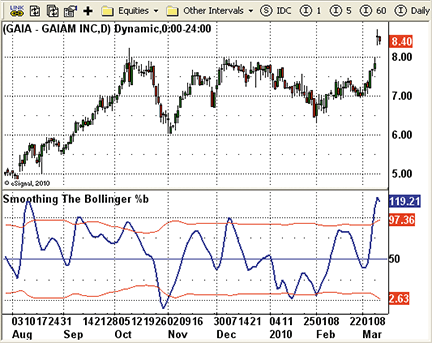
Figure 2: eSIGNAL, Sve_BB%b indicator
![]() WEALTH-LAB: SVE_BB%b INDICATOR
WEALTH-LAB: SVE_BB%b INDICATOR
This Traders’ Tip is based on “Smoothing The Bollinger %b” by Sylvain Vervoort in this issue.
We took this opportunity to add both the Bollinger %b and Sylvain Vervoot’s smoothed version to Wealth-Lab’s Tasc-Indicator library for version 5. The following WealthScript code shows how to access and plot both indicators, their standard deviation bands, and parameter sliders.
We have to wait for the author’s follow-up article for the indicator’s suggested use in a trading strategy; meanwhile, we look for price divergence as we would with the traditional %b indicator. At the time of this writing, the Nasdaq 100 appears to be setting up a peak divergence (Figure 3) just as it retests a prior trendline support, creating a good context to be on watch for a reversal.
WealthScript code (C#):

using System;
using System.Collections.Generic;
using System.Text;
using System.Drawing;
using WealthLab;
using WealthLab.Indicators;
using TASCIndicators;   /* %b indicators here */

namespace WealthLab.Strategies
{
   public class SVEpercentB : WealthScript
   {
      StrategyParameter _bPer;
      StrategyParameter _tPer;
      StrategyParameter _sdPer;
      StrategyParameter _sdhigh;
      StrategyParameter _sdlow;

      public SVEpercentB()
      {
         _bPer = CreateParameter("%b Period", 18, 10, 50, 1);
         _tPer = CreateParameter("Tema Period", 8, 2, 30, 1);
         _sdPer = CreateParameter("sd Period", 63, 5, 200, 1);
         _sdhigh = CreateParameter("sd high", 1.6, 0.1, 3.0, 0.1);
         _sdlow = CreateParameter("sd low", 1.6, 0.1, 3.0, 0.1);
      }

      protected override void Execute()
      {
         int TeAv = _tPer.ValueInt;
         int period = _bPer.ValueInt;
         StdDevCalculation sdc = StdDevCalculation.Population;

         // Bollinger %b and the SVE smoothed version
         DataSeries percb_sve = BollingerPctBSmoothed.Series(Bars, period, TeAv, sdc);
         DataSeries sdd = StdDev.Series(Close, 20, sdc);
         DataSeries percb = BollingerPctB.Series(Close, period, sdc);

         ChartPane cp = CreatePane(40, true, true);
         PlotSeries(cp, percb_sve, Color.Green, LineStyle.Solid, 2);
         PlotSeries(cp, percb, Color.Blue, LineStyle.Solid, 1);

         DataSeries percbUp = 50 + _sdhigh.Value * StdDev.Series(percb,_sdPer.ValueInt, sdc);
         DataSeries percbDn = 50 - _sdlow.Value * StdDev.Series(percb,_sdPer.ValueInt, sdc);
         percbUp.Description = "%b Upper band";
         percbDn.Description = "%b Lower band";
         PlotSeries(cp, percbUp, Color.Black, LineStyle.Solid, 1);
         PlotSeries(cp, percbDn, Color.Black, LineStyle.Solid, 1);
      }
   }
}
A sample chart is shown in Figure 3.
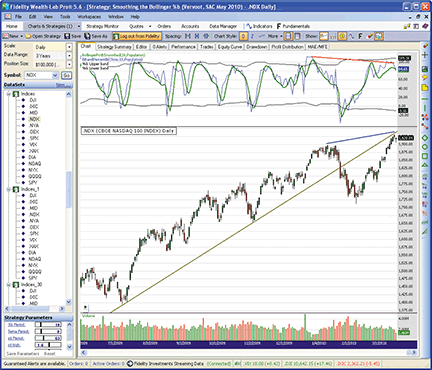
Figure 3: WEALTH-LAB, the Sve_BB%b indicator. Is the Nasdaq finally setting up for a correction?
![]() AMIBROKER: SVE_BB%b INDICATOR
AMIBROKER: SVE_BB%b INDICATOR
In “Smoothing The Bollinger %b” in this issue, author Sylvain Vervoort presents a variation of the classic Bollinger band %b indicator based on a combination of triple exponential smoothing and the heikin-ashi technique.
Implementing the Sve_BB%b indicator is easy in AmiBroker Formula Language. A ready-to-use formula for the indicator is presented in Listing 1. To use it, enter the formula in the Afl Editor, then press the Insert Indicator button. Then right-click on the chart and choose “Parameters” from the context menu in order to define the averaging periods and other variables.
LISTING 1
period = Param( "%b period", 18, 1, 100 );
TeAv = Param( "TEMA average", 8, 1, 30 );
afwh = Param( "Standard deviation High", 1.6, 0.1, 5 );
afwl = Param( "Standard deviation Low", 1.6, 0.1, 5 );
afwper = Param( "Standard deviation period", 63, 1, 200 );

price = (O+H+L+C)/4;
HaOpen = AMA( Ref( price, -1 ), 0.5 );
haC = ( price + haOpen + Max( H, haOpen ) + Min( L, haOpen ) ) / 4;

TMA1 = TEMA( haC, TeAv );
TMA2 = TEMA( TMA1, TeAv );
Diff = TMA1 - TMA2;
ZlHA = TMA1 + Diff;

ztema = TEMA( ZLHA, TeAv );
stdztema = StDev( ztema, period );

percb = ( ztema + 2 * stdztema - WMA( ztema, period ) ) / ( 4 * stdztema ) * 100;
Plot( percb, "PercB", colorBlue );
Plot( 50 + afwh*StDev( percb, afwper ) , "Upper", colorRed, styleDashed );
Plot( 50 - afwl*StDev( percb, afwper ) , "Lower", colorRed, styleDashed );
A sample chart is shown in Figure 4.
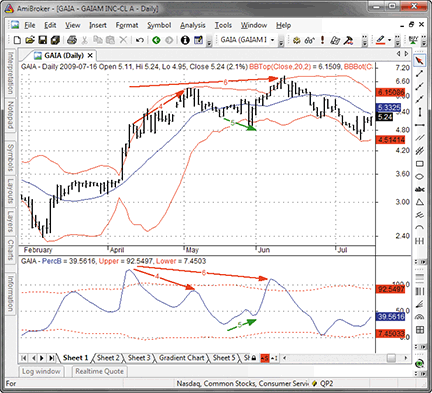
Figure 4: AMIBROKER, Sve_BB%b indicator. Shown is a price chart of GAIA with classic 20-day Bollinger bands (upper pane) and the SVE_BB%b (lower pane) with clear negative divergence during the up move.
![]() WORDEN BROTHERS STOCKFINDER: SVE_BB%b INDICATOR
WORDEN BROTHERS STOCKFINDER: SVE_BB%b INDICATOR
The Sve_BB%b indicator presented in Sylvain Vervoort’s article in this issue, “Smoothing The Bollinger %b,” has been made available in the StockFinder indicator library.
You can add the indicator to your chart by clicking the “Add Indicator/Condition” button or by simply typing “/Sve” and choosing “Sve_BBb” from the list of available indicators.
In Figure 5, we've added a condition to the chart by dragging Sve_BB%b to its upper channel and selecting “Create condition, above upper.” The condition is then dragged to the watchlist to show the last date the condition returned true for each symbol in the list. As you can see, Verizon (VZ) crossed through the upper channel on 3/9/2010, which is also marked by the orange arrow marker on the chart.
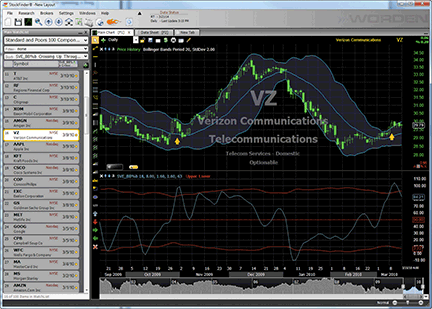
Figure 5: WORDEN BROTHERS STOCKFINDER, SVE_BB%b. Sylvain Vervoort’s smoothed Bollinger %b (Sve_BB%b indicator) is plotted in the bottom pane. A condition has been added to the chart to show “true” markers when the indicators crosses up through its upper band.
For more information or to start a free trial of StockFinder, visit www.StockFinder.com.
![]() NEUROSHELL TRADER: SVE_BB%b INDICATOR
NEUROSHELL TRADER: SVE_BB%b INDICATOR
The Sve_BB%b indicator presented by Sylvain Vervoort in his article in this issue (“Smoothing The Bollinger %b”) can be easily implemented with a few of NeuroShell Trader’s 800+ indicators.
Select “New Indicator…” from the Insert menu and use the Indicator Wizard to create the following indicators.
TMA:
Tema ( HeikinAshiClose(Open, High, Low, Close), 8 )

ZTMA:
Tema( Add2( TMA, Subtract( TMA, Tema( TMA, 8 ) ) ), 8 )

SVE_BB%b:
Multiply2( 100, Divide(Add2( ZTMA, Subtract( Multiply2( 2, StndDev(ZTMA, 18)), LinWgtAvg( ZTMA, 18) ) ),
Multiply2( 4, StndDev(ZTMA, 18) ) ) )

SVE_BB%b HIGH REF:
Add2( 50, Multiply2( 1.6, StndDev( SVE_BB%b, 63 ) ) )

SVE_BB%b LOW REF:
Subtract( 50, Multiply2( 1.6, StndDev( SVE_BB%b, 63 ) ) )
Note that the Sve_BB%b is based on the HeikinAshiClose and Tema custom indicators, which are included along with indicators listed above in the chart that NeuroShell Trader users may download from the tech support website.
The chart in Figure 6 includes a neural network prediction for Gaim, which generated an 87.2% annualized return in-sample (2006–08) and 58.3% annualized return out-of-sample (2009–March 2010). The blue triangles signify long entry points while the red triangles signify short entry points. The inputs to the network were simply the spreads between Vervoort’s Sve_BB%b indicator and the high and low bands. The inputs were not optimized. Use of a neural network with Vervoort’s indicators allows you to trade an analytical model rather than trying to contrive trading rules or trade the model visually.
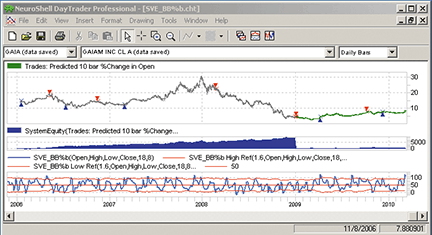
Figure 6: NEUROSHELL TRADER, Sve_BB%b indicator. This sample NeuroShell Trader chart demonstrates Bollinger bands and the SVE_BB%b as well as a neural network trading model that uses Sylvain Vervoort’s indicators.
![]() AIQ: SVE_BB%b INDICATOR
AIQ: SVE_BB%b INDICATOR
The Aiq code is given here for Sylvain Vervoort’s indicators described in his article in this issue, “Smoothing The Bollinger %b.”
Note that I have provided only the code for the final indicator, the Sve_BB%b. In order to plot the author’s indicator — which contains three indicator lines and a reference line at 50 — on an Aiq chart, we have to use two custom plots. I have labeled these plotA and plotB in the code next to the formulas. These need to be added to the Aiq chart as custom indicators.
In Figure 7, I show plotA, which has the upper band, the Sve_BB%b, and the midpoint reference line at 50. We then must do plotB to show the lower band, the Sve_BB%b (repeated), and the midpoint reference line at 50 (repeated). Also note that the weighted moving average does not have an input because the parameter of 18-length for the weighted moving average (Wma) had to be coded longhand. To change this parameter, we need to completely recode the Wma for the new length. All the other values that I have provided in the inputs (see the input section of code) are parameters that can be changed without any recoding.
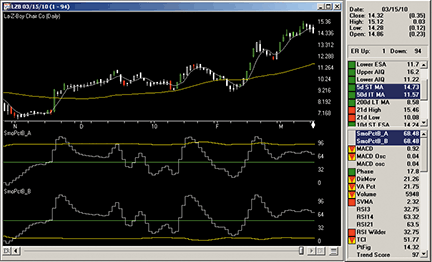
Figure 7: AIQ SYSTEMS, Sve_BB%b indicator. Here is a chart of La-Z-Boy Inc. with the SVE_BB%b indicators.
The code can be downloaded from the Aiq website at www.aiqsystems.com and also from www.tradersedgesystems.com/traderstips.htm.
! SMOOTHING THE BOLLINGER %b
! Author: Sylvain Vervoort, TASC May 2010
! Coded by: Richard Denning 3/11/2010
! www.TradersEdgeSystems.com

! INPUTS:
smoLen is 8.
stdMultH is 1.6.
stdMultL is 1.6.
sDevLen is 63.

! ABBREVIATIONS:
C is [close].
O is [open].
H is [high].
L is [low].

typPrice is  (O+H+L+C)/4.
stop if reportdate() - ruledate() >= 200.
haOpen is iff(stop,C,valresult(haO,1)).
haO is (valresult(typPrice,1) + haOpen) / 2.
haCL is (typPrice + haO + Max(H,haO) + Min(L,haO)) / 4.

EMA1 is expavg(haCL, smoLen).
TMA1 is (3 * EMA1 - 3 * expavg(EMA1,smoLen)) +
	expavg(expavg(EMA1,smoLen),smoLen).
EMA2 is expavg(TMA1, smoLen).
TMA2 is (3 * EMA2 - 3 * expavg(EMA2,smoLen)) +
	expavg(expavg(EMA2,smoLen),smoLen).
ZLHA is 2*TMA1 - TMA2.

wmaZLHA18 is (18*ZLHA + 17*valresult(ZLHA,1) +
   16*valresult(ZLHA,2) + 15*valresult(ZLHA,3) +
   14*valresult(ZLHA,4) + 13*valresult(ZLHA,5) +
   12*valresult(ZLHA,6) + 11*valresult(ZLHA,7) +
   10*valresult(ZLHA,8) + 9*valresult(ZLHA,9) +
   8*valresult(ZLHA,10) + 7*valresult(ZLHA,11) +
   6*valresult(ZLHA,12) + 5*valresult(ZLHA,13) +
   4*valresult(ZLHA,14) + 3*valresult(ZLHA,15) +
   2*valresult(ZLHA,16) + 1*valresult(ZLHA,17) ) / 171.

stdevZLHA18 is sqrt(variance(ZLHA,18)).
upperBand is wmaZLHA18 + 2*stdevZLHA18.
lowerBand is wmaZLHA18 - 2*stdevZLHA18.
stdevZLHA_lines is sqrt(variance(SVEpctB,sDevLen)).

SVEpctB is (ZLHA - lowerBand) /
	(upperBand - lowerBand) * 100. ! PlotA & PlotB
upperLine is 50 + stdMultH * stdevZLHA_lines.  ! PlotA
lowerLine is 50 - stdMultL * stdevZLHA_lines.  ! PlotB
middleLine is 50.		       ! PlotA & PlotB
![]() TRADERSSTUDIO: SVE_BB%b INDICATOR
TRADERSSTUDIO: SVE_BB%b INDICATOR
The TradersStudio code is provided here for Sylvain Vervoort’s indicator and related functions described in his article in this issue, “Smoothing The Bollinger %b.”
I broke out the computations for the final indicator (labeled the Sve_pctB) into five separate functions: PctB, haC, Tema, Zlha, and Sve_pctB_HA.
The function pctB will calculate all the varieties of the BB%b indicators by changing the input lengths and middle band moving average types.
The haC function returns the heikin-ashi close as modified by Vervoort.
The Tema function returns the triple exponential moving average.
The Zlha function returns the zero-lag heikin-ashi close.
The Sve_pctB_HA function is a multi-output function and it returns the final three indicator lines and the Sve_pctB_HA, along with the UpperBand and the LowerBand.
Breaking up the indicator into these components makes for much easier debugging and allows us to call the functions from both the indicator plot and from a system without having to duplicate the code multiple times.
I created a simple contratrend trading system that uses the indicator, then tested it on both my standard futures portfolio (38 futures contracts) and also on a group of Nasdaq stocks (101 stocks) that are both liquid and fairly volatile. The futures system performed very poorly, but the stock system appears to have some potential.
Since the author indicates he will provide some system tests that use the indicator in his next article, I decided to wait to show my comparison tests to the original Bollinger %b until then. So for this issue, I will provide only the code and a chart showing the indicator as applied to a price chart of Apple Inc. (Figure 8).
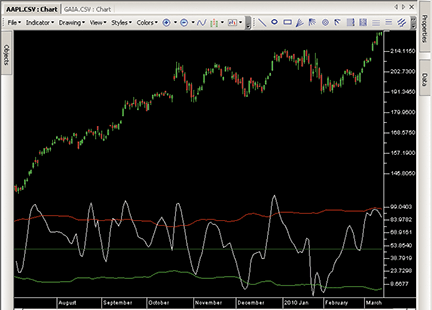
Figure 8: TRADERSSTUDIO, Sve_BB%b indicator. Here is a chart of Apple Inc. with the SVE_BB%b indicator.
The code can be downloaded from the TradersStudio website at www.TradersStudio.com → Traders Resources → FreeCode and also from www.TradersEdgeSystems.com/traderstips.htm.
' SMOOTHING THE BOLLINGER %b
' Author: Sylvain Vervoort, TASC May 2010
' Coded by: Richard Denning 3/11/2010
' www.TradersEdgeSystems.com

'PERCENT B WITH OPTIONAL CALCULATION TYPES:
Function PctB(price, bandLen, multStd, maType)
' maType = 1 uses simple average for middle band
' maType = 2 uses EMA For middle band
' maType = 3 uses WMA For middle band
Dim middleBand As BarArray
Dim upperBand As BarArray
Dim lowerBand As BarArray
Dim stdevPrice As BarArray
stdevPrice = StdDevS(price,bandLen,0)
If maType = 1 Then middleBand = Average(price,bandLen)
If maType = 2 Then middleBand = XAverage(price,bandLen)
If maType = 3 Then middleBand = weightedMA(price,bandLen,0)
upperBand = middleBand + multStd * stdevPrice
lowerBand = middleBand - multStd * stdevPrice
If (upperBand - lowerBand) > 0 Then
    PctB=(price-lowerBand)/(upperBand-lowerBand) * 100
End If
End Function

'----------------------------------------------------------
'HEIKIN-ASHI CLOSE (as modified by author):
Function haC()
    Dim haCL As BarArray
    Dim haO As BarArray
    Dim typPrice As BarArray
    typPrice =  (O+H+L+C)/4
    haO = (typPrice[1] + haO[1]) / 2
    haCL = (typPrice + haO + Max(H,haO) + Min(L,haO)) / 4
    haC = haCL
End Function
'----------------------------------------------------------
' TRIPLE EXPONENTIAL MOVING AVERAGE:
Function TEMA(price,temaLen)
Dim EMA As BarArray
EMA = XAverage(price, temaLen, 0)
TEMA=(3*EMA-3*XAverage(EMA,temaLen))+XAverage(XAverage(EMA,temaLen),temaLen)
End Function
'-----------------------------------------------------------
' ZERO LAG HEIKIN-ASHI CLOSE (VERVOORT version):
Function ZLHA(zlhaLen)
Dim TMA1 As BarArray
Dim TMA2 As BarArray
Dim diff
TMA1 = TEMA(haC(),zlhaLen)
TMA2 = TEMA(TMA1,zlhaLen)
diff = TMA1 - TMA2
ZLHA = TMA1 + diff
End Function
'------------------------------------------------------------
'SVE_BB%b_HA INDICATOR:
function SVE_pctB_HA(bbLen,smoLen,stdMultH,stdMultL,sDevLen,byref upperBand, byref lowerBand)
Dim sDevB
SVE_pctB_HA = pctB(ZLHA(smoLen),bbLen,2,3)
sDevB = StdDevS(SVE_pctB_HA, sDevLen, 0)
upperBand = 50 + stdMultH * sDevB
lowerBand = 50 - stdMultL * sDevB
End Function
'-------------------------------------------------------------
' INDICATOR TO PLOT THE SVE_BB%b INDICATOR (4 lines):
sub SVE_pctB_IND(bbLen,smoLen,stdMultH,stdMultL,sDevLen)
Dim upperBand, lowerBand
plot1(SVE_pctB_HA(bbLen,smoLen,stdMultH,stdMultL,sDevLen,upperBand,lowerBand))
plot2(upperBand)
plot3(lowerBand)
plot4(50)
End Sub
'--------------------------------------------------------------
![]() STRATASEARCH: SVE_BB%b INDICATOR
STRATASEARCH: SVE_BB%b INDICATOR
While Sylvain Vervoort will be introducing a trading system in his next article in Stocks & Commodities, in his article in this issue, “Smoothing The Bollinger %b,” he provides us with some interesting ideas on how this indicator might be used. In fact, by following his suggestion of identifying a divergence with price, we were able to create an impressive custom trading system on our own.
To evaluate our customized system, we evaluated the S&P 500 stocks from 2004 through 2009 using a spread of 0.04 and commissions of $10.00 on each side. The average annual return for this six-year period was nearly 10%, while a buy and hold of the S&P index itself was just 0.1%. Percentage of profitable trades was nearly 75%, and the system was profitable in five of the six years. Only in 2008 did it have a loss of 17.5%, far less than the S&P index itself.
While these results are impressive on their own, they were also done with a static set of parameters and no additional trading rules. StrataSearch users can explore this system further by running an automated search for supporting trading rules. Improved parameter sets can also be explored through the automated search.
Additional information on this system, including plug-ins, can be found in the Shared Area of the StrataSearch user forum. This month’s plug-in provides the customized system as well as a set of trading rules for exploring the system further.
//*********************************************************
// SVE_BB%b
//*********************************************************
period = parameter("%b period");
TeAv = parameter("Tema average");
afwh = parameter("Std Dev High");
afwl = parameter("Std Dev Low");
afwper = parameter("Std Dev Period");
haOpen =(Ref((O+H+L+C)/4,-1) + $PREV)/2;
haC =((O+H+L+C)/4+haOpen+higher(H,haOpen)+
	lower(L,haOpen))/4;
TMA1 = Tema(haC,TeAv);
TMA2 = Tema(TMA1,TeAv);
Diff = TMA1 - TMA2;
ZlHA = TMA1 + Diff;
percb =(Tema(ZLHA,TeAv)+2*
	Sdev(Tema(ZLHA,TeAv),period)-
	Mov(Tema(ZLHA,TeAv),period,WEIGHTED))/
	(4*Sdev(Tema(ZLHA,TeAv),period))*100;
SVEBB = percb;
A sample chart is shown in Figure 9.
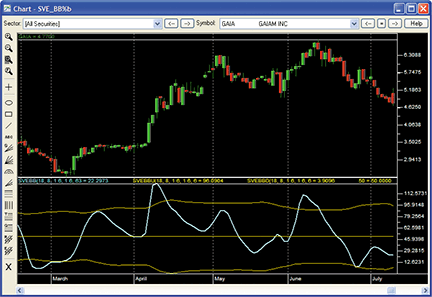
Figure 9: STRATASEARCH, Smoothing the Bollinger %b. Following the setup in early March 2010 of lower prices and higher SVE_BB%b lows, prices responded with a significant upswing.
![]() TRADINGSOLUTIONS: SVE_BB%b INDICATOR
TRADINGSOLUTIONS: SVE_BB%b INDICATOR
In the article “Smoothing The Bollinger %b” in this issue, author Sylvain Vervoort presents a methodology for smoothing the Bollinger %b indicator based on his previous smoothing work.
These functions are described below and are also available as a function file that can be downloaded from the TradingSolutions website (www.tradingsolutions.com) in the Free Systems section.
Function Name: Heikin-Ashi Open (Vervoort)
Short Name: haOpenV
Inputs: Open, High, Low, Close
Div (Add (Lag (Div (Add (Add (Open, High), Add (Low, Close)), 4), 1) , Prev (1)), 2)

Function Name: Heikin-Ashi Close (Vervoort)
Short Name: haCloseV
Inputs: Open, High, Low, Close
Div (Add (Add (Div (Add (Add (Open, High), Add (Low, Close)), 4), haOpenV (Open, High, Low, Close)),
Add (Max (High, haOpenV
(Open, High, Low, Close)), Min (Low, haOpenV (Open, High, Low, Close)))), 4)

Function Name: Triple Exponential Moving Average
Short Name: TEMA
Inputs: Data, Period
Sub (Mult (EMA (Data, Period), 3),Add (Mult (EMA (EMA (Data, Period), Period), 3), EMA (EMA (EMA (Data,
Period), Period), Period)))

Function Name: Zero-Lag Heikin Ashi TEMA
Short Name: ZeroLagHATEMA
Inputs: Open, High, Low, Close, Period
Add (TEMA (haCloseV (Open, High, Low, Close), Period),Sub (TEMA (haCloseV (Open, High, Low, Close),
Period),TEMA (TEMA
(haCloseV (Open, High, Low, Close), Period), Period)))

Function Name: Bollinger Band %b (Smoothed)
Short Name: SVE_BB%b
Inputs: Open, High, Low, Close, Tema average, %b period
Mult (Div (Add (TEMA (ZeroLagHATEMA (Open, High, Low, Close, Tema average), Tema average), Sub (Mult
(2, StDev (TEMA
(ZeroLagHATEMA (Open, High, Low, Close, Tema average), Tema average), %b period)),WMA (TEMA (ZeroLagHATEMA
(Open, High, Low,
Close, Tema average), Tema average), %b period))), Mult (4, StDev (TEMA (ZeroLagHATEMA (Open, High, Low,
Close, Tema average),
Tema average), %b period))), 100)

Function Name: Bollinger Band %b (Lower Band)
Short Name: SVE_BB%b_Lower
Inputs: Standard Deviation Low, Open, High, Low, Close, Tema average, %b period, Standard Deviation Period
Sub (50, Mult (Standard Deviation Low, StDev (SVE_BB%b (Open, High, Low, Close, Tema average, %b period),
Standard Deviation Period)))

Function Name: Bollinger Band %b (Upper Band)
Short Name: SVE_BB%b_Upper
Inputs: Standard Deviation High, Open, High, Low, Close, Tema average, %b period, Standard Deviation Period
Add (50, Mult (Standard Deviation High, StDev (SVE_BB%b (Open, High, Low, Close, Tema average, %b period),
Standard Deviation Period)))
![]() NINJATRADER: SVE_BB%b INDICATOR
NINJATRADER: SVE_BB%b INDICATOR
The smoothed Bollinger %b indicator as discussed in “Smoothing The Bollinger %b” by Sylvain Vervoort in this issue has been implemented as a NinjaTrader indicator available for download at www.ninjatrader.com/SC/May2010SC.zip.
Once it has been downloaded, from within the NinjaTrader Control Center window, select the menu File → Utilities → Import NinjaScript and select the downloaded file. This indicator is for NinjaTrader version 6.5 or greater.
You can review the indicator’s source code by selecting the menu Tools → Edit NinjaScript → Indicator from within the NinjaTrader Control Center window and selecting Svebb.
NinjaScript indicators are compiled Dlls that run native, not interpreted, for the highest performance possible.
A sample chart implementing the strategy is shown in Figure 10.
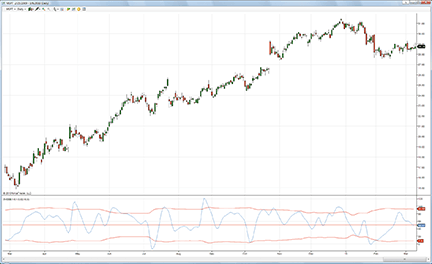
Figure 10: NINJATRADER, SMOOTHED BOLLINGER %b. This screenshot shows the smoothed Bollinger %b indicator applied to a daily chart of Microsoft (MSFT).
![]() TRADECISION: SVE_BB%b INDICATOR
TRADECISION: SVE_BB%b INDICATOR
In his article “Smoothing The Bollinger %b” in this issue, Sylvain Vervoot investigates a variation of the Bollinger bands indicator to find clear turning points that will help traders identify entry and exit points.
Using Tradecision’s Function Builder, set up the Tema function:
TEMA function:
function (Price:Numeric = C, Length:Numeric = 9): Numeric;
return (3*EMA(Price,Length) - 3*EMA(EMA(Price,Length),Length)) + EMA(EMA(EMA(Price,Length),Length),Length);
Using Tradecision’s Indicator Builder, create the smoothed Bollinger %b, smoothed Bollinger %b top, and smoothed Bollinger %b bottom indicators:
Smoothed Bollinger %b indicator:
input
period:"%b period:",18,1,100;
TeAv:"Tema average:",8,1,30;
afwh:"Standard deviation high",1.6,0.1,5;
afwl:"Standard deviation low",1.6,0.1,5;
afwper:"Standard deviation period",63,1,200;
end_input

var
denom:=0;
WeightPrice:=0;
haOpen:=0;
haC:=0;
TMA1:= 0;
TMA2:= 0;
Diff:= 0;
ZlHA:= 0;
percb:=0;
end_var

if HISTORYSIZE < 2 then return 0;
WeightPrice:=(O\1\ + H\1\ + L\1\ + C\1\) / 4;
haOpen:=(WeightPrice + WeightPrice\1\) / 2;
haC:=((O + H + L + C) / 4 + haOpen + Max(H, haOpen) + Min(L, haOpen)) / 4;

TMA1:= TEMA(haC,TeAv) ;
TMA2:= TEMA(TMA1,TeAv);
Diff:=TMA1 - TMA2;
ZlHA:=TMA1 + Diff;

denom:= 4 * StdDev(TEMA(ZLHA, TeAv), period);
        if denom = 0 then return inf;

percb:=(TEMA(ZLHA, TeAv) + 2 * StdDev(TEMA(ZLHA, TeAv), period) - WMA(TEMA(ZLHA, TeAv), period)) / denom * 100;
                   return percb;

Smoothed Bollinger %b top indicator:
input
period:"%b period:",18,1,100;
TeAv:"Tema average:",8,1,30;
afwh:"Standard deviation high",1.6,0.1,5;
afwl:"Standard deviation low",1.6,0.1,5;
afwper:"Standard deviation period",63,1,200;
end_input

var
denom:=0;
WeightPrice:=0;
haOpen:=0;
haC:=0;
TMA1:= 0;
TMA2:= 0;
Diff:= 0;
ZlHA:= 0;
percb:=0;
end_var

if HISTORYSIZE < 2 then return 0;
WeightPrice:=(O\1\ + H\1\ + L\1\ + C\1\) / 4;
haOpen:=(WeightPrice + WeightPrice\1\) / 2;
haC:=((O + H + L + C) / 4 + haOpen + Max(H, haOpen) + Min(L, haOpen)) / 4;

TMA1:= TEMA(haC,TeAv) ;
TMA2:= TEMA(TMA1,TeAv);
Diff:=TMA1 - TMA2;
ZlHA:=TMA1 + Diff;

denom:= 4 * StdDev(TEMA(ZLHA, TeAv), period);
        if denom = 0 then return inf;

percb:=(TEMA(ZLHA, TeAv) + 2 * StdDev(TEMA(ZLHA, TeAv), period) - WMA(TEMA(ZLHA, TeAv), period)) / denom * 100;
                   return 50 + afwh * StdDev(percb, afwper);

Smoothed Bollinger %b bottom indicator:
input
period:"%b period:",18,1,100;
TeAv:"Tema average:",8,1,30;
afwh:"Standard deviation high",1.6,0.1,5;
afwl:"Standard deviation low",1.6,0.1,5;
afwper:"Standard deviation period",63,1,200;
end_input

var
denom:=0;
WeightPrice:=0;
haOpen:=0;
haC:=0;
TMA1:= 0;
TMA2:= 0;
Diff:= 0;
ZlHA:= 0;
percb:=0;
end_var

if HISTORYSIZE < 2 then return 0;
WeightPrice:=(O\1\ + H\1\ + L\1\ + C\1\) / 4;
haOpen:=(WeightPrice + WeightPrice\1\) / 2;
haC:=((O + H + L + C) / 4 + haOpen + Max(H, haOpen) + Min(L, haOpen)) / 4;

TMA1:= TEMA(haC,TeAv) ;
TMA2:= TEMA(TMA1,TeAv);
Diff:=TMA1 - TMA2;
ZlHA:=TMA1 + Diff;

denom:= 4 * StdDev(TEMA(ZLHA, TeAv), period);
        if denom = 0 then return inf;

percb:=(TEMA(ZLHA, TeAv) + 2 * StdDev(TEMA(ZLHA, TeAv), period) - WMA(TEMA(ZLHA, TeAv), period)) / denom * 100;
                   return 50 - afwh * StdDev(percb, afwper);
To import the strategy into Tradecision, visit the area “Traders’ Tips from Tasc Magazine” at www.tradecision.com/support/tasc_tips/tasc_traders_tips.htm or copy the code from the Stocks & Commodities website at www.traders.com.
A sample chart is shown in Figure 11.
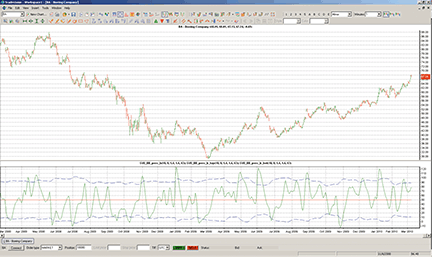
FIGURE 11: TRADECISION, SMOOTHED BOLLINGER BANDS %b INDICATOR. Here we see the result of plotting several lines of Sylvain Vervoort’s Bollinger bands %b indicator.
![]() NEOTICKER: SVE_BB%b INDICATOR
NEOTICKER: SVE_BB%b INDICATOR
Sylvain Vervoort’s Sve_BB%b indicator can be implemented using NeoTicker formula language (Listing 1). This indicator has five parameters: %b period, Tema period, standard deviation high, standard deviation low, and standard deviation period. This indicator has three plots in a new pane that will show the Bollinger band and oscillator (Figure 12).
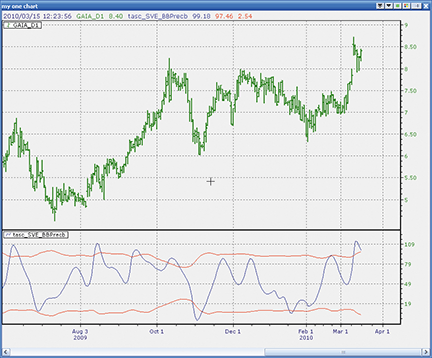
Figure 12: NEOTICKER, Sve_BB%b indicator. This indicator has three plots.
A downloadable version of this indicator will be available at the NeoTicker blog (https://blog.neoticker.com).
LISTING 1
$period := choose(param1 < 1, 1, param1 > 100, 100, param1);
$TeAv := choose(param2 < 1, 1, param2 > 30, 30, param2);
$afwh := choose(param3 < 1, 1, param3 > 5, 5, param3);
$afwl := choose(param4 < 1, 1, param4 > 5, 5, param4);
$afwper := choose(param5 < 1, 1, param5 >200, 200, param5);
$haOpen := ((O(1)+H(1)+L(1)+C(1))/4+$haOpen)/2;
haC := ((O+H+L+C)/4+$haOpen+maxlist(H,$haOpen)+minlist(l,$haOpen))/4;
TMA1 := tema(haC,$TeAv);
TMA2 := tema(TMA1, $TeAv);
$Diff := TMA1-TMA2;
ZLHA := TMA1+$Diff;
percb := (tema(ZLHA,$TeAv)+2*stddev(tema(ZLHA,$TeAv),
$period)-
          mov(tema(ZLHA,$TeAv),"Weighted",$period))/
         (4*stddev(tema(ZLHA,$TeAv),$period))*100;
plot1 := percb;
plot2 := 50+$afwh*stddev(percb,$afwper);
plot3 := 50-$afwl*stddev(percb,$afwper);
![]() WAVE59: SVE_BB%b INDICATOR
WAVE59: SVE_BB%b INDICATOR
In his article in this issue, Sylvain Vervoort describes a modified %b oscillator based on Bollinger bands. As he hinted at in some of his charts, this indicator works very well when used to locate divergence signals. See Figure 13 for some recent signals in gold futures.
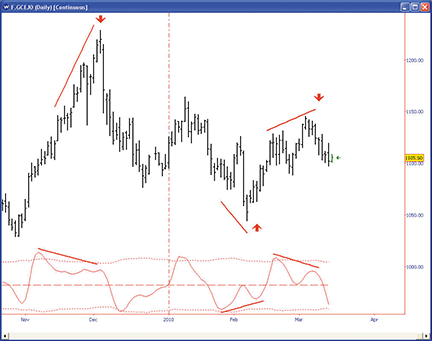
FIGURE 13: WAVE59, Sve_BB%b indicator. This sample chart shows some recent signals in gold futures as given by the SVE_BB%b indicator.
The following script implements this indicator in Wave59. As always, users of Wave59 can download these scripts directly using the QScript Library found at https://www.wave59.com/library.
Indicator:  Vervoort_SVE_BB
# This indicator plots Sylvain Vervoort's modified %b oscillator
# from the May 2010 issue of Stocks & Commodities magazine

input:period(18), teav(8), afwh(1.6), afwl(1.6), afwper(63);

# initialize vars
if (barnum == barsback) haopen1, haopen=0;

# compute %bb
haopen1 = (o+h+l+c)/4;
haopen = (haopen1[1]+haopen1[2])/2;
hac = (haopen1+haopen+max(high,haopen)+min(low,haopen))/4;
tma1 = tema(hac,teav);
tma2=  tema(tma1,teav);
diff = tma1-tma2;
zlha = tma1+diff;

pb1 =t ema(zlha,teav);
percb = pb1+2*stddev(pb1,period)-waverage(pb1,period);
percb /= 4*stddev(pb1,period);
percb *= 100;
band = stddev(percb,afwper);

# plot percb and bands
plot1 = percb;
plot2 = 50;
style2 = ps_dash;
plot3 = 50+afwh*band;
plot4 = 50-afwl*band;
style3, style4 = ps_dot;
![]() TRADE NAVIGATOR: SVE_BB%b INDICATOR
TRADE NAVIGATOR: SVE_BB%b INDICATOR
Trade Navigator offers everything needed for recreating the indicators discussed in Sylvain Vervoort’s article in this issue, “Smoothing The Bollinger %b.” Here is how to recreate the indicators and then add them to any chart in Trade Navigator.
You can recreate the custom indicators by using the following TradeSense code. First, open the Trader’s Toolbox, click on the Functions tab and click the New button (Lower Sve_BB). Type in the following code:
&haOpen := HeikinAshi Open
&haC := (AvgOHLC + &haOpen + Max (High , &haOpen) + Min (Low , &haOpen)) / 4
&TMA1 := TEMA (&haC , TeAv , False)
&TMA2 := TEMA (&TMA1 , TeAv , False)
&DIFF := &TMA1 - &TMA2
&ZLHA := &TMA1 + &DIFF
&percb := (TEMA (&ZLHA , TeAv , False) + 2 * MovingStdDev (TEMA (&ZLHA , TeAv , False) ,
 period) - MovingAvgW (TEMA (&ZLHA , TeAv , False) ,
 period)) / (4 * MovingStdDev (TEMA (&ZLHA , TeAv , False) , period)) * 100

50 - afwl * MovingStdDev (&percb , afwper)
When you verify or save the function, you will get an Add Inputs message. Click the Add button and set the Input values:
TeAv = 8
period = 18
afwl = 1.6
afwper = 63
Click the Verify button. When you are finished, click the Save button, type a name for your new function and click OK.
Repeat these steps for the Sve_BB and Upper Sve_BB functions using the following formula for each:
SVE_BB

&haOpen := HeikinAshi Open
&haC := (AvgOHLC + &haOpen + Max (High , &haOpen) + Min (Low , &haOpen)) / 4
&TMA1 := TEMA (&haC , TeAv , False)
&TMA2 := TEMA (&TMA1 , TeAv , False)
&DIFF := &TMA1 - &TMA2
&ZLHA := &TMA1 + &DIFF
&percb := (TEMA (&ZLHA , TeAv , False) + 2 * MovingStdDev (TEMA (&ZLHA , TeAv , False) ,
 period) - MovingAvgW (TEMA (&ZLHA , TeAv , False) ,
 period)) / (4 * MovingStdDev (TEMA (&ZLHA , TeAv , False) , period)) * 100
&percb

Inputs:

TeAv = 8
Period = 18

Upper SVE_BB

&haOpen := HeikinAshi Open
&haC := (AvgOHLC + &haOpen + Max (High , &haOpen) + Min (Low , &haOpen)) / 4
&TMA1 := TEMA (&haC , TeAv , False)
&TMA2 := TEMA (&TMA1 , TeAv , False)
&DIFF := &TMA1 - &TMA2
&ZLHA := &TMA1 + &DIFF
&percb := (TEMA (&ZLHA , TeAv , False) + 2 * MovingStdDev (TEMA (&ZLHA , TeAv , False) ,
 period) - MovingAvgW (TEMA (&ZLHA , TeAv , False) ,
 period)) / (4 * MovingStdDev (TEMA (&ZLHA , TeAv , False) , period)) * 100

50 + afwh * MovingStdDev (&percb , afwpr)

Inputs:

TeAv = 8
Period = 18
Afwh = 1.6
Afwpr = 63
To chart it, go to the Add to Chart window by clicking on the chart and typing “A” on the keyboard. Click on the Indicators tab, find the Lower Sve_BB indicator in the list and either double-click on it or highlight the name and click the Add button.
Repeat these steps to add the Bollinger Lower Band, Bollinger Upper Band and MovingAvg, Sve_BB and Upper Sve_BB indicators. Bollinger Lower Band, Bollinger Upper Band and MovingAvg already exist in Trade Navigator as predefined functions with inputs that can be set in the Chart Settings window.
Click on the chart and type the letter “E.” Highlight each indicator and change it to the desired color in the chart settings window. You can also set the inputs for Bollinger Lower Band, Bollinger Upper Band, and MovingAvg at this time. When you have them the way you want to see them, click OK.
You can save your new chart as a template to use for other charts. Once you have the chart set up, go to the Charts dropdown menu, select Templates and then “Manage chart templates.” Click on the New button, type in a name for your new template, and click OK.
Genesis Financial Technologies has provided a library called “Smoothing The Bollinger,” which includes a template with the indicators discussed in Vervoort’s article, as a special file named “SC1005,” downloadable through Trade Navigator.
![]() UPDATA: SVE_BB%b INDICATOR
UPDATA: SVE_BB%b INDICATOR
This tip is based on Sylvain Vervoort’s article in this issue, “Smoothing The Bollinger %b.”
In the article, Vervoort offers a variant of the %b indicator. Price data is recalculated via heikin-ashi techniques, then smoothed with triple exponential moving averages to create an oscillator with self-adjusting benchmarks.
The Updata code for this indicator has now been added to the Updata Indicator Library and may be downloaded by clicking the Custom menu and then Indicator Library. Those who cannot access the library due to a firewall may paste the following code into the Updata custom editor and save it.
NAME SVE_BB%b
DISPLAYSTYLE 4LINES
INDICATORTYPE CHART
COLOUR RGB(0,0,255)
COLOUR2 RGB(255,0,0)
COLOUR3 RGB(255,0,0)
COLOUR4 RGB(255,0,0)
PARAMETER "Period" #PER=18
PARAMETER "TEMA Ave" #TEAV=8
PARAMETER "StdDev High" @AFWH=1.5
PARAMETER "StdDev Low" @AFWL=1.5
PARAMETER "StdDev Period" #AFWPER=63
@PRICE=0
@HAOPEN=0
@HAC=0
@TMA1=0
@TMA2=0
@TMA3=0
@DIFF=0
@ZLHA=0
@PERCB=0

FOR #CURDATE=0 TO #LASTDATE

If #CURDATE>#AFWPER

@PRICE=(OPEN+HIGH+LOW+CLOSE)/4
@HAOPEN=(HIST(@PRICE,1)+HIST(@HAOPEN,1))/2
@HAC=(@PRICE+@HAOPEN+MAX(HIGH,@HAOPEN)+MIN(LOW,@HAOPEN))/4
@TMA1=(3*SGNL(@HAC,#TEAV,E)-3*SGNL(SGNL(@HAC,#TEAV,E),#TEAV,E))+
      SGNL(SGNL(SGNL(@HAC,#TEAV,E),#TEAV,E),#TEAV,E)
@TMA2=(3*SGNL(@TMA1,#TEAV,E)-3*SGNL(SGNL(@TMA1,#TEAV,E),#TEAV,E))+
      SGNL(SGNL(SGNL(@TMA1,#TEAV,E),#TEAV,E),#TEAV,E)
@DIFF=@TMA1-@TMA2
@ZLHA=@TMA1+@DIFF
@TMA3=(3*SGNL(@ZLHA,#TEAV,E)-3*SGNL(SGNL(@ZLHA,#TEAV,E),#TEAV,E))+
      SGNL(SGNL(SGNL(@ZLHA,#TEAV,E),#TEAV,E),#TEAV,E)
@PERCB=100*(@TMA3+2*STDDEV(@TMA3,#PER)-
       SGNL(@TMA3,#PER,W))/(4*STDDEV(@TMA3,#PER))
@PLOT=@PERCB
@PLOT2=50+@AFWH*STDDEV(@PERCB,#AFWPER)
@PLOT3=50-@AFWL*STDDEV(@PERCB,#AFWPER)
@PLOT4=50

EndIf

NEXT
A sample chart is shown in Figure 14.
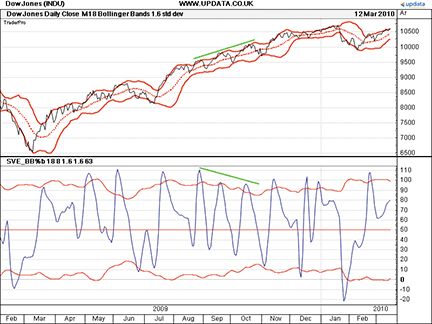
FIGURE 14: UPDATA, SMOOTHED %b. This chart shows the smoothed %b of the Dow Jones Industrial Average and its divergence with price from August to November 2009.
![]() CHARTSY: SVE_BB%b INDICATOR
CHARTSY: SVE_BB%b INDICATOR
(For Windows, Mac, or Linux)
The Sve_BB%b indicator presented by Sylvain Vervoort in his article in this issue, “Smoothing The Bollinger %b,” is available as an indicator plug-in in Chartsy. To install it, go to Tools → Plugins → Available Plugins, check it, and click Install.
You can find the Java source code for this indicator here: https://chartsy.svn.sourceforge.net/viewvc/chartsy/trunk/Chartsy/Bollinger Bands %25b/src/org/chartsy/bollingerb/
A sample chart is shown in Figure 15. Figure 16 shows an indicator properties window.
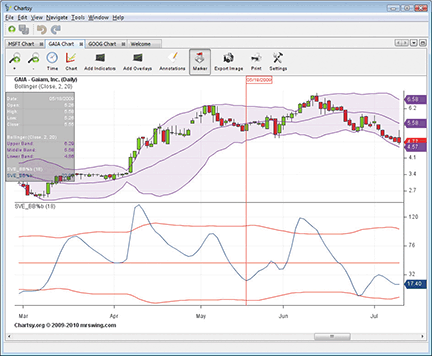
FIGURE 15: CHARTSY, the Sve_BB%b indicator. Here is a sample chart demonstrating the SVE_BB%b indicator in Chartsy.
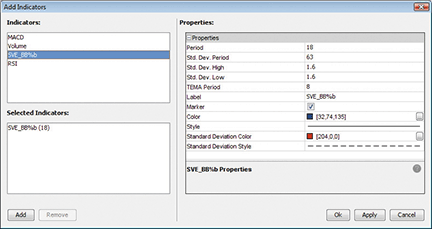
FIGURE 16: CHARTSY, the Sve_BB%b indicator. Here is the indicator properties window for the SVE_BB%b.
To discuss these tools and help us develop others, please visit our forum at www.chartsy.org. Our development staff will assist you and you can become a Chartsy contributor yourself.
![]() TRADING BLOX: SVE_BB%b INDICATOR
TRADING BLOX: SVE_BB%b INDICATOR
In “Smoothing The Bollinger %b” in this issue, author Sylvain Vervoort explains how to remove noise from the traditional %b indicator, used to identify clear turning points and divergences.
This indicator can be implemented in Trading Blox by following these steps:
- Create a new Auxiliary Blox. Name it “SVE_BBPct_b”
- Define the parameters: period (integer), TeAv (integer), afwh (floating point), afwl (floating point), afwper (integer).
- Define the Instrument Permanent Variables: haOpen, haC, TMA1, TMA1a, TMA1b, TMA1c, TMA2, TMA2a, TMA2b, TMA2c, ZLHA, TMA_ZLHA, TMA_ZLHA_a, TMA_ZLHA_b, TMA_ZLHA_c, percb, Upercb, Lpercb, Line50. All IPVs are of type “Series” with “Block” scope and a default value of -1, except for percb, Upercb, Lpercb, Line50 (scope: “System,” plot on graph area: “SVE_BBPct_b”).
- Define the indicator calculations in the “Update Indicators” script of the block:
TRADING BLOX CODE

'Trader's Tips May 2010
'Smoothed Bollinger %b Indicator by Sylvain Vervoort
'Code by Jez Liberty - Au.Tra.Sy
'jez@automated-trading-system.com
'https://www.automated-trading-system.com/

'Calculate heikin-ashin Open (priming it with (O+H+l+C)/4 from day before
if haOpen = -1 then
	haOpen = (instrument.Open[1] + instrument.High[1] + instrument.Low[1] + instrument.Close[1]) / 4
else
	haOpen = ((instrument.Open[1] + instrument.High[1] + instrument.Low[1] + instrument.Close[1]) / 4 + haOpen[1]) / 2
endif

'Calculate heikin-ashin Close
haC = ((instrument.Open + instrument.High + instrument.Low + instrument.Close) / 4 + haOpen + Max(instrument.High, haOpen)
 + Min(instrument.Low, haOpen))/4

'Calculate the TMA1 Triple Moving Average of haC (in steps)
TMA1a = EMA(TMA1a[1],TeAv,haC) 'step1 = EMA
TMA1b = EMA(TMA1b[1],TeAv,TMA1a) 'step 2 = EMA(EMA)
TMA1c = EMA(TMA1c[1],TeAv,TMA1b) 'step 3 = EMA(EMA(EMA)))
TMA1 = 3*TMA1a - 3*TMA1b + TMA1c 'finally the Triple Moving Average

'Calculate the TMA2 Triple Moving Average of TMA1 (in steps)
TMA2a = EMA(TMA2a[1],TeAv,TMA1) 'step1 = EMA
TMA2b = EMA(TMA2b[1],TeAv,TMA2a) 'step 2 = EMA(EMA)
TMA2c = EMA(TMA2c[1],TeAv,TMA2b) 'step 3 = EMA(EMA(EMA)))
TMA2 = 3*TMA2a - 3*TMA2b + TMA2c 'finally the Triple Moving Average

'Calculate Zero Lag Average
ZLHA = 2*TMA1 - TMA2

'Calculate the Triple Moving Average of ZLHA (in steps)
TMA_ZLHA_a = EMA(TMA_ZLHA_a[1],TeAv,ZLHA) 'step1 = EMA
TMA_ZLHA_b = EMA(TMA_ZLHA_b[1],TeAv,TMA_ZLHA_a) 'step 2 = EMA(EMA)
TMA_ZLHA_c = EMA(TMA_ZLHA_c[1],TeAv,TMA_ZLHA_b) 'step 3 = EMA(EMA(EMA)))
TMA_ZLHA = 3*TMA_ZLHA_a - 3*TMA_ZLHA_b + TMA_ZLHA_c 'finally the Triple Moving Average

if Instrument.CurrentBar >= period+4*TeAv then
	'Calculate Weighted Average of the Triple Moving Average of the Zero Lag Average
	VARIABLES: WMA TYPE: Floating
	VARIABLES: i TYPE: Integer
	WMA = 0
	For i = 0 to period - 1
	    WMA = WMA + (period - i) * TMA_ZLHA[i]
	Next
	WMA = WMA / (period * (period + 1) / 2)

	'Calculate percb
	VARIABLES: StdDev TYPE: Floating
	StdDev = StandardDeviation(TMA_ZLHA,period)
	percb = 100 * (TMA_ZLHA + 2 * StdDev - WMA) / (4 * StdDev)
endif

if Instrument.CurrentBar >= afwper+period+4*TeAv then
	'Calculate upper and lower limits
	VARIABLES: StdDev2 TYPE: Floating
	StdDev2 = StandardDeviation(percb,afwper)
	Upercb = 50 + afwh * StdDev2
	Lpercb = 50 - afwl * StdDev2
endif
This code can be downloaded from https://www.automated-trading-system.com/free-code/. Figure 17 shows an example of the indicator applied to a price series in Trading Blox.
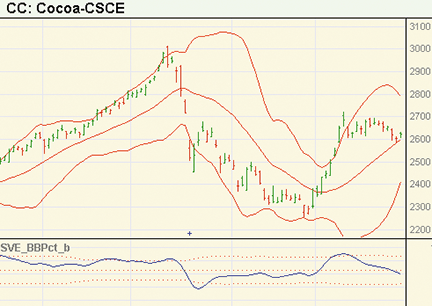
FIGURE 17: TRADING BLOX, the Sve_BB%b indicator. Here, divergence is shown by the smoothed %b indicator.
![]() VT TRADER: SVE_BB%b INDICATOR
VT TRADER: SVE_BB%b INDICATOR
We’ll be offering the SVE_BB%b indicator, based on Sylvain Vervoort’s article in this issue, “Smoothing The Bollinger %b,” for download in our online forums.
The VT Trader code and instructions for recreating the indicator are as follows:
- VT Trader’s Ribbon → Technical Analysis menu → Indicators group → Indicators Builder → [New] button
- In the General tab, type the following text into each corresponding text box:
Name: TASC - 05/2010 - SVE Bollinger Percent B (%b)
Function Name Alias: tasc_SvePercentB
Label Mask: TASC - 05/2010 - SVE Bollinger %%b (%period%,%TeAv%,%afwh%,%afwl%,%afwper%)
SVE %%b = %percb%, UB = %UB%, LB = %LB%
Placement: New Frame
Data Inspection Alias: SVE Bollinger %b
- In the Input Variable(s) tab, create the following variables:
[New] button...
Name: period
Display Name: Bollinger %b Periods
Type: integer
Default: 18

[New] button...
Name: TeAv
Display Name: TEMA Periods
Type: integer
Default: 8

[New] button...
Name: afwh
Display Name: Upper Band Std. Deviations
Type: float
Default: 1.6

[New] button...
Name: afwl
Display Name: Lower Band Std. Deviations
Type: float
Default: 1.6

[New] button...
Name: afwper
Display Name: Std. Deviations Periods
Type: integer
Default: 63
- In the Output Variable(s) tab, create the following variables:
[New] button...
Var Name: percb
Name: (SVE %b)
Line Color: dark blue
Line Width: thin
Line Type: solid

[New] button...
Var Name: UB
Name: (SVE %b Upper Band)
Line Color: red
Line Width: thin
Line Type: dashed

[New] button...
Var Name: LB
Name: (SVE %b Lower Band)
Line Color: red
Line Width: thin
Line Type: dashed
- In the Horizontal Line tab, create the following horizontal lines:
[New] button...
Value: +50.0000
Line Color: red
Line Width: thin
Line Type: big-small dashs
- In the Formula tab, copy and paste the following formula:
{Provided By: Capital Market Services, LLC & Visual Trading Systems, LLC} {Copyright: 2010} {Description: TASC, May 2010 - “Smoothing the Bollinger %b” by Sylvain Vervoort} {File: tasc_SvePercentB.vtscr - Version 1.0} TMA1:= vt_Tema(haC,TeAv,E); TMA2:= vt_Tema(TMA1,TeAv,E); Diff:= TMA1-TMA2; ZlHA:= TMA1+Diff; percb:= (vt_Tema(ZLHA,TeAv,E)+2*StDev(vt_Tema(ZLHA,TeAv,E),period)-Mov(vt_Tema(ZLHA,TeAv,E),period,W)) /(4*StDev(vt_Tema(ZLHA,TeAv,E),period))*100; UB:= 50+afwh*StDev(percb,afwper); LB:= 50-afwl*StDev(percb,afwper); - Click the “Save” icon in the toolbar to finish building the SVE_BB%b indicator.
To attach the indicator to a chart, click the right mouse button within the chart window and then select “Add Indicator” → “TASC – 05/2010 – SVE Bollinger Percent B (%b)” from the indicator list.
See Figure 18 for a sample chart.
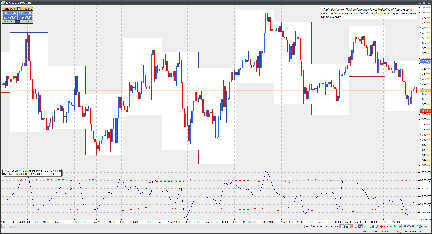
FIGURE 18: VT TRADER. The EMD indicator is shown here on a EUR/USD one-hour candle chart.
To learn more about VT Trader, please visit www.cmsfx.com.
Risk disclaimer: Past performance is not indicative of future results. Forex trading involves a substantial risk of loss and may not be suitable for all investors.
![]() METASTOCK: SVE_BB%b INDICATOR — VERVOORT ARTICLE CODE
METASTOCK: SVE_BB%b INDICATOR — VERVOORT ARTICLE CODE
Metastock code from Sylvain Vervoort’s article in this issue, “Smoothing The Bollinger %b.”
period:=Input("%b period: ",1,100,18);
TeAv:=Input("Tema average: ",1,30,8);
afwh:= Input("Standard deviation high ",.1,5,1.6);
afwl:= Input("Standard deviation Low ",.1,5,1.6);
afwper:= Input("Standard deviation period ",1,200,63);
haOpen:=(Ref((O+H+L+C)/4,-1) + PREV)/2;
haC:=((O+H+L+C)/4+haOpen+Max(H,haOpen)+Min(L,haOpen))/4;
TMA1:= Tema(haC,TeAv);
TMA2:= Tema(TMA1,TeAv);
Diff:= TMA1 - TMA2;
ZlHA:= TMA1 + Diff;
percb:=(Tema(ZLHA,TeAv)+2*Stdev(Tema(ZLHA,TeAv),period)-Mov(Tema(ZLHA,TeAv),period,WEIGHTED))/(4*Stdev
(Tema(ZLHA,TeAv),period))*100;
percb;
50+afwh*Stdev(percb,afwper);
50-afwl*Stdev(percb,afwper);
50