AT THE CLOSE
The 200-Day Moving Average
Can a simple and popular strategy such as the 200-day moving average crossover outperform a buy & hold strategy?
“The trend is your friend” is one of the first rules in trading. Given the big moves in commodities in 2009, I wouldn’t be surprised to discover that a lot of trend-following systems had a good year. One trend-following strategy that is followed by many technicians is the 200-day moving average crossover strategy. That is when you would go long when the tradable in question is above its n-day moving average and either move to cash or go short when it is below the average. Given that hardly a day goes by without an analyst mentioning the market’s position relative to its 200-day moving average, I thought it would be worth the effort to restudy the significance, or lack thereof, for not only the 200-day moving average, but other moving average trend-following system lengths as well.
Test approach
I evaluated the 50‑, 100‑, 150‑, 200‑, 250‑, 300‑, and 350‑day moving average crossover strategies (prices crossing the MA) for the following Standard & Poor’s 500 strategy:
- I analyzed data for the 40 years between 1970 and 2009. Moving averages in 1969 were calculated to initialize the first day’s trade.
- If you are short, go long the S&P 500 cash index at the close of that business day when the S&P 500 closes 1% above the n-day moving average. Since this is a long-term trading system, the 1% filter is used to avoid annoying day-to-day whipsaws on penny moves.
- If you are long, cover and go short the S&P 500 when the S&P 500 closes 1% below its moving average.
- Evaluate the performance in terms of average annual percentage return.
Summary of results
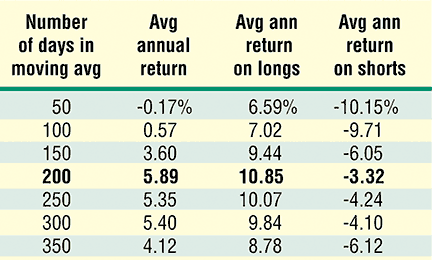
As a point of comparison, the average annual returns for a buy & hold strategy over this 40-year time period was 8%. With dividends included, the return would be 11.5%. A summary of the results of the moving average crossover study can be seen in Figure 1.

Figure 1: SUMMARY OF MOVING AVERAGE CROSSOVER STRATEGY
Observations
- The 200-day moving average crossover rule is the most profitable of the seven moving averages (50, 100, 150, 200, 250, 300, 350) studied for the 40-year time period selected on the S&P 500. This may explain the popularity of the 200-day moving average.
- None of the moving average strategies were profitable on the short side. This is because the S&P 500 has a positive bias during this time frame.
- None of the moving average strategies yielded more than the 11.5% return obtained with the buy & hold plus dividends strategy.
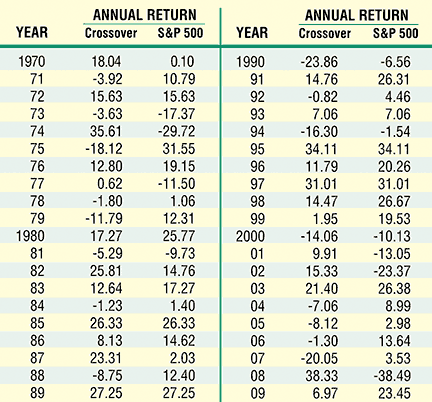
The annual returns for the 200-day moving average strategy are displayed in Figure 2. The results of the crossover signal are displayed in Figure 3.

Figure 2: ANNUAL RETURNS FOR 200-DAY MOVING AVERAGE CROSSOVER STRATEGY

FIGURE 3: RESULTS OF CROSSOVER SIGNALS
Going to T-bills on short signals
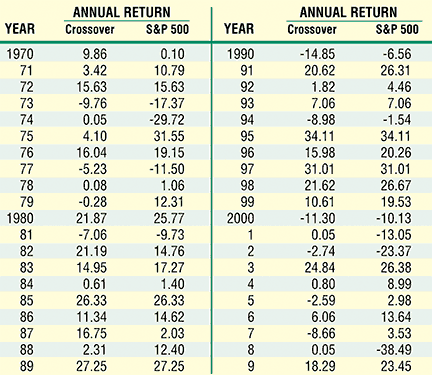
Since the short signals were counterproductive, I ran one derivation of the previously mentioned study for the 200-day model, where you go long the S&P on the up crossover, but go into that day’s prevailing three-month Treasury bill on the short side. That strategy resulted in an average 9.2% annual return (Figure 4), which is still less than the return of a buy & hold plus dividend strategy.

FIGURE 4: ANNUAL RETURNS FOR 200-DAY MOVING AVERAGE CROSSOVER STRATEGY USING T-BILLS ON SHORT SIGNALS
Although the T-bill strategy on the short side was still less than the return of the buy & hold, it would have a better risk-adjusted performance, as it spent a third of the time with no exposure to the volatility of stocks. This will reduce its beta, reduce drawdowns, and make its Sharpe ratio more attractive. Note that the worst year for this trading strategy was 1990 with a 14.9% loss. A passive buy & hold strategy would have resulted in four years with worse performance than ‑14.9 and, as you should recall, a 38.5% loss in 2009.
Conclusion
When measured solely on total return, the 200-day moving average crossover trading strategy has some utility as a trend-following system, but its total return (9.2%) is comparable to the return of the S&P (8%) over this time period and actually under the S&P buy & hold plus dividends (11.5%) return.
This particular trend-following system has some utility in a long-term trading model but is not the net total solution to trend following and should only be used in combination with other forecasting tools.