CHARTING
Using Six Sigma Standards
Short-Term Profits With Gap Trading
Mispriced stocks are often caused by gaps, which you can take advantage of by applying a strategy that generates above-average returns while reducing your risk. Check it out.
A convergence trading strategy is based on the theory that when the price of a stock or stock portfolio significantly deviates from its long-term trend, it will return to its original trend sooner or later. Normally, convergence trades tend to move prices toward their long-term equilibrium values and, thereby, stabilize markets. However, some research suggests that if convergence trades are “unwound” prematurely, asset prices would tend to diverge further from their equilibrium values instead of converging. Convergence traders with logarithmic utility functions could trade in ways that stabilize markets but will amplify market shocks if the shocks are large enough to severely deplete their capital.
Additional research also shows that asset prices converge more slowly to their fundamental levels when the traders’ capital has been impaired by trading losses. Not only that, if stocks are underpriced, abnormal returns can be generated over a three-year period as arbitrageurs act to eliminate the inconsistency in stock price.
So how can traders use this?
Lean Six Sigma
I applied a Lean Six Sigma (Lss) approach for the definition and analysis of this work. While Lss tools and techniques are typically used to improve industrial and service processes, I utilized the tools to improve a stock trading plan based on the hypothesis that gapping stocks will eventually converge to some normal trading range.
Over a period of six months, I gathered data on a sample of 129 stocks that were predicted to gap up and a sample of 350 stocks that were predicted to gap down when the market next opened. The stocks gap up or down based on earnings guidance. When positive guidance is issued, the effect is almost always (93%) a gap up. In the case of negative guidance, there is usually a gap down. The stocks that gapped down were segmented into three distinct categories, while stocks that gapped up were categorized into seven distinct categories based on the types of patterns that they generated. In this article I will focus only on the stocks that were predicted to gap down.

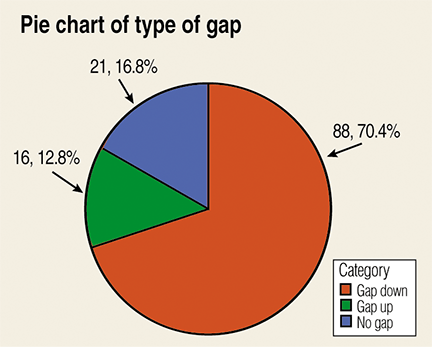
Figure 1: PIE CHARTS OF STOCKS PREDICTED TO GAP DOWN. Of all the stocks that were predicted to gap down, 70% of these actually did, while 13% of them gapped up and 17% showed no gap at all.
Define
Each day, dozens of stocks gap up or down as a result of some event. Gapping stocks create buying opportunities when there is either insufficient buying pressure to sustain the move up in price (a gap up) or a market realization that the stock has fallen to a periodic unprecedented low point (a gap down). The market’s reaction to these phenomena can be transformed into money-making opportunities by understanding the nature of the gap and the key variables driving the market reaction. In most cases when a gap occurs, either the fundamentals of the stock have shifted or the market’s psychology has created the gap.