TRADING SYSTEMS
On Trading Soybeans
A Seasonal System For Trading Soybean Futures
Here’s a system that exploits historical seasonal patterns to trade soybean futures.
Some markets are affected by certain fundamental factors that are seasonal in nature. These tend to recur at the same time each year, influencing the price trend of these markets. The commodity markets have always offered seasonal trading opportunities. Soybeans, corn, and heating oil are three examples of typical seasonal markets. In the case of grains, seasonality is defined by planting and harvest.
Seasonality
Normally, we can expect prices to be low during harvest when supply tends to be largest and higher during growing because supplies are not readily available and the new yield is still uncertain. From these seasonal patterns, we can derive a seasonal trading approach that is designed to anticipate and capture seasonal price trends.
The United States is the world’s biggest soybean exporter (38% of world production), followed by Brazil (25%) and Argentina (19%). In the US, most of the soybean crops are grown in the Midwest and the Mississippi Delta regions.
Typically, the southernmost areas will begin planting first in late April, followed by the northern states in the beginning of May. Harvest activity in the US usually starts in the third week of September, reaches a peak in October, and finishes in the beginning or mid-November, depending on the geographic latitude. The November contract is therefore the new crop, while the July contract, which has been sitting in storage since last year, is the old crop.
Calculating seasonal patterns or charts is not complicated; in essence, seasonal analysis is a statistical study of historical prices looking for these patterns. Some common mistakes, however, should be avoided. Continuous contract data cannot be used, as older data can be different than actual prices because of the back-adjusting effect of closing the gaps. Individual contract months, on the other hand (for example, November soybean futures), are distorted by storage costs and can only be used for trading the contract that was used to calculate them.
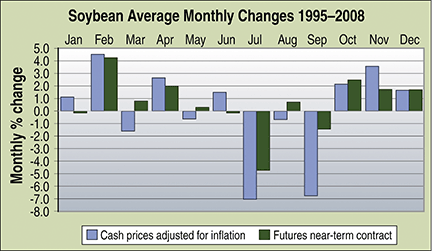
An accurate seasonal analysis for trading the most recent contract will have to use cash prices. In this case, cash prices will have to be adjusted for inflation. To help readers better visualize these seasonal patterns, I calculated and presented the average monthly percentage change for each calendar month since 1995 in Figure 1, using both cash prices and the futures near-term contract.

Figure 1: average monthly changes. Here are the average monthly changes of the nearest-term contract (in green) and cash prices adjusted for inflation for the 14-year period from 1995 to 2008.