TRADERS’ TIPS
September 2009
Here is this month’s selection of Traders’ Tips, contributed by various developers of technical analysis software to help readers more easily implement some of the strategies presented in this and other issues.
Other code appearing in articles in this issue is posted in the Subscriber Area of our website at https://technical.traders.com/sub/sublogin.asp. Login requires your last name and subscription number (from mailing label). Once logged in, scroll down to beneath the “Optimized trading systems” area until you see “Code from articles.” From there, code can be copied and pasted into the appropriate technical analysis program so that no retyping of code is required for subscribers.
You can copy these formulas and programs for easy use in your spreadsheet or analysis software. Simply “select” the desired text by highlighting as you would in any word processing program, then use your standard key command for copy or choose “copy” from the browser menu. The copied text can then be “pasted” into any open spreadsheet or other software by selecting an insertion point and executing a paste command. By toggling back and forth between an application window and the open web page, data can be transferred with ease.
This month’s tips include formulas and programs for:
- TRADESTATION: PIVOT DETECTOR OSCILLATOR, SIMPLIFIED
- eSIGNAL: PIVOT DETECTOR OSCILLATOR, SIMPLIFIED
- WEALTH-LAB: PIVOT DETECTION OSCILLATOR
- AMIBROKER: RSI-BASED OSCILLATOR
- NEUROSHELL TRADER: PIVOT DETECTOR OSCILLATOR
- AIQ: PIVOT DETECTOR OSCILLATOR
- TRADERSSTUDIO: PID OSCILLATOR
- STRATASEARCH: THE PIVOT DETECTOR OSCILLATOR
- TRADINGSOLUTIONS: THE PIVOT DETECTOR OSCILLATOR
- TRADECISION: PIVOT DETECTOR OSCILLATOR
- NINJATRADER: PIVOT DETECTOR OSCILLATOR
- WAVE59: PIVOT DETECTOR OSCILLATOR
- VT TRADER: PIVOT DETECTION OSCILLATOR
- TRADE IDEAS: PIVOT POINTS
- METASTOCK: PIVOT DETECTOR OSCILLATOR, SIMPLIFIED (Siligardos Article Code)
![]() TRADESTATION: PIVOT DETECTOR OSCILLATOR, SIMPLIFIED
TRADESTATION: PIVOT DETECTOR OSCILLATOR, SIMPLIFIED
Giorgos Siligardos’ article in the July 2009 Stocks & Commodities, “The Pivot Detector Oscillator, Simplified,” describes a technique for entry and exit of long positions using two pairs of Rsi values. One Rsi pair is used when price is above the 200-day moving average and another when it is below that average.
Siligardos’ July 2009 article also describes an indicator. The indicator transforms the Rsi based on the relationship between price and the 200-day average.
Code for both the strategy and the indicator are presented here. The strategy’s parameters have been implemented as user inputs to make optimization convenient.
Indicator:  PID
inputs:
	Price( Close ),
	RSILength( 14 ),
	AverageLength( 200 ),
	UpTrendEntry( 35 ),
	UpTrendExit( 85 ),
	DownTrendEntry( 20 ),
	DownTrendExit( 70 ) ;

variables:
	RSIValue( 0 ),
	SMAValue( 0 ),
	PID( 0 ) ;

RSIValue = RSI( Price, RSILength ) ;
SMAValue = Average( Price, AverageLength ) ;

if Price > SMAValue then
	PID = ( RSIValue - UpTrendEntry ) /
	 ( UpTrendExit - UpTrendEntry ) * 100
else
	PID = ( RSIValue - DownTrendEntry ) /
	 ( DownTrendExit - DownTrendEntry ) * 100 ;

Plot1( PID, "PID" ) ;


Strategy:  PID Trader
inputs:
	Price( Close ),
	RSILength( 14 ),
	AverageLength( 200 ),
	UpTrendEntry( 35 ),
	UpTrendExit( 85 ),
	DownTrendEntry( 20 ),
	DownTrendExit( 70 ) ;

variables:
	RSIValue( 0 ),
	SMAValue( 0 ) ;

RSIValue = RSI( Price, RSILength ) ;
SMAValue = Average( Price, AverageLength ) ;

if Close > SMAValue then
	begin
	if RSIValue crosses over UpTrendEntry then
		Buy ( "UpTrendBuy" ) next bar market
	else if RSIValue crosses under UpTrendExit then
		Sell ( "UpTrendSell" ) next bar at market ;
	end
else
	begin
	if RSIValue crosses over DownTrendEntry then
		Buy ( "DownTrendBuy" ) next bar market
	else if RSIValue crosses under DownTrendExit then
		Sell ( "DownTrendSell" ) next bar at market ;
	end ;
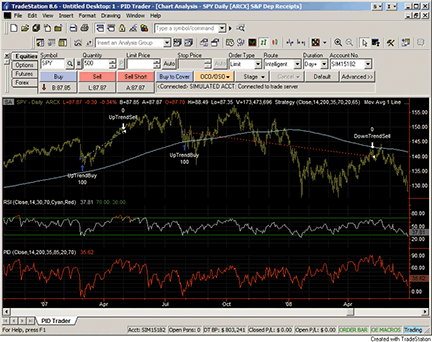
FIGURE 1: TRADESTATION, PID STRATEGY. Shown here is an example of Siligardos’ PID strategy and indicator displayed on a chart of SPY. The strategy arrows in the upper subgraph are generated by the strategy code. The standard RSI is plotted in the middle subgraph. The PID indicator is plotted in the lower subgraph.
To download the EasyLanguage code for this study, go to the TradeStation and EasyLanguage Support Forum (https://www.tradestation.com/Discussions/forum.aspx?Forum_ID=213). Search for the file “Pid Trader.eld.”
This article is for informational purposes. No type of trading or investment recommendation, advice or strategy is being made, given or in any manner provided by TradeStation Securities or its affiliates.
![]() eSIGNAL: PIVOT DETECTOR OSCILLATOR, SIMPLIFIED
eSIGNAL: PIVOT DETECTOR OSCILLATOR, SIMPLIFIED
For this month’s Traders’ Tip, we’ve provided two formulas, “Pidosc.efs” and “PidoscArrows.efs,” based on the formula code from Giorgos Siligardos’ article in the July 2009 S&C, “The Pivot Detector Oscillator, Simplified.”
Both formulas contain the same parameters that may be configured through the Edit Studies option to change the MA, Rsi, upper, lower, and middle bands period lengths. The PidoscArrows.efs is the same study as Pidosc.efs, but it plots on the price pane and draws the corresponding arrows above/below the price bars where the Pid oscillator crosses the upper and lower bands (Figure 2).
PIDosc.efs code

    /*********************************
    Provided By:
        eSignal (Copyright c eSignal), a division of Interactive Data
        Corporation. 2009. All rights reserved. This sample eSignal
        Formula Script (EFS) is for educational purposes only and may be
        modified and saved under a new file name.  eSignal is not responsible
        for the functionality once modified.  eSignal reserves the right
        to modify and overwrite this EFS file with each new release.

    Description:
        The Pivot Detector Oscillator, by Giorgos E. Siligardos

    Version:            1.0  07/07/2009

    Formula Parameters:                     Default:
        MA Length                           200
        RSI Length                          14
        Upper Band                          100
        Lower Band                          0
        Midlle Band                         50

    Notes:
        The related article is copyrighted material. If you are not a subscriber
        of Stocks & Commodities, please visit www.traders.com.

    **********************************/
    var fpArray = new Array();
    var bInit = false;
    var bVersion = null;

    function preMain() {
        setPriceStudy(false);
        setShowCursorLabel(true);
        setShowTitleParameters(false);
        setStudyTitle("Pivot Detector Oscillator");
        setCursorLabelName("PID oscillator", 0);
        setDefaultBarFgColor(Color.blue, 0);
        setPlotType(PLOTTYPE_LINE, 0);
        setDefaultBarThickness(2, 0);
        setStudyMax(130);
        setStudyMin(-30);
        askForInput();
        var x=0;
        fpArray[x] = new FunctionParameter("Length_MA", FunctionParameter.NUMBER);
        with(fpArray[x++]){
            setName("MA Length");
            setLowerLimit(1);
            setDefault(200);
        }
        fpArray[x] = new FunctionParameter("Length_RSI", FunctionParameter.NUMBER);
        with(fpArray[x++]){
            setName("RSI Length");
            setLowerLimit(1);
            setDefault(14);
        }
        fpArray[x] = new FunctionParameter("UpBand", FunctionParameter.NUMBER);
        with(fpArray[x++]){
            setName("Upper Band");
            setLowerLimit(0);
            setDefault(100);
        }
        fpArray[x] = new FunctionParameter("DnBand", FunctionParameter.NUMBER);
        with(fpArray[x++]){
            setName("Lower Band");
            setLowerLimit(-31);
            setDefault(0);
        }
        fpArray[x] = new FunctionParameter("MidlleBand", FunctionParameter.NUMBER);
        with(fpArray[x++]){
            setName("Midlle Band");
            setLowerLimit(0);
            setDefault(50);
        }
    }

    var xPIDosc = null;


    function main(Length_MA, Length_RSI, UpBand, DnBand, MidlleBand) {
    var nBarState = getBarState();
    var nPIDosc = 0;
        if (bVersion == null) bVersion = verify();
        if (bVersion == false) return;
        if (nBarState == BARSTATE_ALLBARS) {
            if (Length_MA == null) Length_MA = 200;
            if (Length_RSI == null) Length_RSI = 14;
            if (UpBand == null) UpBand = 100;
            if (DnBand == null) DnBand = 0;
            if (MidlleBand == null) MidlleBand = 50;
        }
        if (!bInit) {
            addBand(UpBand, PS_SOLID, 1, Color.red, "Upper");
            addBand(DnBand, PS_SOLID, 1, Color.green, "Lower");
            addBand(MidlleBand, PS_SOLID, 1, Color.black, "Midlle");
            xPIDosc = efsInternal("PIDosc", Length_MA, Length_RSI);
            bInit = true;
        }
        nPIDosc = xPIDosc.getValue(0);
        if (nPIDosc == null) return;
        return nPIDosc;
    }

    var bSecondInit = false;
    var xMA = null;
    var xRSI = null;

    function PIDosc(Length_MA, Length_RSI) {
    var nRes = 0;
    var nMA = 0;
    var nRSI = 0;
    var nClose = close(0);
        if (!bSecondInit) {
            xMA = sma(Length_MA);
            xRSI = rsi(Length_RSI);
            bSecondInit = true;
        }
        nMA = xMA.getValue(0);
        nRSI = xRSI.getValue(0);
        if (nMA == null || nRSI == null) return;
        if (nClose > nMA) {
            nRes = (nRSI - 35) / (85 - 35);
        }
        if (nClose <= nMA) {
            nRes = (nRSI - 20) / (70 - 20);
        }
        return nRes * 100;
    }

    function verify() {
        var b = false;
        if (getBuildNumber() < 779) {
            drawTextAbsolute(5, 35, "This study requires version 8.0 or later.",
                Color.white, Color.blue, Text.RELATIVETOBOTTOM|Text.RELATIVETOLEFT|Text.BOLD|Text.LEFT,
                null, 13, "error");
            drawTextAbsolute(5, 20, "Click HERE to upgrade.@URL=https://www.esignal.com/download/default.asp",
                Color.white, Color.blue, Text.RELATIVETOBOTTOM|Text.RELATIVETOLEFT|Text.BOLD|Text.LEFT,
                null, 13, "upgrade");
            return b;
        } else {
            b = true;
        }
        return b;
    }


    PIDoscArrows.efs code

    /*********************************
    Provided By:
        eSignal (Copyright c eSignal), a division of Interactive Data
        Corporation. 2009. All rights reserved. This sample eSignal
        Formula Script (EFS) is for educational purposes only and may be
        modified and saved under a new file name.  eSignal is not responsible
        for the functionality once modified.  eSignal reserves the right
        to modify and overwrite this EFS file with each new release.

    Description:
        The Pivot Detector Oscillator, by Giorgos E. Siligardos

    Version:            1.0  07/07/2009

    Formula Parameters:                     Default:
        MA Length                           200
        RSI Length                          14
        Upper Band                          100
        Lower Band                          0

    Notes:
        The related article is copyrighted material. If you are not a subscriber
        of Stocks & Commodities, please visit www.traders.com.

    **********************************/
    var fpArray = new Array();
    var bInit = false;
    var bVersion = null;

    function preMain() {
        setPriceStudy(true);
        setShowCursorLabel(false);
        setShowTitleParameters(false);
        setStudyTitle("Pivot Detector Oscillator Arrows");
        askForInput();
        var x=0;
        fpArray[x] = new FunctionParameter("Length_MA", FunctionParameter.NUMBER);
        with(fpArray[x++]){
            setName("MA Length");
            setLowerLimit(1);
            setDefault(200);
        }
        fpArray[x] = new FunctionParameter("Length_RSI", FunctionParameter.NUMBER);
        with(fpArray[x++]){
            setName("RSI Length");
            setLowerLimit(1);
            setDefault(14);
        }
        fpArray[x] = new FunctionParameter("UpBand", FunctionParameter.NUMBER);
        with(fpArray[x++]){
            setName("Upper Band");
            setLowerLimit(0);
            setDefault(100);
        }
        fpArray[x] = new FunctionParameter("DnBand", FunctionParameter.NUMBER);
        with(fpArray[x++]){
            setName("Lower Band");
            setLowerLimit(-31);
            setDefault(0);
        }
    }

    var xPIDosc = null;

    function main(Length_MA, Length_RSI, UpBand, DnBand) {
    var nBarState = getBarState();
    var nPIDosc = 0;
    var nPIDosc1 = 0;
        if (bVersion == null) bVersion = verify();
        if (bVersion == false) return;
        if (nBarState == BARSTATE_ALLBARS) {
            if (Length_MA == null) Length_MA = 200;
            if (Length_RSI == null) Length_RSI = 14;
            if (UpBand == null) UpBand = 100;
            if (DnBand == null) DnBand = 0;
        }
        if (!bInit) {
            xPIDosc = efsInternal("PIDosc", Length_MA, Length_RSI);
            bInit = true;
        }
        nPIDosc = xPIDosc.getValue(0);
        nPIDosc1 = xPIDosc.getValue(-1);
        if (nPIDosc1 == null) return;
        if (nPIDosc > DnBand && nPIDosc1 < DnBand ) {
            drawShape(Shape.UPARROW,  BelowBar2, Color.green);
        }
        if (nPIDosc < UpBand && nPIDosc1 > UpBand ) {
            drawShape(Shape.DOWNARROW,  AboveBar2, Color.red);
        }
        return;
    }

    var bSecondInit = false;
    var xMA = null;
    var xRSI = null;

    function PIDosc(Length_MA, Length_RSI) {
    var nRes = 0;
    var nMA = 0;
    var nRSI = 0;
    var nClose = close(0);
        if (!bSecondInit) {
            xMA = sma(Length_MA);
            xRSI = rsi(Length_RSI);
            bSecondInit = true;
        }
        nMA = xMA.getValue(0);
        nRSI = xRSI.getValue(0);
        if (nMA == null || nRSI == null) return;
        if (nClose > nMA) {
            nRes = (nRSI - 35) / (85 - 35);
        }
        if (nClose <= nMA) {
            nRes = (nRSI - 20) / (70 - 20);
        }
        return nRes * 100;
    }

    function verify() {
        var b = false;
        if (getBuildNumber() < 779) {
            drawTextAbsolute(5, 35, "This study requires version 8.0 or later.",
                Color.white, Color.blue, Text.RELATIVETOBOTTOM|Text.RELATIVETOLEFT|Text.BOLD|Text.LEFT,
                null, 13, "error");
            drawTextAbsolute(5, 20, "Click HERE to upgrade.@URL=https://www.esignal.com/download/default.asp",
                Color.white, Color.blue, Text.RELATIVETOBOTTOM|Text.RELATIVETOLEFT|Text.BOLD|Text.LEFT,
                null, 13, "upgrade");
            return b;
        } else {
            b = true;
        }
        return b;
    }
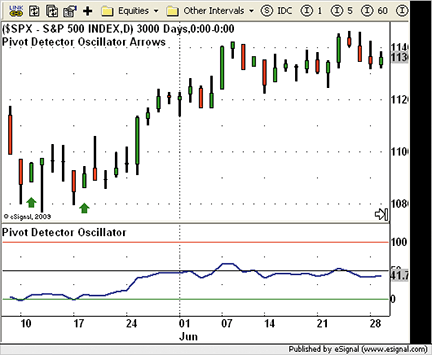
Figure 2: eSIGNAL, PID STRATEGY. The PIDoscArrows.efs is the same study as PIDosc.efs, but it plots on the price pane and draws the corresponding arrows above/below the price bars where the PID oscillator crosses the upper and lower bands.
To discuss this study or download complete copies of the formula code, please visit the Efs Library Discussion Board forum under the Forums link at www.esignalcentral.com or visit our Efs KnowledgeBase at www.esignalcentral.com/support/kb/efs/. The eSignal formula scripts (Efs) are also available for copying and pasting from the Stocks & Commodities website at Traders.com.
![]() WEALTH-LAB: PIVOT DETECTION OSCILLATOR
WEALTH-LAB: PIVOT DETECTION OSCILLATOR
Wealth-Lab version 5 code in C# for the Pid oscillator is provided here along with strategy parameter sliders for manual and programmed optimization. While traders should be conscious of overoptimization, Figure 3 shows that it can be useful to adjust the sensitivities of the Rsi and/or the moving average periods for particular instruments to obtain more Pdo signals. As mentioned in Giorgos Siligardos’ July 2009 S&C article, “The Pivot Detector Oscillator, Simplified,” the oscillator can be a good guide for use in an exit strategy — perhaps triggering logic to raise trailing profit stops.
    WealthScript Code (C#):
    /* Place the code within the namespace WealthLab.Strategies block */
    public class PIDOscillatorExpert : WealthScript
    {
       StrategyParameter rsiPeriod;
       StrategyParameter smaPeriod;

       public MyStrategy()
       {
          rsiPeriod = CreateParameter("RSI Period", 14, 10, 21, 1);
          smaPeriod = CreateParameter("SMA Period", 200, 50, 200, 10);
       }

       protected override void Execute()
       {
          Font font = new Font( "Wingdings 3", 14, FontStyle.Regular );
          string UpArrow = Convert.ToChar(0x0097).ToString();
          string DnArrow = Convert.ToChar(0x0098).ToString();

          DataSeries rsi = RSI.Series(Close, rsiPeriod.ValueInt);
          DataSeries sma = SMA.Series(Close, smaPeriod.ValueInt);

          // Create and plot the PID Oscillator
          DataSeries pidOsc = new DataSeries(Bars, "PDO(" + rsiPeriod.ValueInt + "," + smaPeriod.ValueInt + ")");
          for(int bar = smaPeriod.ValueInt; bar < Bars.Count; bar++)
          {
             pidOsc[bar] = Close[bar] > sma[bar] ? (rsi[bar]-35)/(85 - 35) : (rsi[bar]-20)/(70 - 20);
             pidOsc[bar] = 100 * pidOsc[bar];

             // Show the buy/sell advisories
             if( CrossOver(bar, pidOsc, 0) )
                AnnotateBar( UpArrow, bar, false, Color.Green, Color.Transparent, font );
             else if( CrossUnder(bar, pidOsc, 100) )
                AnnotateBar( DnArrow, bar, true, Color.Red, Color.Transparent, font );
          }

          // Plotting
          ChartPane rsiPane = CreatePane(40, true, true);
          PlotSeries(rsiPane, rsi, Color.Red, LineStyle.Dotted, 2);
          PlotSeries(PricePane, sma, Color.Blue, LineStyle.Solid, 2);
          PlotSeries(rsiPane, pidOsc, Color.Green, LineStyle.Solid, 2);
       }
    }
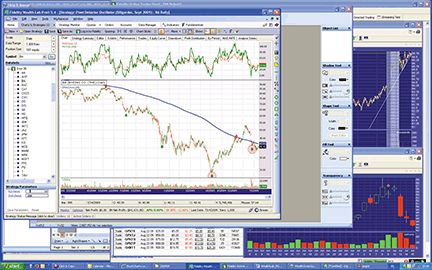
Figure 3: WEALTH-LAB, PID STRATEGY. The highlighted buy signals for Boeing were triggered for a 12-period but not for a 14-period RSI.
![]() AMIBROKER: RSI-BASED OSCILLATOR
AMIBROKER: RSI-BASED OSCILLATOR
In “The Pivot Detector Oscillator, Simplified” in the July 2009 S&C, Giorgos Siligardos presents a simple Rsi-based oscillator. Coding such an indicator is very straightforward. A ready-to-use formula for the article is presented in Listing 1. To use it, enter the formula in the Afl Editor, then select “Insert indicator.” The same formula can be also used in an automatic analysis to perform backtesting.
LISTING 1.
    function PIDosc()
    {
     sma200 = MA(C,200);
     bull = C >sma200;
     return IIf( bull, (RSI(14)-35)/(85-35), (RSI(14)-20)/(70-20) )*100;
    }

    pid = PIDOsc();

    Buy = Cross( pid, 0 );
    Sell = Cross( 100, pid );

    Plot( C, "Price", colorBlack, styleBar );

    PlotShapes( Buy * shapeUpArrow, colorBlue );
    PlotShapes( Sell * shapeDownArrow, colorRed );

Figure 4: amibroker, PID STRATEGY. Here is an example of PID buy (blue arrows) and sell (red arrows) signals generated from a daily chart of Bank of America.
A sample chart is shown in Figure 4.
![]() NEUROSHELL TRADER: PIVOT DETECTOR OSCILLATOR
NEUROSHELL TRADER: PIVOT DETECTOR OSCILLATOR
The pivot detector oscillator described by Giorgos Siligardos in his July 2009 S&C article, “The Pivot Detector Oscillator, Simplified,” can be easily implemented in NeuroShell Trader by combining a few of the NeuroShell Trader’s 800+ indicators. To recreate the pivot detector oscillator, select “New Indicator …” from the Insert menu and use the Indicator Wizard to create the following indicator:
    PIDocs:
    Multiply2 ( IfThenElse ( A>B( Close, MovAvg (Close,200) ), Divide ( Subtract ( RSI( Close,14), 35), 50), Divide( Subtract( RSI ( Close,14), 20), 50) ), 100 )
To set up a trading system based on the pivot detector oscillator, select “New Trading Strategy …” from the Insert menu and enter the following in the appropriate locations of the Trading Strategy Wizard:
    Long Entry when all of the following are true:
    CrossAbove (PIDosc, 0 )

    Short Entry when all of the following are true:
    CrossBelow ( PIDosc, 100 )
If you have NeuroShell Trader Professional, you can also choose whether the system parameters should be optimized. After backtesting the trading strategy, use the “Detailed Analysis …” button to view the backtest and trade-by-trade statistics for the system.
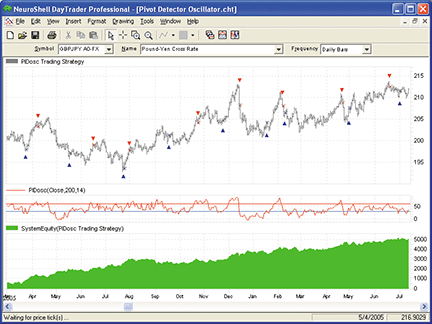
Figure 5: NEUROSHELL TRADER, PID STRATEGY. Here is the pivot detector oscillator shown on a chart of the pound/yen forex cross rate.
![]() AIQ: PIVOT DETECTOR OSCILLATOR
AIQ: PIVOT DETECTOR OSCILLATOR
The Aiq code is given here for the pivot detector oscillator indicator (Pid) from the article, “The Pivot Detector Oscillator, Simplified” by Giorgos Siligardos, published in the July 2009 issue of Stocks & Commodities.
The coded version that I have supplied includes two systems that can be used to test the indicator. The first system only uses the indicator and is always in the market. The second system only takes trades in the direction of the trend of the Spx as well as the stock being traded. The trend is determined by the same moving average that is used in the indicator to adjust the buy and sell levels. In other words, when the close is above the moving average, the trend is up and when below, the trend is down. In the second system I also added a maximum holding period of 80 bars.
    ! THE PIVOT DETECTOR OSCILLATOR
    ! Author: Giorgos E. Silgardos, TASC July 2009 (Aug 2009 Traders' Tips)
    ! Coded by: Richard Denning 7/10/09

    ! ABBREVIATIONS:
    C is [close].
    C1 is valresult(C,1).
    sma200 is simpleavg(C,200).
    sma50 is simpleavg(C,50).
    sma20 is simpleavg(C,20).
    PD is {position days}.
    PEP is {position entry price}.
    HD if hasdatafor(220)>=200.

    ! PID INDICATOR:
    PIDrsi  is iff(C>sma200,(rsi14-35)/50,(rsi14-20)/50)*100. ! PLOT
    overBot is iff(C>sma200,85,70).                           ! PLOT
    overSld is iff(C>sma200,35,20).		   		  ! PLOT

    ! SYSTEM TO TEST INDICATOR (AUTHOR'S VERSION):
    Buy if HD and PIDrsi > overSld and valrule(PIDrsi < overSld,1).
    Sell if HD and PIDrsi < overBot and valrule(PIDrsi > overBot,1).

    ! TREND FILTERED SYSTEM TO TEST INDICATOR:
    MktTmLong if tickerRule("SPX",C > sma200)
        and tickerRule("SPX",sma200 > valresult(sma200,1)).
    MktTmShort if tickerRule("SPX",C < sma200)
        and tickerRule("SPX",sma200 < valresult(sma200,1)).
    Buy2 if HD and MktTmLong and C > sma200
        and sma200 > valresult(sma200,1)
        and PIDrsi > overSld and valrule(PIDrsi < overSld,1).
    MaxBars is 80.
    ExitLongTmMkt if MktTmShort or C < sma200 or Sell or PD > maxBars.

    !! RSI WILDER
    ! Wilder Averaging to Exponential Averaging use this formula:
    ! ExponentialPeriods = 2 * WilderPeriod - 1.
        U 	is C - C1.
        D 	is C1 - C.
        W1	is 3.
        rsiLen1	is 2 * W1 - 1.
        AvgU 	is ExpAvg(iff(U>0,U,0),rsiLen1).
        AvgD 	is ExpAvg(iff(D>=0,D,0),rsiLen1).
        rsi3	is 100-(100/(1+(AvgU/AvgD))).

        W2	is 14.
        rsiLen2	is 2 * W2 - 1.
        AvgU2 	is ExpAvg(iff(U>0,U,0),rsiLen2).
        AvgD2 	is ExpAvg(iff(D>=0,D,0),rsiLen2).
        rsi14 	is 100-(100/(1+(AvgU2/AvgD2))).
To test the indicator, I used the Russell 1000 list of stocks over the period 12/31/1996 to 7/10/2009. In Figure 6, I show the equity curve and metrics of using the indicator for entering and exiting trades on the long side. Based on the very large drawdown of over 70% that occurred in 2008, it is clear that the indicator should not be used without additional filters and stops. In Figure 7, I show test results after adding trend directional filters for both the Spx to act as a market timing filter and also trend filters for the stock being traded. Both the returns and the drawdowns improved dramatically with these additions as now the average return has increased to 25% from 9.7% and the drawdown has decreased from 70% to less than 38%.
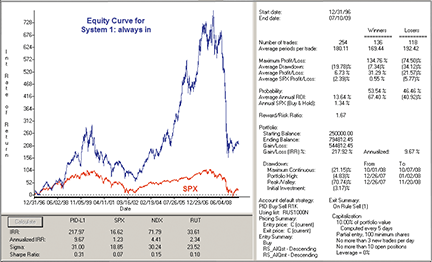
Figure 6: AIQ SYSTEMS, PID STRATEGY WITHOUT MARKET TIMING. This chart shows the equity curve (blue line) for the PID system, without market timing, and trading the Russell 1000 stocks, long only, for the period 12/31/1996 to 7/10/2009, compared to the S&P 500 (SPX) index (red line).
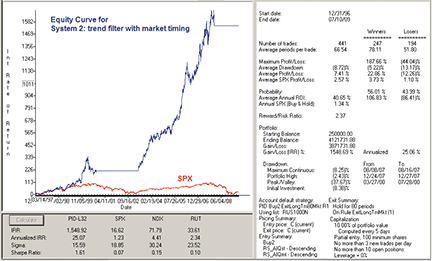
Figure 7: AIQ SYSTEMS, PID STRATEGY WITH MARKET TIMING. This chart shows the equity curve (blue line) for the PID system, with market timing, and trading the Russell 1000 stocks, long only, for the period 12/31/1996 to 7/10/2009, compared to the S&P 500 (SPX) index (red line).
This code can be downloaded from the Aiq website at www.aiqsystems.com and also from www.TradersEdgeSystems.com/traderstips.htm.
![]() TRADERSSTUDIO: PID OSCILLATOR
TRADERSSTUDIO: PID OSCILLATOR
The TradersStudio code for the pivot detector oscillator indicator (Pid) and the related functions from the July 2009 S&C article, “The Pivot Detector Oscillator, Simplified” by Giorgos Siligardos, is provided here.
The coded version that I have supplied includes two systems that can be used to test the indicator. The first system uses only the indicator and is always in the market. The second system only takes trades in the direction of the trend of the market being traded. The trend is determined by the same moving average that is used in the indicator to adjust the buy and sell levels. In other words, when the close is above the moving average, the trend is up, and when below, the trend is down. In the second system I also added a maximum holding period of 95 bars.
    ' THE PIVOT DETECTOR OSCILLATOR SYSTEM
    ' Author: Giorgos E. Silgardos, TASC July 2009 (Sep 2009 Traders' Tips)
    ' Coded by: Richard Denning 7/10/09

    sub PID_RSI_SYS(rsiLen, maLen, bullFactor, bearFactor, divisor, useTrendFilter, exitBars)
    ' default values: rsiLen=14, maLen=200, bullFactor=35, bearFactor=20, divisor=50,
    '                 useTrendFilter=1, exitBars=95
    Dim pidRSI, overBotLvl, overSoldLvl, bull

    pidRSI=PID_RSI(rsiLen,maLen,bullFactor,bearFactor,divisor,overBotLvl,overSoldLvl,bull)
    If useTrendFilter=0 Then
        If CrossesOver(pidRSI,overSoldLvl) Then Buy("LE_Bull",1,0,CloseEntry,Day)
        If CrossesUnder(pidRSI,overBotLvl) Then Sell("SE_Bear",1,0,CloseEntry,Day)
    End If
    If useTrendFilter=1 Then
        If bull=True And CrossesOver(pidRSI,overSoldLvl) Then Buy("LE_Bull",1,0,CloseEntry,Day)
        If CrossesUnder(pidRSI,overBotLvl) Then ExitLong("LX_Bull","",1,0,CloseExit,Day)
        If BarsSinceEntry > exitBars Then
            ExitLong("LX_Time","",1,0,CloseExit,Day)
            ExitShort("SX_Time","",1,0,CloseExit,Day)
        End If
        If bull=False And CrossesUnder(pidRSI,overBotLvl) Then Sell("SE_Bear",1,0,CloseEntry,Day)
        If CrossesOver(pidRSI,overSoldLvl) Then ExitShort("SX_Bear","",1,0,CloseExit,Day)
    End If
    End Sub

    --------------------------------------------------------------------------------------
    ' THE PIVOT DETECTOR OSCILLATOR FUNCTION
    ' Author: Giorgos E. Silgardos, TASC July 2009 (Sep 2009 Traders' Tips)
    ' Coded by: Richard Denning 7/10/09

    Function PID_RSI(rsiLen,maLen,bullFactor,bearFactor,divisor,ByRef overBotLvl,ByRef overSoldLvl,ByRef bull)
    'rsiLen = 14, maLen = 200, bullFactor = 35, bearFactor = 20, divisor = 50
    Dim sma As BarArray
    Dim rsiW As BarArray
    Dim pidRSI As BarArray

    sma = Average(C,maLen)
    rsiW = rsi(C,rsiLen,0)
    'bull = L > sma And L[1] > sma[1]
    bull = C > sma
    If divisor <> 0 Then
        pidRSI = IIF(bull,(rsiW-bullFactor)/divisor,(rsiW-bearFactor)/divisor)*100
    Else
        pidRSI = pidRSI[1]
    End If
    overBotLvl = IIF(bull, bullFactor + divisor, bearFactor + divisor)
    overSoldLvl = IIF(bull, bullFactor, bearFactor)
    PID_RSI = pidRSI
    End Function

    ----------------------------------------------------------------------------------------
    ' THE PIVOT DETECTOR OSCILLATOR INDICATOR
    ' Author: Giorgos E. Silgardos, TASC July 2009 (Sep 2009 Traders' Tips)
    ' Coded by: Richard Denning 7/10/09

    sub PID_RSI_IND(rsiLen, maLen, bullFactor, bearFactor, divisor)
    Dim pidRSI, overBotLvl, overSoldLvl, bull

    pidRSI=PID_RSI(rsiLen,maLen,bullFactor,bearFactor,divisor,overBotLvl,overSoldLvl,bull)
    plot1(pidRSI)
    plot2(overBotLvl)
    plot3(overSoldLvl)
    End Sub
    --------------------------------------------------------------------------------------
    ' THE PIVOT DETECTOR OSCILLATOR SYSTEM / RSI System (for comparison)
    ' Author: Giorgos E. Silgardos, TASC July 2009 (Sep 2009 Traders' Tips)
    ' Coded by: Richard Denning 7/10/09

    sub RSI_SYS(rsiLen, maLen, useTrendFilter, exitBars)
    Dim myRSI, overSoldLvl, overBotLvl, bull, sma
    overSoldLvl = 30
    overBotLvl = 70

    myRSI = rsi(C,rsiLen,0)
    sma = Average(C,maLen)
    bull = C > sma
    If useTrendFilter=0 Then
        If CrossesOver(myRSI,overSoldLvl) Then Buy("LE_Bull",1,0,CloseEntry,Day)
        If CrossesUnder(myRSI,overBotLvl) Then Sell("SE_Bear",1,0,CloseEntry,Day)
    End If
    If useTrendFilter=1 Then
        If bull=True And CrossesOver(myRSI,overSoldLvl) Then Buy("LE_Bull",1,0,CloseEntry,Day)
        If CrossesUnder(myRSI,overBotLvl) Then ExitLong("LX_Bull","",1,0,CloseExit,Day)
        If BarsSinceEntry > exitBars Then
            ExitLong("LX_Time","",1,0,CloseExit,Day)
            ExitShort("SX_Time","",1,0,CloseExit,Day)
        End If
        If bull=False And CrossesUnder(myRSI,overBotLvl) Then Sell("SE_Bear",1,0,CloseEntry,Day)
        If CrossesOver(myRSI,overSoldLvl) Then ExitShort("SX_Bear","",1,0,CloseExit,Day)
    End If
    CUSTOM_MarketBreakDownYR()
    End Sub
    --------------------------------------------------------------------------------------
To test the indicator, I created a portfolio of 38 of the more actively traded, full-sized futures contracts. I used back-adjusted data from Pinnacle Data (day session only) for the following symbols: AD, BO, BP, C, CC, CD, CL, CT, DJ, DX, ED, FA, FC, FX, GC, HG, HO, HU, JO, JY, KC, KW, LC, LH, NG, NK, PB, RB, S, SB, SF, SI, SM, SP, TA, TD, UA, W. I ran the portfolio from July 1998 to July 2009 with the author’s parameters using a system that is always in the market. I also ran the trend-filtered system on the same portfolio and the same time period. Of the 38 markets, 66% were profitable on both of the systems.
In Figure 8, I show the equity and underwater curves for this portfolio for both systems. Although the always-in system is robust, the drawdown is excessive. The trend-filtered system is somewhat better on both the total return and drawdown. Looking at the individual markets, the S&P contract has one of the best reward-to-risk ratios. In Figure 9, I show the equity curve for the S&P contract on the trend-filtered system together with the yearly return breakdown trading one contract. The total profit is $262,125 with a maximum drawdown of $63,340 and a 2.95 profit factor.
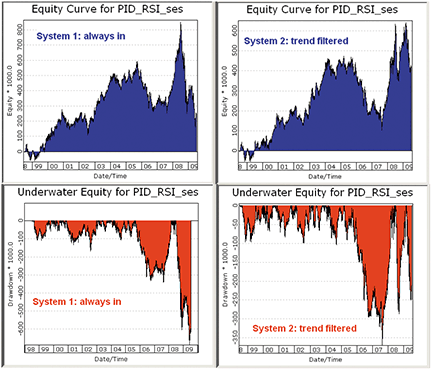
Figure 8: TRADERSSTUDIO, PID STRATEGY, SYSTEM COMPARISON. This shows the portfolio equity and underwater curves for system 1 and system 2.
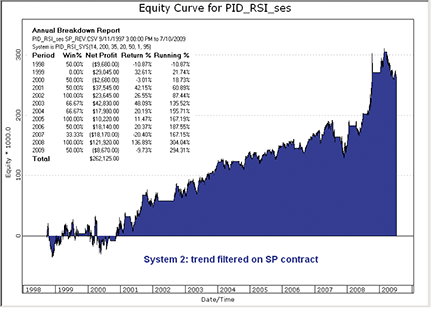
Figure 9: TRADERSSTUDIO, PID STRATEGY, WITH YEARLY RETURNS. This shows the equity curve and yearly breakdown for the S&P contract on system 2.
I also tested the Pid indicator against the original Rsi oscillator. System 1 (always in) using the Rsi alone showed a net loss of $574,750 with a maximum drawdown of $908,397. Clearly, the Pid indicator performed significantly better than the Rsi on the always-in system. For the trend-filtered system, the Rsi showed a net profit of $138,040 with a maximum drawdown of $167,460 and a profit factor of 1.33. This compares to a net profit of $402,223 with a maximum drawdown of $372,378 and a profit factor of 1.19 for the Pid trend-filtered system. Again, the Pid indicator appears to be an improvement over the classic Rsi.
The code can be downloaded from the TradersStudio website at www.TradersStudio.com⇒Traders Resources⇒FreeCode and also from www.TradersEdgeSystems.com/traderstips.htm.
![]() STRATASEARCH: THE PIVOT DETECTOR OSCILLATOR
STRATASEARCH: THE PIVOT DETECTOR OSCILLATOR
As author Giorgos Siligardos states in his July 2009 article in S&C, “The Pivot Detector Oscillator, Simplified,” the relative strength index (Rsi) has been a standard tool for technical analysts since its creation. Siligardos’ suggestion to adjust the buy and sell bands of the Rsi based on the current market conditions is an excellent one. A variety of tests show this to be a very helpful approach.
The pivot detector oscillator (Pid) isn’t intended to be a complete trading system, but allows the trader to benefit from the buy and sell signals independently as part of a larger set of indicators. With its automated search features, StrataSearch proved to be an ideal program to investigate this. A search was created to use the Pid as a starting point, with a variety of indicators tested alongside it. After exploring roughly 50,000 indicator combinations, the results were impressive. Many indicator combinations showed high annual returns, short holding periods, and a percentage of profitable trades exceeding 80%. A large number of these indicator combinations worked well against alternative sectors as well, confirming their robustness.
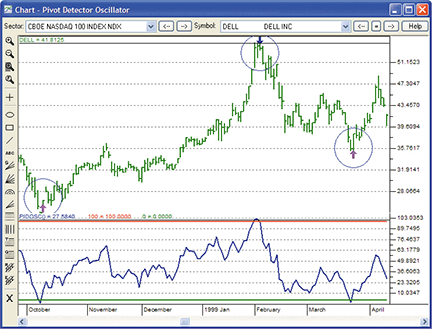
Figure 10: STRATASEARCH, The Pivot Detector Oscillator. The pivot detector oscillator often identifies the turnaround at exactly the right point.
As with all other Traders’ Tips, additional information, including plugins, can be found in the Shared Area of the StrataSearch User Forum. This month’s plugin allows StrataSearch users to quickly run this indicator in an automated search, seeking out supplemental indicators that can turn the pivot detector oscillator into a complete trading system.
//*********************************************************
    // Pivot Detector Oscillator
    //*********************************************************
    sma200=Mov(C,200,S);
    bull=if(C>sma200, 1, 0);
    PIDosc = if(bull,(RSI(14)-35)/(85-35), (RSI(14)-20)/(70-20))*100;
![]() TRADINGSOLUTIONS: THE PIVOT DETECTOR OSCILLATOR
TRADINGSOLUTIONS: THE PIVOT DETECTOR OSCILLATOR
In “The Pivot Detector Oscillator, Simplified” by Giorgos Siligardos in the July 2009 S&C, the author presents an extension to the Rsi. This function is coded here and is also available as a function file that can be downloaded from the TradingSolutions website (www.tradingsolutions.com) in the Free Systems section.
Function Name: Pivot Detector Oscillator
    Short Name: PIDOsc
    Inputs: Close
    Mult (If (GT (Close, MA (Close, 200)), Div (Sub (RSI (Close, 14), 35), Sub (85, 35)), Div (Sub (RSI (Close, 14), 20), Sub (70, 20))), 100)

    System Name: Pivot Detector Signals
    Inputs: Close
    Enter Long (when all true):
      1.	CrossAbove ( PIDOsc (Close), 0)
    Exit Long (when all true):
      1.	CrossBelow ( PIDOsc (Close), 100)
![]() TRADECISION: PIVOT DETECTOR OSCILLATOR
TRADECISION: PIVOT DETECTOR OSCILLATOR
Giorgos Siligardos’ article in the July 2009 S&C, “The Pivot Detector Oscillator, Simplified,” introduces a simplified version of the pivot detector (Pid) oscillator to improve your timing by leaps and bounds.
Use the Function Builder to recreate the Pidocs function; then, using the Indicator Builder, you can quickly write the corresponding indicator and plot it on a price chart (Figure 11).
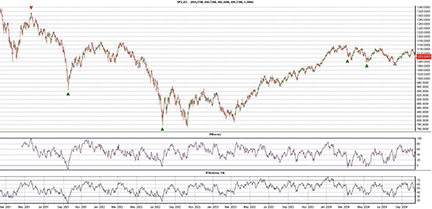
FIGURE 11: TRADECISION, RSI(14) VS. PID OSCILLATOR. Short and long signals are plotted on the S&P index.
Here is the code for Siligardos’s function and indicator, which can help define oversold and overbought instances more precisely than the Rsi.
    PIDocs Function:

    function (Length:Numeric = 14):Numeric;
     Var
     sma200:=0;
     bull:=false;
     End_var

     sma200:= Mov(C,200,S);
     bull:= C>sma200;

     return iff(bull, (RSI(C,Length) - 35) / (85 - 35), (RSI(C,Length) - 20) /
     (70 - 20)) * 100;

    PIDocs Indicator:

    return PIDocs(14);
For the creation of the Pidocs strategy, use the Strategy Builder:
    Entry Long Signal:

    return CrossAbove(PIDocs(14),0);

    Entry Short Signal:

    return CrossAbove(PIDocs(14),100);
To import the strategy into Tradecision, visit the area “Traders' Tips from TASC Magazine” at www.tradecision.com/support/tasc_tips/tasc_traders_tips.htm or copy the code from the Stocks & Commodities website at www.traders.com.
![]() NINJATRADER: PIVOT DETECTOR OSCILLATOR
NINJATRADER: PIVOT DETECTOR OSCILLATOR
The Pid oscillator as discussed in the July 2009 S&C article, “The Pivot Detector Oscillator, Simplified” by Giorgos Siligardos, has been implemented as an indicator and is available for download at www.ninjatrader.com/SC/September2009SC.zip.
Once it has been downloaded, from within the NinjaTrader Control Center window, select the menu File > Utilities > Import NinjaScript and select the downloaded file. This strategy is for NinjaTrader version 6.5 or greater.
You can review the strategy’s source code by selecting the menu Tools > Edit NinjaScript > Indicator from within the NinjaTrader Control Center window and selecting “Pidosc.”
NinjaScript indicators are compiled Dlls that run native, not interpreted, which provides you with the highest performance possible.
A sample chart implementing the strategy is shown in Figure 12.
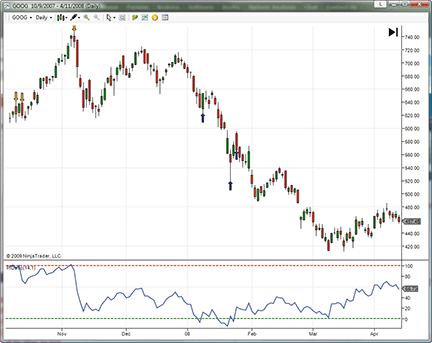
Figure 12: NINJATRADER, PID STRATEGY. This sample chart shows the PID oscillator applied to a daily chart of GOOG.
![]() WAVE59: PIVOT DETECTOR OSCILLATOR
WAVE59: PIVOT DETECTOR OSCILLATOR
In his July 2009 Stocks & Commodities article, “The Pivot Detector Oscillator, Simplified,” author Giorgos Siligardos discusses his Pid oscillator, which can be thought of as a trend-aware version of the Rsi.
Although Siligardos focuses primarily on daily charts in his article, we couldn’t resist trying this approach out on intraday markets as well, and we were impressed with the results. The chart in Figure 13 shows the Pid oscillator working on a one-minute chart of the Qqqq, and as can be seen, the signals should prove quite valuable for short-term traders.
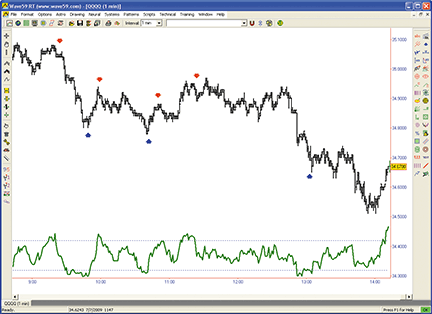
FIGURE 13: WAVE59, PID STRATEGY. The chart shows the PID oscillator on a one-minute chart of the QQQQ, and as can be seen, the signals should prove quite valuable for short-term traders.
The following script implements this indicator in Wave59. As always, users of Wave59 can download these scripts directly using the QScript Library found at https://www.wave59.com/library.
Indicator: SC_Siligardos_PID
    input:buy_thresh(0),sell_thresh(100),pid_color(red),pid_width(2),thresh_color(blue);

    sma = average(close,200);
    rsi = rsi(close,14);
    if (close > sma)
         pid = 100*((rsi-35)/(85-35));
    else
         pid = 100*((rsi-20)/(70-20));

    plot1 = pid;
    color1 = pid_color;
    thickness1 = pid_width;
    plot2 = buy_thresh;
    plot3 = sell_thresh;
    color2, color3 = thresh_color;
    style2, style3 = ps_dot;

    --------------------------------------------
![]() VT TRADER: PIVOT DETECTION OSCILLATOR
VT TRADER: PIVOT DETECTION OSCILLATOR
Our Traders’ Tip is inspired by the July 2009 S&C article, “The Pivot Detector Oscillator, Simplified” by Giorgos Siligardos. We’ll be offering the pivot detector oscillator for download in our online forums. The VT Trader code and instructions for recreating the indicator are as follows:
- Navigator Window>Tools>Indicator Builder> [New] button
- In the Indicator Bookmark, type the following text for
each field:
Name: TASC - 09/2009 - Pivot Detector Oscillator Short Name: tasc_PIDOsc Label Mask: TASC - 09/2009 - Pivot Detector Oscillator = %PID% Placement: New Frame Inspect Alias: Pivot Detector Osc. - In the Output Bookmark, create the following
variables:
[New] button... Var Name: PID Name: (PID) Line Color: black Line Width: slightly thicker Line Type: solid - In the Horizontal Line Bookmark, create the following
variables:
[New] button... Value: +0.0000 Color: red Width: thin Type: dashed [New] button... Value: +100.0000 Color: red Width: thin Type: dashed - In the Formula Bookmark, copy and paste the
following formula:
{Provided By: Capital Market Services, LLC & Visual Trading Systems, LLC} {Copyright: 2009} {Description: TASC, September 2009 - "The Pivot Detector Oscillator, Simplied" by Giorgos E. Siligardos} {File: tasc_PIDOsc.vtsrc - Version 1.0} TrendMA:= mov(C,200,S); RSIndex:= RSI(14); BullishMarket:= C>TrendMA; PID:= if(BullishMarket=1,(RSIndex-35)/(85-35),(RSIndex-20)/(70-20))*100; - Click the “Save” icon to finish building the pivot detector oscillator.
To attach the indicator to a chart, click the right mouse button within the chart window and then select “Add Indicator”>“TASC - 09/2009 - Pivot Detector Oscillator” from the indicator list.
See Figure 14 for a sample chart.
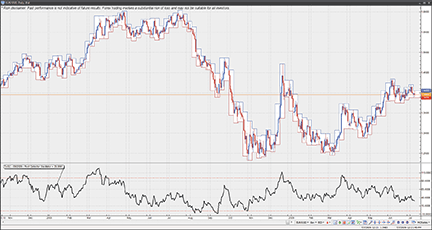
Figure 14: VT TRADER, Pivot Detector Oscillator. Here is the pivot detector oscillator on a EUR/USD daily candle chart.
To learn more about VT Trader, visit www.cmsfx.com.
Risk disclaimer: Forex trading involves a substantial risk of loss and may not be suitable for all investors.
![]() TRADE-IDEAS: PIVOT POINTS
TRADE-IDEAS: PIVOT POINTS
“Now, you listen to me! I want it reopened right now. Get those brokers back in here! Turn those machines back on!” —Mortimer Duke, Trading Places (1983)
This month’s Traders’ Tip concerns pivot points. While researching an appropriate strategy for this month, we discovered a stock-trading strategy based, in part, on Fibonacci values. We liked the results as reported by our event-based backtesting tool, The OddsMaker, so much that it’s the basis of this month’s strategy and our proxy for pivot points (which are not yet available in Trade-Ideas).
This month’s is a long strategy, but because it produced only 34 trades in the last 30 days, our recommendation is to also run the flip of this strategy with the same trading rules modeled in The OddsMaker. The “flip” feature is a button found in the Trade-Ideas Pro configuration window. The results of this flip strategy appear in Figure 18.
      Description: “Fibonacci Long First 30 Minutes”
      Provided by:
      Trade Ideas (copyright © Trade Ideas LLC 2009). All rights
      reserved. For educational purposes only. Remember these are
      sketches meant to give an idea how to model a trading plan.
      Trade-Ideas.com and all individuals affiliated with this site
      assume no responsibilities for trading and investment results.
Type or copy/paste this shortened string directly into a browser then copy/paste the full length link into Trade-Ideas Pro using the “Collaborate” feature (right-click in any strategy window):
https://bit.ly/sjNIE (case-sensitive)
This strategy also appears on the Trade-Ideas blog at https://marketmovers.blogspot.com/. Figure 15 shows the configuration of this strategy, where one alert and seven filters are used with the following settings:
- Fibonacci 79% buy signal alert
- Max price = 40 ($)
- Min spread = 50 (pennies)
- Max spread = 200 (pennies)
- Min daily volume = 50,000 (shares/day)
- Max volume 5-minute candle = 150 (%)
- Min today’s range = 40 (%)
- Max distance from inside market filter = 0.1 (%)
The definitions of these indicators appear here: https://www.trade-ideas.com/Help.html.
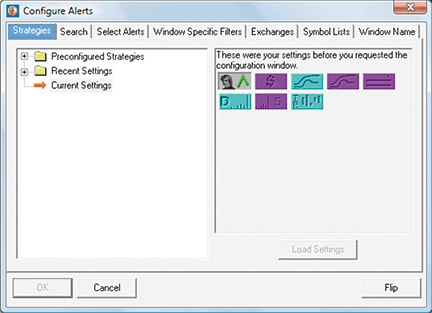
FIGURE 15: TRADE-IDEAS, ALERTS CONFIGURATION. Here are the alerts and filters used for the “Fibonacci long first 30 minutes” strategy.
That’s the strategy, but what about the trading rules? How should the opportunities that the strategy finds be traded?
To recap briefly, The OddsMaker doesn’t just look at a basket of stocks, à priori, to generate backtest results. Rather, it considers any stock that matched a desired pattern in the market, finds that stock, and applies the backtest’s rule set before summing up the results into a detailed set of totals: win rate, average winner, average loser, net winnings, confidence factor.
In summary, this strategy trades the first 30 minutes of the market, buying Fibonacci 79% signals. We evaluated several time frames, but were ultimately led to a hold time of just 15 minutes with a $0.40 stop and no predetermined profit target.
Here is what The OddsMaker tested for the past 30 days ended 7/14/2009 given the following trade rules:
- On each alert, buy (long) the symbol (price moves up to be a successful trade)
- Schedule an exit for the stocks after 15 minutes
- Trade only the first 30 minutes of the market session.
The OddsMaker summary provides the evidence of how well this strategy and our trading rules did (settings shown in Figure 16).
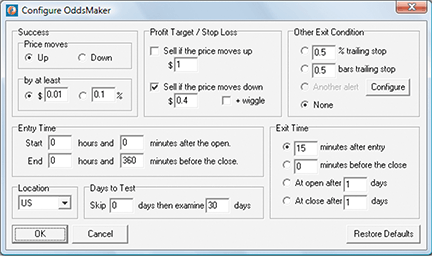
FIGURE 16: TRADE-IDEAS, ODDSMAKER BACKTESTING CONFIGURATION
The results (last backtested for the 30-day period ended 7/14/2009) are shown in Figure 17. The summary reads as follows: This strategy generated 34 trades of which 30 were profitable for a win rate of 88%. The average winning trade generated $0.45 in profit and the average loser lost $0.24. The net winnings of using this strategy for 30 trading days generated $12.48 points. If you normally trade in 100-share lots, this strategy would have generated $1,248. The z-score or confidence factor that the next set of results will fall within this strategy’s average winner and loser is 100%.
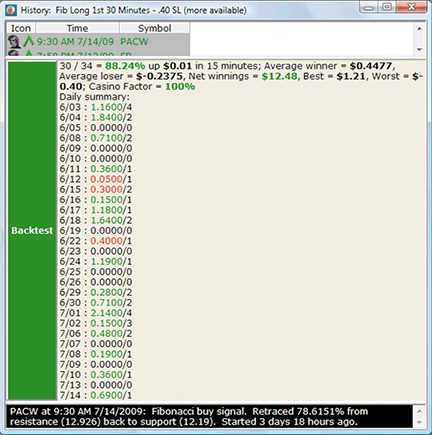
FIGURE 17: TRADE-IDEAS, BACKTEST RESULTS
As mentioned earlier, you can also deploy the flipped version of this strategy to trade stocks in the opposite pattern. In this case, successful trading means selling short each opportunity. The backtest results of this approach appear in Figure 18.
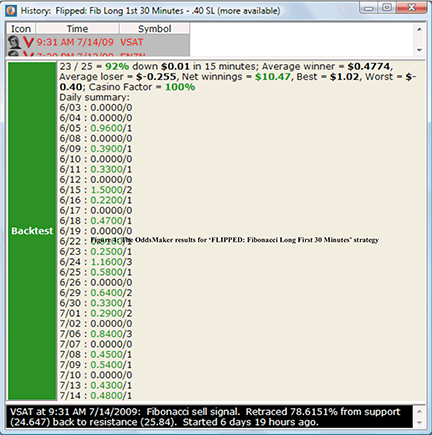
FIGURE 18: TRADE-IDEAS, BACKTEST RESULTS FOR FLIPPED STRATEGY
Learn more about these backtest results from The OddsMaker by going to the online user’s manual at https://www.trade-ideas.com/OddsMaker/Help.html.
![]() METASTOCK: PIVOT DETECTOR OSCILLATOR, SIMPLIFIED
METASTOCK: PIVOT DETECTOR OSCILLATOR, SIMPLIFIED
From Giorgos Siligardos’ article in the July 2009 Stocks & Commodities, “The Pivot Detector Oscillator, Simplified.”
    PID FORMULAS FOR METASTOCK
    To create the PIDosc open Indicator Builder
    and create a new indicator with the following:

    Name: PIDosc
    Formula:
        {by Giorgos E. Siligardos}
        sma200:=Mov(C,200,S);
        bull:=C>sma200;
        If(bull,(RSI(14)-35)/(85-35), (RSI(14)-20)/(70-20))*100;

    To create an Expert Advisor for showing the PID signals do the
    following: Open The Expert Advisor and create a new expert:

    Name: PID signals
    Notes: by Giorgos E. Siligardos

    Create two Symbols:

    First symbol:
    Name: PID buy signal
    Condition:
        PIDosc:=Fml(“PIDosc”);
        Cross(PIDosc,0)
    Graphic: Buy Arrow
    Color: Blue
    Symbol Position: Below Price Plot

    Second symbol:
    Name: PID sell signal
    Condition:
        PIDosc:=Fml(“PIDosc”);
        Cross(100,PIDosc)
    Graphic: Sell Arrow
    Color: Red
    Symbol Position: Above Price Plot