TRADERS’ TIPS
July 2009
Here is this month’s selection of Traders’ Tips, contributed by various developers of technical analysis software to help readers more easily implement some of the strategies presented in this and other issues.
Other code appearing in articles in this issue is posted in the Subscriber Area of our website at https://technical.traders.com/sub/sublogin.asp. Login requires your last name and subscription number (from mailing label). Once logged in, scroll down to beneath the “Optimized trading systems” area until you see “Code from articles.” From there, code can be copied and pasted into the appropriate technical analysis program so that no retyping of code is required for subscribers.
You can copy these formulas and programs for easy use in your spreadsheet or analysis software. Simply “select” the desired text by highlighting as you would in any word processing program, then use your standard key command for copy or choose “copy” from the browser menu. The copied text can then be “pasted” into any open spreadsheet or other software by selecting an insertion point and executing a paste command. By toggling back and forth between an application window and the open web page, data can be transferred with ease.
This month’s tips include formulas and programs for:
- TRADESTATION: TRAILING RESISTANCE &ND SUPPORT STOPS (TR&NDS)
- eSIGNAL: TRAILING RESISTANCE &ND SUPPORT STOPS (TR&NDS)
- WEALTH-LAB: TRAILING RESISTANCE &ND SUPPORT STOPS (TR&NDS)
- AMIBROKER: TRAILING RESISTANCE &ND SUPPORT STOPS (TR&NDS)
- NEUROSHELL TRADER: TRAILING RESISTANCE &ND SUPPORT STOPS (TR&NDS)
- NEOTICKER: TRAILING RESISTANCE &ND SUPPORT STOPS (TR&NDS)
- AIQ: DOUBLE 7S STRATEGY
- TRADERSSTUDIO: TRAILING RESISTANCE &ND SUPPORT STOPS (TR&NDS)
- STRATASEARCH: TRAILING RESISTANCE &ND SUPPORT STOPS (TR&NDS)
- TRADECISION: TRAILING RESISTANCE &ND SUPPORT STOPS (TR&NDS)
- NINJATRADER: TRAILING RESISTANCE &ND SUPPORT STOPS (TR&NDS)
- WAVE59: TRAILING RESISTANCE &ND SUPPORT STOPS (TR&NDS)
- VT TRADER: TRAILING RESISTANCE &ND SUPPORT STOPS (TR&NDS)
- TRADE-IDEAS: TRAILING RESISTANCE &ND SUPPORT STOPS (TR&NDS)
- METASTOCK: TRAILING RESISTANCE &ND SUPPORT STOPS (TR&NDS) (VERVOORT ARTICLE CODE)
Return to Contents
![]() TRADESTATION: TRAILING RESISTANCE &ND SUPPORT STOPS (TR&NDS)
TRADESTATION: TRAILING RESISTANCE &ND SUPPORT STOPS (TR&NDS)
Sylvain Vervoort’s article in this issue, “Trailing Resistance &nd Support Stops,” describes a technique for generating stop-and-reverse trading signals from separate support and resistance calculations. The EasyLanguage code given here uses the parameters mentioned in Vervoort’s article as the default inputs. Four of Vervoort’s parameters can be optimized (the MinGapPct, StopOffHighPct, MaxLossPct, and MaxLossResetPct). The strategy’s first trade date and first trade direction are also established by user inputs.
A sample chart is shown in Figure 1.
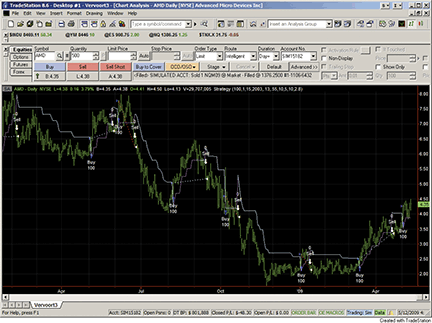
Figure 1:TRADESTATION, TRAILING RESISTANCE AND STOP STRATEGY (VTSR). Here is Sylvain Vervoort’s trailing resistance and stop (VTSR) strategy displayed on a chart of Advanced Micro Devices, Inc. (AMD). The strategy takes long positions only. The levels at which the strategy enters new positions are displayed by the cyan lines. The exit levels are displayed by the magenta lines.
To download the EasyLanguage code for this study, go to the TradeStation and EasyLanguage Support Forum (https://www.tradestation.com/Discussions/forum.aspx?Forum_ID=213). Search for the file “VervoortVTSR.eld.”
Strategy:  VTSR

inputs:
	Quantity( 100 ),
	InitialMonth( 1 ),
	InitialDay( 1 ),
	InitialYear( 2008 ),
	MinGapPct( 0.13 ),
	StopOffHighPct( 0.55 ),
	MaxLossPct( 10 ),
	MaxLossResetPct( 5 ),
	ATR_Period( 10 ),
	ATR_Factor( 2.8 ) ;

variables:
	HiLo( 0 ),
	HRef( 0 ),
	LRef( 0 ),
	HiLoHRefMax( 0 ),
	HiLoHRefMaxLRefMax( 0 ),
	ATRMod( 0 ),
	Resistance( 0 ),
	Loss( 0 ),
 	LineNum( 0 ),
	ReturnVal( 0 ),
	WaitingForEntry( true ),
	Trends( 0 ),
	Support( 0 ) ;

HiLo = iff( High - Low < 1.5 * Average( High - Low,
 ATR_Period ), High - Low, 1.5 * Average( High - Low,
 ATR_Period ) ) ;
HRef = iff( Low <= High[1], High - Close[1],( High -
 Close[1] ) - 0.5 * ( Low - High[1] ) ) ;
LRef = iff( High >= Low[1], Close[1] - Low, ( Close[1] -
 Low ) - 0.5 * ( Low[1] - High ) ) ;
HiLoHRefMax = Maxlist( HiLo, HRef ) ;
HiLoHRefMaxLRefMax = Maxlist( HiLoHRefMax, LRef ) ;
ATRMod = XAverageOrig( HiLoHRefMaxLRefMax,
 ATR_Period ) ;
Loss = ATR_Factor * ATRMod ;
Resistance = Close + Loss ;

if Low >= Low[2]
	and Low[1] >= Low[2]
	and Low[3] >= Low[2]
	and Low[4] >= Low[2]
then
	Support = Low[2]
else if Low > High[1] * ( 1 + 0.01 * MinGapPct ) then
	Support = High[1] * ( 1 - 0.01 * StopOffHighPct )
else if Low > Support[1] * ( 1 + 0.01 * MaxLossPct )
 then
	Support = Support[1] * ( 1 + 0.01 *
	 MaxLossResetPct ) ;

if High > Trends[1] and High[1] > Trends[1] then
	Trends = MaxList( Trends[1], Support )
else if High < Trends[1] and High[1] < Trends[1] then
	Trends = Minlist( Trends[1], Resistance )
else if High >= Trends[1] then
	Trends = Support
else
	Trends = Resistance ;

if ( Year( Date ) + 1900 = InitialYear
	and Month( Date ) >= InitialMonth
	and DayOfMonth( Date ) >= InitialDay ) or
	Year( Date ) + 1900 > InitialYear
then
	begin
	if MarketPosition = 0 and High > Trends[1] and
	 Trends[1] > 0 then
		begin
		Buy Quantity shares this bar Close ;
		LineNum = TL_New( Date[1], Time[1], Trends[1],
		 Date, Time, Trends ) ;
		ReturnVal = TL_SetColor( LineNum, Cyan ) ;
		end
	else if MarketPosition = 1 and High < Trends[1] then
		begin
		Sell Quantity shares this bar at Close ;
		LineNum = TL_New( Date[1], Time[1], Trends[1],
		 Date, Time, Trends ) ;
		ReturnVal = TL_SetColor( LineNum, Magenta ) ;
		end
	else if Trends[1] > 0 then
		begin
		LineNum = TL_New( Date[1], Time[1], Trends[1],
		 Date, Time, Trends ) ;
		if Close > Trends then
			ReturnVal = TL_SetColor( LineNum, Magenta )
		else
			ReturnVal = TL_SetColor( LineNum, Cyan ) ;
		end ;
	end ;
This article is for informational purposes. No type of trading or investment recommendation, advice, or strategy is being made, given or in any manner provided by TradeStation Securities or its affiliates.
![]() eSIGNAL: TRAILING RESISTANCE &ND SUPPORT STOPS (TR&NDS)
eSIGNAL: TRAILING RESISTANCE &ND SUPPORT STOPS (TR&NDS)
For this month’s Traders’ Tips, we’ve provided the formula, Sve_Trends_Trail.efs, based on the formula code given in Sylvain Vervoort’s article in this issue, “Trailing Resistance &nd Support Stops.”
The formula plots the R&S trailing stop line with labels for the signals to enter a long position and exit the position (Figure 2). The study may alternatively display short signals. The formula contains parameters that may be configured through the Edit Studies option to change the Atr Period, Atr Multiplication, Long or Short, Show Trailing Stop Line, Show Labels, Show Arrows, Display Cursor Labels, and Line Color. The formula is also compatible for backtesting with the Strategy Analyzer.

Figure 2: eSIGNAL, trailing resistance & support stop
/*********************************
Provided By:
    eSignal (Copyright c eSignal), a division of Interactive Data
    Corporation. 2009. All rights reserved. This sample eSignal
    Formula Script (EFS) is for educational purposes only and may be
    modified and saved under a new file name.  eSignal is not responsible
    for the functionality once modified.  eSignal reserves the right
    to modify and overwrite this EFS file with each new release.

Description:
    Trailing Resistance & Support Stops, by Sylvain Vervoort

Version:            1.0  05/07/2009

Formula Parameters:                     Default:
    ATR Period                          10
    ATR Multiplication                  2.8
    Long or Short                       Long
    Show Line Trailing Stop             True
    Show Labels                         True
    Show Arrows                         True
    Display Cursor Labels               True
    Line Color                          Red

Notes:
    The related article is copyrighted material. If you are not a subscriber
    of Stocks & Commodities, please visit www.traders.com.

**********************************/
var fpArray = new Array();
var bInit = false;

function preMain() {
    setPriceStudy(true);
    setStudyTitle("R&S Trailing Stops");
    setCursorLabelName("R&S Trailing Stops", 0);
    setShowTitleParameters(false);
    setDefaultBarFgColor(Color.red, 0);
    setPlotType(PLOTTYPE_LINE, 0);
    setDefaultBarThickness(2, 0);
    askForInput();
    var x=0;
    fpArray[x] = new FunctionParameter("nATRPeriod", FunctionParameter.NUMBER);
    with(fpArray[x++]){
        setName("ATR Period");
        setLowerLimit(1);
        setUpperLimit(100);
        setDefault(10);
    }
    fpArray[x] = new FunctionParameter("nATRMultip", FunctionParameter.NUMBER);
    with(fpArray[x++]){
        setName("ATR Multiplication");
        setLowerLimit(1);
        setUpperLimit(10);
        setDefault(2.8);
    }
    fpArray[x] = new FunctionParameter("bShowTS", FunctionParameter.BOOLEAN);
    with(fpArray[x++]){
        setName("Show Line Trailing Stop");
        addOption("true");
        addOption("false");
        setDefault("true");
    }
    fpArray[x] = new FunctionParameter("bShowL", FunctionParameter.BOOLEAN);
    with(fpArray[x++]){
        setName("Show Labels");
        addOption("true");
        addOption("false");
        setDefault("true");
    }
    fpArray[x] = new FunctionParameter("bShowArrows", FunctionParameter.BOOLEAN);
    with(fpArray[x++]){
        setName("Show Arrows");
        addOption("true");
        addOption("false");
        setDefault("true");
    }
    fpArray[x] = new FunctionParameter("ViewValue", FunctionParameter.BOOLEAN);
    with(fpArray[x++]){
        setName("Display Cursor Labels");
        setDefault(true);
    }
    fpArray[x] = new FunctionParameter("sStrategy", FunctionParameter.STRING);
    with(fpArray[x++]){
        setName("Long or Short");
        addOption("Long");
        addOption("Short");
        setDefault("Long");
    }
    fpArray[x] = new FunctionParameter("cColor", FunctionParameter.COLOR);
    with(fpArray[x++]){
        setName("Line Color");
        setDefault(Color.red);
    }
}

var bVersion = null;
var xSVE_TRENDS_Trail = null;
var xClose = null;
var bTrade = true;

function main(nATRPeriod, nATRMultip, sStrategy, bShowTS, bShowL, bShowArrows, ViewValue, cColor){
var nClose = 0;
var nClose1 = 0;
var nATRTS = 0;
var nATRTS1 = 0;

    if (bVersion == null) bVersion = verify();
    if (bVersion == false) return;
    if (getCurrentBarCount() <= nATRPeriod + 5) return;
    if(bInit==false){
        setShowCursorLabel(ViewValue);
        setDefaultBarFgColor(cColor, 0);
        xClose = close();
        xSVE_TRENDS_Trail = efsInternal("SVE_TRENDS_Trail", nATRPeriod, nATRMultip, xClose);
        bInit=true;
    }

    if(getCurrentBarIndex() == 0) {
        bTrade = false;
        return;
    }

    nClose = xClose.getValue(0);
    nClose1 = xClose.getValue(-1);
    nATRTS = xSVE_TRENDS_Trail.getValue(0);
    nATRTS1 = xSVE_TRENDS_Trail.getValue(-1);
    if (nATRTS == null) return;

    if (nClose1 < nATRTS1 && nClose > nATRTS) {
        if (bShowArrows) drawShape( Shape.UPARROW, BelowBar1, Color.green);
        if (sStrategy == "Long") {
            if (bShowL) drawTextRelative(0, BelowBar2, " LONG", Color.white, Color.green, Text.PRESET|Text.CENTER|Text.FRAME, "Arial Black", 10, "b"+(getCurrentBarCount()), -5);
            if (bTrade) Strategy.doLong("Long", Strategy.MARKET, Strategy.NEXTBAR);
        } else {
            if (bShowL) drawTextRelative(0, BelowBar2,  " EXIT", Color.white, Color.green, Text.PRESET|Text.CENTER|Text.FRAME, "Arial Black", 10, "b"+(getCurrentBarCount()), -5);
            if (Strategy.isShort() && bTrade) Strategy.doCover("Exit Short", Strategy.MARKET, Strategy.NEXTBAR);
        }
    }
    if (nClose1 > nATRTS1 && nClose < nATRTS) {
        if (bShowArrows) drawShape( Shape.DOWNARROW, AboveBar1, Color.red);
        if (sStrategy == "Long") {
            if (bShowL) drawTextRelative(0, AboveBar2,  " EXIT", Color.white, Color.red, Text.PRESET|Text.CENTER|Text.FRAME, "Arial Black", 10, "b"+(getCurrentBarCount()), -5);
            if (Strategy.isLong() && bTrade) Strategy.doSell("Exit Long", Strategy.MARKET, Strategy.NEXTBAR);
        } else {
            if (bShowL) drawTextRelative(0, AboveBar2,  "SHORT", Color.white, Color.red, Text.PRESET|Text.CENTER|Text.FRAME , "Arial Black", 10, "b"+(getCurrentBarCount()), -5);
            if (bTrade) Strategy.doShort("Short", Strategy.MARKET, Strategy.NEXTBAR);
        }
    }
    if (bShowTS == false) return;
    return nATRTS;
}

var xHigh = null;
var xLow = null;
var xATR_Modif = null;
var bSecondInit = false;
var Support = 0;
var Support_1 = 0;

function SVE_TRENDS_Trail(nATRPeriod, nATRMultip, xSClose){
var nClose = 0;
var nLoss = 0;
var Resistance = 0;
var Trends = 0;
var nRef = ref(-1);
    if (bSecondInit == false) {
        xHigh = high();
        xLow = low();
        xATR_Modif = efsInternal("Calc_ATRMod", nATRPeriod, nATRMultip, xSClose, xHigh, xLow)
        bSecondInit = true;
    }

    nClose = xSClose.getValue(0);
    if (xATR_Modif.getValue(0) == null) return;
    nLoss = nATRMultip * xATR_Modif.getValue(0);
    Resistance = nClose + nLoss;

    if(getBarState()==BARSTATE_NEWBAR){
        Support_1 = Support;
    }

    if (xLow.getValue(0)  >= xLow.getValue(-2) &&
        xLow.getValue(-1) >= xLow.getValue(-2) &&
        xLow.getValue(-3) >= xLow.getValue(-2) &&
        xLow.getValue(-4) >= xLow.getValue(-2)) {
        Support = xLow.getValue(-2);
    } else {
        if (xLow.getValue(0) > xHigh.getValue(-1) * 1.0013) {
            Support = xHigh.getValue(-1) * 0.9945;
        } else {
            if (xLow.getValue(0) > nRef * 1.1) {
                Support = Support_1 * 1.05;
            } else {
                Support = Support_1;
            }
        }
    }

    if (xHigh.getValue(0) > nRef && xHigh.getValue(-1) > nRef) {
        Trends = Math.max(nRef, Support);
    } else {
        if (xHigh.getValue(0) < nRef && xHigh.getValue(-1) < nRef) {
            Trends = Math.min(nRef, Resistance);
        } else {
            if (xHigh.getValue(0) >= nRef) {
                Trends = Support;
            } else {
                Trends = Resistance;
            }
        }
    }
    return Trends;
}

function Calc_High_Low() {
var nRes = high(0) - low(0);
    if (nRes == null) return;
    return nRes;
}

var bThirdInit = false;
var xHigh_Low = null;
var xMA_High_Low = null;

function Calc_ATRMod(nATRPeriod, nATRMultip, xTClose, xHigh, xLow) {
var nHiLo = 0;
var nHref = 0;
var nLref = 0;
var ndiff1 = 0;
var ndiff2 = 0;
var nHigh_Low = 0;
var nMA_High_Low = 0;
var nAtrMod = 0;
var nRef = ref(-1);
    if (bThirdInit == false) {
        xHigh_Low = efsInternal("Calc_High_Low");
        xMA_High_Low = sma(nATRPeriod, xHigh_Low)
        bThirdInit = true;
    }
    if (xMA_High_Low.getValue(-1) == null) return;
    var nClose = xTClose.getValue(0);
    var nClose1 = xTClose.getValue(-1);
    var nHigh = xHigh.getValue(0);
    var nHigh1 = xHigh.getValue(-1);
    var nLow = xLow.getValue(0);
    var nLow1 = xLow.getValue(-1);
    nHigh_Low = xHigh_Low.getValue(0);
    nMA_High_Low = xMA_High_Low.getValue(0);

    if (nHigh_Low < 1.5 * nMA_High_Low) {
        nHiLo = nHigh_Low;
    } else {
        nHiLo = 1.5 * nMA_High_Low;
    }

    if (nLow <= nHigh1) {
        nHref = nHigh - nClose1;
    } else {
        nHref = (nHigh - nClose1) - (nLow - nHigh1) / 2;
    }

    if (nHigh >= nLow1) {
        nLref = nClose1 - nLow;
    } else {
        nLref = (nClose1 - nLow) - (nLow1 - nHigh) / 2;
    }

    ndiff1 = Math.max(nHiLo, nHref);
    ndiff2 = Math.max(ndiff1, nLref);
    nAtrMod = (ndiff2 + (nATRPeriod - 1) *  nRef) / nATRPeriod;
    return nAtrMod;
}

function verify() {
    var b = false;
    if (getBuildNumber() < 779) {
        drawTextAbsolute(5, 35, "This study requires version 8.0 or later.",
            Color.white, Color.blue, Text.RELATIVETOBOTTOM|Text.RELATIVETOLEFT|Text.BOLD|Text.LEFT,
            null, 13, "error");
        drawTextAbsolute(5, 20, "Click HERE to upgrade.@URL=https://www.esignal.com/download/default.asp",
            Color.white, Color.blue, Text.RELATIVETOBOTTOM|Text.RELATIVETOLEFT|Text.BOLD|Text.LEFT,
            null, 13, "upgrade");
        return b;
    } else {
        b = true;
    }
    return b;
}
To discuss this study or download complete copies of the formula code, please visit the Efs Library Discussion Board forum under the Forums link at www.esignalcentral.com or visit our Efs KnowledgeBase at www.esignalcentral.com/support/kb/efs/. The eSignal formula scripts (Efs) are also available for copying and pasting from the Stocks & Commodities website at Traders.com.
![]() WEALTH-LAB: TRAILING RESISTANCE &ND SUPPORT STOPS (TR&NDS)
WEALTH-LAB: TRAILING RESISTANCE &ND SUPPORT STOPS (TR&NDS)
The WealthScript code given here is based on Sylvain Vervoort’s article in this issue, “Trailing Resistance &nd Support Stops.”
We programmed the long-only Tr&nds stop strategy for Wealth-Lab 5 in C#. You can use the sliders to adjust the Period and atrFactor strategy parameters to eyeball an optimization, or, using Wlp 5.4, you can now run full Exhaustive and Monte Carlo optimizations. A portfolio simulation ($5,000 size, $8 one-way commissions) on the Dow 30 symbols over the last six years yielded the two-parameter optimization curve shown in Figure 3.
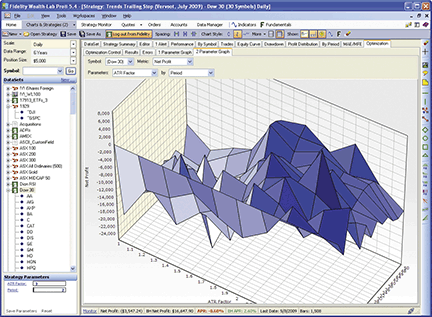
Figure 3: WEALTH-LAB, Tr&nds stop strategy. While the optimization didn’t inspire confidence in the strategy’s stability over a range of parameters, ATR factors around 2 helped improve the overall profit, while the period did not affect the results significantly.
WealthScript code (C#):

/* Place the code within the namespace WealthLab.Strategies block */
public class SVETrendsStopStrategy : WealthScript
{
   StrategyParameter atrFactor;
   StrategyParameter period;

   public SVETrendsStopStrategy ()
   {
      atrFactor = CreateParameter("ATR Factor", 2.8, 1, 10, 0.2);
      period = CreateParameter("Period", 10, 2, 100, 2);
   }

   public DataSeries TrndsStop(Bars b, int period, double factor )
   {
      DataSeries loss = factor * TASCIndicators.ATRModified.Series(b, period);
      DataSeries resistance = b.Close + loss;
      DataSeries support = new DataSeries(b, "Support(" + period + "," + factor + ")");
      DataSeries trends = new DataSeries(b, "TrendsStop(" + period + "," + factor + ")");

      for (int bar = 0; bar < period; bar++)
         support[bar] = b.Low[bar];
      for (int bar = period; bar < b.Count; bar++)
      {
         double b2 = b.Low[bar-2];
         double prev = trends[bar-1];

         if( (b.Low[bar] >= b2) && (b.Low[bar-1] >= b2) && (b.Low[bar-3] >= b2) && (b.Low[bar-4] >= b2) )
            support[bar] = b2;
         else if ( b.Low[bar] > b.High[bar-1] * 1.0013 )
            support[bar] =  b.High[bar-1] * 0.9945;
         else if ( b.Low[bar] > support[bar-1] * 1.1 )
            support[bar] = support[bar-1] * 1.05;
         else
            support[bar] = support[bar-1];

         if( (b.High[bar] > prev) && (b.High[bar-1] > prev) )
            trends[bar] = Math.Max(prev, support[bar]);
         else if( (b.High[bar] < prev) && (b.High[bar-1] < prev) )
            trends[bar] = Math.Min(prev, resistance[bar]);
         else if( (b.High[bar] >= prev) )
            trends[bar] = support[bar];
         else
            trends[bar] = resistance[bar];
      }
      return trends;
   }

   protected override void Execute()
   {
      DataSeries stop = TrndsStop(Bars, period.ValueInt, atrFactor.Value);
      PlotSeries(PricePane, stop, Color.Blue, LineStyle.Solid, 2);

      for(int bar = 20; bar < Bars.Count; bar++)
      {
         if (IsLastPositionActive)
         {
            if( CrossUnder(bar, High, stop) )
               SellAtMarket(bar + 1, LastPosition);
         }
         else if( CrossOver(bar, Close, stop) )
            BuyAtMarket(bar + 1);
      }
   }
}
![]() AMIBROKER: TRAILING RESISTANCE &ND SUPPORT STOPS (TR&NDS)
AMIBROKER: TRAILING RESISTANCE &ND SUPPORT STOPS (TR&NDS)
In “Trailing Resistance &nd Support Stops” in this issue, Sylvain Vervoort continues his study of various trailing-stop techniques. In this issue’s article, which is the third part in his series, stops are based on support and resistance levels.
A ready-to-use AmiBroker formula for the article is presented here in Listing 1 and it demonstrates how to use the “for” loop to implement recursive calculation (where subsequent values depend on previous values of the same variable). To use it, enter the formula into the Editor, then press “Apply Indicator.” To adjust the stop mode and its parameters, you can click on the chart with the right mouse button and select “Parameters” from the context menu.
LISTING 1
// SVE TRENDS Trial stop function
ATRfact = Param( "ATR multiplication", 2.8, 1, 10, 0.1 );
period = Param( "ATR Period", 10, 1, 100 );

HiLo = IIf( (H-L) < 1.5 * MA( H-L, period ), H-L, 1.5 * MA( H-L, period ) );

Href = IIf( L <= Ref( H, -1 ), H - Ref( C, -1 ), ( H - Ref( C, -1 ) ) - ( L - Ref( H, -1 ) ) / 2 );
Lref = IIf( H >= Ref( L, -1 ), Ref( C, -1 ) - L, ( Ref( C, -1 ) - L ) - ( Ref( L, -1 ) - H ) / 2 );
diff1 = Max( HiLo, Href );
diff2 = Max( diff1, Lref );
ATRmod = Wilders( diff2, period );

loss = atrfact * ATRmod;
resistance = C + loss;

support = L;
trends = H;

for( i = 4; i < BarCount; i++ )
{
  if( L[ i ] >= L[ i-2 ] AND
      L[ i-1 ] >= L[ i-2 ] AND
      L[ i-3 ] >= L[ i-2 ] AND
      L[ i-4 ] >= L[ i-2 ] )
  {
    support[ i ] = L[ i - 2];
  }
  else
  if( L[ i ] > H[ i-1 ] * 1.0013 )
  {
    support[ i ] = H[ i-1 ] * 0.9945;
  }
  else
  if( L[ i ] > support[ i-1 ] * 1.1 )
  {
     support[ i ] = support[ i-1 ] * 1.05;
  }
  else
  {
     support[ i ] = support[ i-1 ];
  }

  if( H[ i ] > trends[ i-1 ] AND
      H[ i-1 ] > trends[ i-1 ] )
  {
      trends[ i ] = Max( trends[ i-1 ], support[ i ] );
  }
  else
  if( H[ i ] < trends[ i-1 ] AND
      H[ i-1 ] < trends[ i-1 ] )
  {
      trends[ i ] = Min( trends[ i-1 ], resistance[ i ] );
  }
  else
  if( H[ i ] >= trends[ i-1 ] )
      trends[ i ] = support[ i ];
  else
      trends[ i ] = resistance[ i ];

}

Plot( trends, "Trends", colorRed );
Plot( C, "Price", colorBlack, styleBar );
Buy = Cross( C, trends );
Sell = Cross( trends, H );

Buy = ExRem( Buy, Sell ); // remove ex. signals

PlotShapes( Buy * shapeUpArrow, colorGreen );
PlotShapes( Sell * shapeDownArrow, colorRed );
A sample chart is shown in Figure 4.
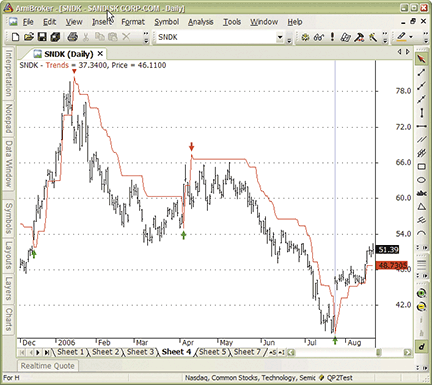
Figure 4: AMIBROKER, Trailing Resistance &nd Support Stops. Here is the TR&NDS applied to a daily chart of Sandisk (SNDK) with buy (green) and sell (red) arrows to replicate the sample charts provided in Sylvain Vervoort’s article in this issue.
![]() NEUROSHELL TRADER: TRAILING RESISTANCE &ND SUPPORT STOPS (TR&NDS)
NEUROSHELL TRADER: TRAILING RESISTANCE &ND SUPPORT STOPS (TR&NDS)
After developing Traders’ Tips for parts 1 and 2 of Sylvain Vervoort’s article series on trailing stops in the May and June 2009 issues, we decided to put our own artificial-intelligence spin on this month’s Traders’ Tip based on Vervoort’s article in this issue, “Trailing Resistance &nd Support Stops.”
Instead of crafting Vervoort’s rule-based trailing resistance & support stop, we took roughly the same indicators and fed them into a neural net. We let the neural net figure out the entry and exit points.
To set up the trailing resistance & support stop neural net, select “New Prediction…” from the Insert menu and use the Indicator Wizard to add the following indicator inputs to the net:
TP - Support (from the Turning Points add-on)
		TP-Support (High, Low, Nhood = 2, TPnum = 1)

	TP - Resistance (from the Turning Points add-on)
		TP-Resistance (High, Low, Nhood = 2, TPnum = 1)

	ATR Simple
		ATR (High, Low, (Lag (Close, 1) ), Avg Periods = 20 )
We built four variations of this neural net model, each of which took about three to seven minutes to set up and train. We used the same stocks as in Vervoort’s article, with data back to January 16, 2003. We backtested the neural net through May 2009 to see how the models worked during the market crash from late 2008 to early 2009. The models invested $1,000 in each stock and included a 0.1% brokerage fee each way, as did Vervoort.
The first model (Figure 5) traded long only. It was created without using the genetic algorithm optimizer. This model generated a profit of $158,280 for all stocks in the portfolio.
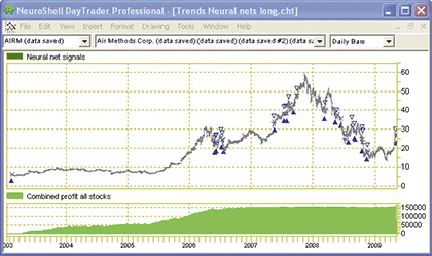
Figure 5: NeuroShell TRADER, Trends Neural net, Long. This neural net used support and resistance indicators along with average true range to find profitable buy and sell points in a long-only trading system. The neural net used default values for the indicators.
The second model (Figure 6) traded a long and short reversal system, but again did not use the genetic algorithm optimizer. This model produced $175,235 in profits for all stocks combined.
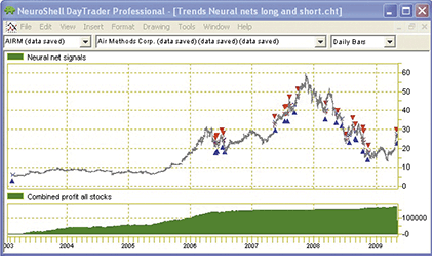
Figure 6: NeuroShell TRADER, Trends Neural Net, Long and Short. This neural net used the same inputs for a long and short trading system, again using default values for the indicators. Profit rose by approximately $17,000 compared to the long-only model.
The third model (Figure 7) used the genetic algorithm optimizer for a few seconds on each stock to find more profitable versions of the average period in the average true range, as well as the number of bars left and right of the pivot points for the support and resistance indicators. The resulting profit was $292,059.
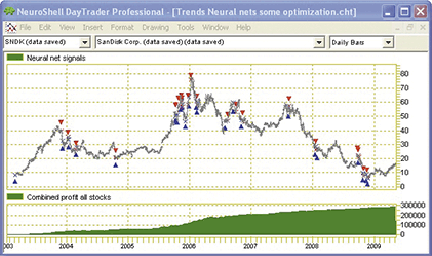
Figure 7: NeuroShell TRADER, Trends Neural Net With Some Optimization. This neural net combined long and short trades along with genetic algorithm optimization of the periods in the average true range and the pivot points for the support and resistance indicators. It produced the largest profit of all the models, $292,059.
The fourth model (Figure 8) performed the same genetic algorithm optimization over all the stocks in the portfolio rather than on each stock individually as in the third model. It found a single set of indicator parameters that worked for all the stocks. This model showed a profit of $194,751. The neural network found that the turning points resistance indicator had an importance of 35% toward the overall model, while the turning points support indicator contributed 40% and the simple average true range indicator contributed 24%.
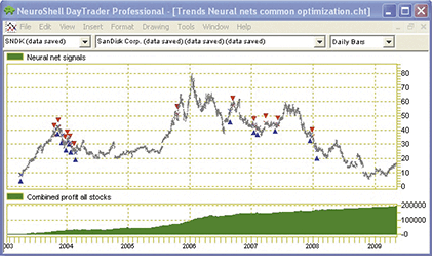
Figure 8: NeuroShell TRADER, Trends Neural Net With Common Optimization. This neural net found a universal set of indicator parameters for the average true range periods and pivot points. It produced a profit of $194,751, which beat the nonoptimized models but not the third model customized for each stock.
While the neural net found its own entry and exit points for this model, it may be combined with other rules or traditional stops in NeuroShell Trader’s Trading Strategy Wizard.
![]() NEOTICKER: TRAILING RESISTANCE &ND SUPPORT STOPS (TR&NDS)
NEOTICKER: TRAILING RESISTANCE &ND SUPPORT STOPS (TR&NDS)
The support/resistance trailing stops discussed in “Trailing Resistance &nd Support Stops” by Sylvain Vervoort in this issue can be implemented in NeoTicker using formula language. Using one formula language indicator, we can encapsulate all three support and resistance stop plots. We have named this indicator the Tasc Sve trends trailing stop function (Listing 1). It will return three plots (Figure 9) and require two parameters: Atr multiple and Atr period.
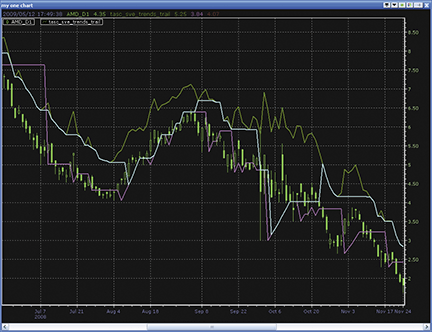
Figure 9: NEOTICKER, Trailing Resistance &nd Support Stops
Custom long/short entry signals can be added directly into the stop indicator code to build a trading system that uses these stops.
LISTING 1
$atrfact := choose(param1 < 1, 1, param1 >= 10, 10, param1);
$period := choose(param2 < 1, 1, param2 >= 100, 100, param2);
brange := H-L;
$HiLo := if(brange < 1.5*average(brange, $period),
            brange,
            1.5*average(brange, $period));
$Href := if(L <= H(1), H-C(1), (H-C(1))-(L-H(1))/2);
$Lref := if(H >= L(1), C(1)-L, (C(1)-L)-(L(1)-H)/2);
$diff1 := maxlist($HiLo, $Href);
diff2 := maxlist($diff1, $Lref);
'wilder smoothing
$ATRmod := qc_xaverage(diff2, ($period*2)-1);
$loss := $atrfact*$ATRmod;
resistance := C + $loss;
support := choose((L>=L(2)) and (L(1)>l(2)) and (L(3)>=L(2)) and (L(4)>=L(2)),
                   L(2),
                   L>H(1)*1.0013,
                   H(1)*0.9945,
                   L>support(1),
                   support(1)*1.05,
                   support(1));
trends := choose((H>trends(1)) and (H(1)>trends(1)),
                  maxlist(trends(1), support),
                 (H=trends(1)),
                 support,
                 resistance);
plot1 := resistance;
plot2 := support;
plot3 := trends;
A downloadable version of the indicator formula will be available at the NeoTicker blog site (https://blog.neoticker.com).
![]() AIQ: DOUBLE 7S STRATEGY
AIQ: DOUBLE 7S STRATEGY
The Aiq code for implementing the Double 7s strategy presented in Larry Connors and David Penn’s article from the January 2009 S&C, “Three Rules, One Easy Way To Trade Etfs,” is shown here. The authors suggest a simple system to trade Etfs. The rules of the system are:
- Buy at the close when today’s close is above the 200-day moving average and today’s close is the lowest close in the last seven days;
- Exit when today’s close is the highest close in the last seven days.
I ran an Aiq Portfolio Manager test on four Etfs (Spy, Qqqq, Mdy, and Iwm) for the period 12/31/1998 to 5/12/2009. The strategy is long-only, so shorting Etfs was not tested.
The results are shown in Figure 10, which compares the equity curve for the portfolio of Etfs versus the S&P 500 index (Spx). The strategy showed an average annual return of 6.7% with a maximum drawdown of 14.05%, and easily outperformed the Spx over the test period.
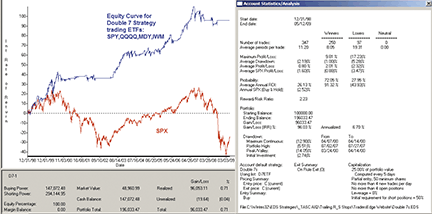
Figure 10: AIQ, DOUBLE 7S STRATEGY. Here is a samle equity curve for the Double 7s strategy trading a portfolio of ETFs consisting of SPY, QQQQ, MDY, and IWM for the period 12/31/1998 to 5/12/2009 compared to the S&P 500.
The code can be downloaded from the Aiq website at www.aiqsystems.com and also from www.tradersedgesystems.com/traderstips.htm.
![]() TRADERSSTUDIO: TRAILING RESISTANCE &ND SUPPORT STOPS (TR&NDS)
TRADERSSTUDIO: TRAILING RESISTANCE &ND SUPPORT STOPS (TR&NDS)
The TradersStudio code is given here for Sylvain Vervoort’s trailing resistance & support stop trading system as well as the date-specific version along with the indicator code and the related functions based on Vervoort’s article in this issue, “Trailing Resistance &nd Support Stops.”
In my May and June 2009 Traders’ Tips, I modified the trading system presented by Vervoort in those issues by adding market timing and also by trading both the long and short sides. This month’s system, if traded both long and short, would always be in, but since I added a market-timing filter based on a general-market trend-following filter, it will only trade long when the market trend is up, and short when the market trend is down. The coded version that I have supplied here has the options of trading either long only, short only, or both long and short, and also has the option to apply a market trend filter using the S&P 500 (Spx) to determine whether to trade long or short. I decided to stick with the author’s list of stocks for the tests.
I did not follow the author’s asymmetrical approach, which used a different method for the resistance equation versus the support equation. My version of the trailing support and resistance stop is completely symmetrical, so the long side uses the same parameters as the short side, and both are based on the trailing pivot concept.
In Figure 11, I show the resulting equity curve using a pivot-strength parameter of 2, as suggested by the author. I ran an optimization and found a better range for the pivot-strength parameter to be from 4 to 6. In Figure 12, I show the resulting equity curve using the pivot-strength parameter of 5. This setting resulted in a smoother equity curve and a higher final net profit.
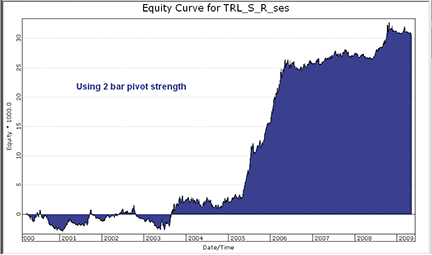
Figure 11: TRADERSSTUDIO, TR&ndS Trailing Stop. Here is a sample equity curve using a pivot-strength parameter of 2, with market timing, and trading both long and short for the period 1/16/2000 to 5/8/2009.
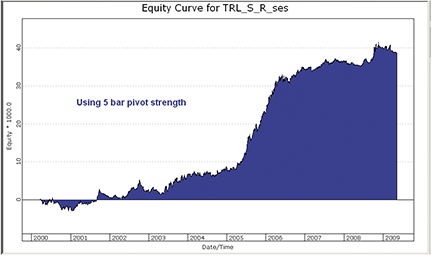
Figure 12: TRADERSSTUDIO, TR&ndS Trailing Stop. Here is a sample equity curve using a pivot-strength parameter of 5, with market timing, and trading both long and short for the period 1/16/2000 to 5/8/2009.
' TRAILING RESISTANCE &nd SUPPORT STOPS (Trail_R_S)
' System code
' Author: Sylvain Vervoort, TASC July 2009
' Coded by: Richard Denning 5/8/09
' www.tradersEdgeSystems.com

Sub Trail_R_S(tsStartDate,longOnly,useMktTm,spxLen,pivotStr,minGap,gapMult,maxStop)
'tsStartDate = date that trading is to start after bars back has been satisfied
'           use TradeStation date format of YYYMMDD example 1/20/2003 = 1030120
'longOnly = 1 (trade long side only), longOnly = -1 (short side only)
'useMktTm = 1 will apply an SPX trend filter so that trades are taken only in
'           the direction of the trend of the SP500 index; any other value
'           and no market timing filter is applied
' spxLen = 250
' pivotStr = 5 (number of bars on each side of the support or resistance level)
' minGap = 1.0013 (gap amount that triggers
Dim unitSiz
Dim trail As BarArray
Dim size As BarArray
Dim SPXc As BarArray
Dim OKtoBuy, OKtoSell
Dim resist As BarArray
Dim support As BarArray
unitSiz = 1
SPXc = C Of independent1
OKtoBuy = SPXc > Average(SPXc,spxLen,0) And SPXc[1] > Average(SPXc,spxLen,1)
OKtoSell = SPXc < Average(SPXc,spxLen,0) And SPXc[1] < Average(SPXc,spxLen,1)

trail = TRAIL_Res_Sup(pivotStr,minGap,gapMult,maxStop,resist,support)

size = (1000 / TSCLose) / unitSiz

If Not CrossesOver(C,trail,0) And Not CrossesUnder(C,trail,0) Then size = size[1]
If useMktTm = 1 Then
    If Date >= MigrateDate(tsStartDate) Then
        If longOnly >= 1 And OKtoBuy Then
            If CrossesOver(L,trail,0) Then Buy("LE",size,0,CloseEntry,Day)
            If  H < trail Then ExitLong("LX","",size[1],0,CloseExit,Day)
        End If
        If (longOnly <= 0 Or longOnly = 2) And OKtoSell Then
            If CrossesUnder(H,trail,0) Then Sell("SE",size,0,CloseEntry,Day)
            If L > trail Then ExitShort("SX","",size[1],0,CloseExit,Day) '
        End If
    End If
Else
    If Date >= MigrateDate(tsStartDate) Then
        If longOnly >= 1 Then
            If CrossesOver(L,trail,0) Then Buy("LE",size,0,CloseEntry,Day)
            If H < trail Then ExitLong("LX","",size[1],0,CloseExit,Day)
        End If
        If (longOnly <= 0 Or longOnly = 2) Then
            If CrossesUnder(H,trail,0) Then Sell("SE",size,0,CloseEntry,Day)
            If L > trail Then ExitShort("SX","",size[1],0,CloseExit,Day)
        End If
    End If
End If
End Sub
'-----------------------------------------------------------------------------
' TRAILING RESISTANCE &nd SUPPORT STOPS (Trail_R_S)
' Function code
' Author: Sylvain Vervoort, TASC July 2009
' Coded by: Richard Denning 5/8/09
' www.TradersEdgeSystems.com

Function TRAIL_Res_Sup(pivotStr,minGap,gapMult,maxStop,ByRef resist as bararray,ByRef support as bararray)
' suggested default parameters: pivotStr = 5, minGap = 1.0013, gapMult = 0.9945, maxStop = 0.1

Dim lowerVal
Dim upperVal
Dim trail As BarArray
Dim SLow As BarArray
Dim SHigh As BarArray
Dim SHighBar As BarArray
Dim SLowBar As BarArray

' Get the price Of the last [pivotStr] bar swing High And Low
SLow = SwingLow(1,Low,pivotStr,120)
SHigh = SwingHigh(1,High,pivotStr,120)
' How many bars ago was the last swing High And swing Low
SLowBar = SwingLowBar(1,Low,pivotStr,120)
SHighBar = SwingHighBar(1,High,pivotStr,120)
If BarNumber = FirstBar Then
    resist = H * 1.1
    gvalue100 = resist
    support = L * 0.9
    gvalue101 = support
    trail = C
    gvalue102 = trail
End If
If resist[1] = 0 Then resist[1] = gvalue100
If support[1] = 0 Then support[1] = gvalue101
If trail[1] = 0 Then trail[1] = gvalue102

resist = IIF(SHighBar=pivotStr,SHigh,IIF(H<L[1]*minGap,L[1]*gapMult,IIF(H<resist[1]*(1-maxStop),resist[1]*(1-maxStop/2),resist[1])))
support = IIF(SLowBar=pivotStr,SLow, IIF(L>H[1]*minGap,H[1]*gapMult, IIF(L>support[1]*(1+maxStop),support[1]*(1+maxStop/2),support[1])))

upperVal = Min(resist, trail[1])
lowerVal = Max(support, trail[1])

If H>trail[1] And H[1]>trail[2] Then
   trail = lowerVal
Else If H<trail[1] And H[1]<trail[2] Then
    trail = upperVal
Else If C>trail[1] Then
    trail = support
Else
    trail = resist
End If
End If
End If

If trail = 0 Then trail = C
gvalue100 = resist
gvalue101 = support
gvalue102 = trail

TRAIL_Res_Sup = trail

End Function
'-----------------------------------------------------------------------------
' TRAILING RESISTANCE &nd SUPPORT STOPS (Trail_R_S)
' Indicator code
' Author: Sylvain Vervoort, TASC July 2009
' Coded by: Richard Denning 5/8/09
' www.TradersEdgeSystems.com

sub Trail_R_S_IND(pivotStr)
Dim resist As BarArray
Dim support As BarArray
Dim trail As BarArray
'pivotStr=2,minGap=1.0013,gapMult=0.9945
trail = TRAIL_Res_Sup(pivotStr,1.0013,0.9945,0.1,resist,support)
resist = gvalue100
support = gvalue101
If trail = 0 Then trail = C
plot1(trail)
End Sub
The code can be downloaded from the TradersStudio website at www.TradersStudio.com ->Traders Resources->FreeCode and also from www.TradersEdgeSystems.com/traderstips.htm.
![]() STRATASEARCH: TRAILING RESISTANCE &ND SUPPORT STOPS (TR&NDS)
STRATASEARCH: TRAILING RESISTANCE &ND SUPPORT STOPS (TR&NDS)
As with the other trailing stop formulas discussed in Sylvain Vervoort’s recent series of articles, the Tr&nds trailing stop presented in his article in this issue does a good job of letting the winning trades continue while cutting any losses quickly. In various tests, we found that the formula based on Vervoort’s article in this issue, “Trailing Resistance &nd Support Stops,” appeared to activate the exits more quickly, while being more cautious with the entries (Figure 13). This characteristic was intentionally added by Vervoort for this installment in the series, and it appears to be an effective enhancement.
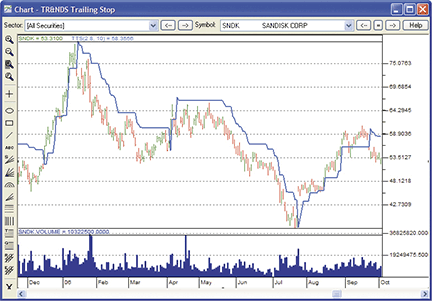
Figure 13: STRATASEARCH, TR&ndS Trailing Stop. One feature of the TR&NDS trailing stop is that it follows price closely on uptrends while leaving space on downtrends. This helps keep traders out of long trades during medium-term downtrends.
Nevertheless, this particular formula showed some weaknesses when we attempted to use it as a complete system. Despite tests using a variety of parameter sets, the percentage of profitable trades never rose above 50%. As well, the “maximum number of consecutive losses” also reached 15 when tested against the Nasdaq 100 from 2004 to 2007. This may be a larger number than many traders are comfortable with.
In a separate test, this formula was used in an automated search, where thousands of supporting trading rules were tested alongside this base system. The use of supporting rules improved the system drastically by increasing percentage profitability, bringing the “maximum consecutive losses” down to a reasonable number, and by boosting the annual returns of the system.
//************************************************************************************
// TR&ndS TRAILING-STOP
//************************************************************************************
TTS_API int TTS(Prices *pPrices, Values *pResults, int nTotDays, Values *pFact, Values *pPeriod) {

	int x;
	double PREV=0;
	double PREV1=0;
	Values *pHL;
	Values *pHLMov;
	Values *pHiLo;
	Values *pHref;
	Values *pLref;
	Values *pDiff1;
	Values *pDiff2;
	Values *pATRMod;
	double loss;
	double resistance;
	double support;
	double trends;
	int iPeriod;

	iPeriod = (int) pPeriod->dValue;

	pHL = (Values *) malloc(sizeof(Values) * nTotDays);
	ZeroMemory(pHL, sizeof(Values) * nTotDays);

	pHiLo = (Values *) malloc(sizeof(Values) * nTotDays);
	ZeroMemory(pHiLo, sizeof(Values) * nTotDays);

	pHref = (Values *) malloc(sizeof(Values) * nTotDays);
	ZeroMemory(pHref, sizeof(Values) * nTotDays);

	pLref = (Values *) malloc(sizeof(Values) * nTotDays);
	ZeroMemory(pLref, sizeof(Values) * nTotDays);

	pDiff1 = (Values *) malloc(sizeof(Values) * nTotDays);
	ZeroMemory(pDiff1, sizeof(Values) * nTotDays);

	pDiff2 = (Values *) malloc(sizeof(Values) * nTotDays);
	ZeroMemory(pDiff2, sizeof(Values) * nTotDays);

	// begin a loop of all the days in the price file
	for(x=0; x<nTotDays; x++) {
		pHL[x].dValue = pPrices[x].dHigh - pPrices[x].dLow;
		pHL[x].chIsValid = 'Y';
	}

	pHLMov = mov(pHL, iPeriod, nTotDays);

	// begin a loop of all the days in the price file
	for(x=1; x<nTotDays; x++) {

		// bypass days that haven't been seeded
		if(pHLMov[x].chIsValid != 'Y') {
			pResults[x].chIsValid = 0;
			pResults[x].dValue = 0;
			continue;
		}

		if(pPrices[x].dHigh-pPrices[x].dLow<1.5*pHLMov[x].dValue)
			pHiLo[x].dValue = pPrices[x].dHigh-pPrices[x].dLow;
		else
			pHiLo[x].dValue = 1.5*pHLMov[x].dValue;

		if(pPrices[x].dLow<=pPrices[x-1].dHigh)
			pHref[x].dValue = pPrices[x].dHigh-pPrices[x-1].dClose;
		else
			pHref[x].dValue = (pPrices[x].dHigh-pPrices[x-1].dClose)-
				(pPrices[x].dLow-pPrices[x-1].dHigh) / 2;

		if(pPrices[x].dHigh>=pPrices[x-1].dLow)
			pLref[x].dValue = pPrices[x-1].dClose-pPrices[x].dLow;
		else
			pLref[x].dValue = (pPrices[x-1].dClose-pPrices[x].dLow)-
				(pPrices[x-1].dLow-pPrices[x].dHigh) / 2;

		pDiff1[x].dValue = __max(pHiLo[x].dValue, pHref[x].dValue);
		pDiff2[x].dValue = __max(pDiff1[x].dValue, pLref[x].dValue);
		pDiff2[x].chIsValid = 'Y';
	}

	pATRMod = wsm(pDiff2, iPeriod, nTotDays);

	// begin a loop of all the days in the price file
	for(x=5; x<nTotDays; x++) {

		if(pATRMod[x].chIsValid != 'Y')
			continue;

		loss = pFact->dValue * pATRMod[x].dValue;
		resistance = pPrices[x].dClose + loss;
		if(pPrices[x].dLow>=pPrices[x-2].dLow &&
			pPrices[x-1].dLow>=pPrices[x-2].dLow &&
			pPrices[x-3].dLow>=pPrices[x-2].dLow &&
			pPrices[x-4].dLow>=pPrices[x-2].dLow) {
			support = pPrices[x-2].dLow;
		} else {
			if(pPrices[x].dLow>pPrices[x-1].dHigh*1.0013) {
				support = pPrices[x-1].dHigh * 0.9945;
			} else {
				if(pPrices[x].dLow>PREV*1.1)
					support = PREV*1.05;
				else
					support = PREV;
			}
		}
		PREV = support;

		if(pPrices[x].dHigh>PREV1 && pPrices[x-1].dHigh>PREV1) {
			trends = __max(PREV1, support);
		} else {
			if(pPrices[x].dHigh<PREV1 && pPrices[x-1].dHigh<PREV1) {
				trends = __min(PREV1, resistance);
			} else {
				if(pPrices[x].dHigh>=PREV1)
					trends = support;
				else
					trends = resistance;
			}
		}
		PREV1 = trends;

		pResults[x].dValue = trends;
		pResults[x].chIsValid = 'Y';
	}

	free(pHL);
	free(pHLMov);
	free(pHiLo);
	free(pHref);
	free(pLref);
	free(pDiff1);
	free(pDiff2);
	free(pATRMod);

	return 0;
}
As with all other StrataSearch Traders’ Tips, additional information — including plug-ins — can be found in the Shared Area of the StrataSearch user forum. This month’s plug-in allows StrataSearch users to run this base system in an automated search for supporting trading rules.
![]() TRADECISION: TRAILING RESISTANCE &ND SUPPORT STOPS (TR&NDS)
TRADECISION: TRAILING RESISTANCE &ND SUPPORT STOPS (TR&NDS)
In his article in this issue, “Trailing Resistance &nd Support Stops,” which is the final part of a three-part series, Sylvain Vervoort demonstrates a method of using a short-term trailing stop that moves close to the price action and is based on a trailing resistance & support stop that looks directly at the price movement.
Using the Function Builder in Tradecision, you create the Sve_Trends_Trail function for a trailing resistance and support stop:
function (Period:numeric=5,atrfact:Numeric=3.5):Numeric;
var
 HiLo:=0;
 Href:=0;
 Lref:=0;
 diff1:=0;
 diff2:=0;
 atrmod:=0;
 loss:=0;
 result:=0;
 support:= 0;
end_var

   HiLo:=iff(H - L < 1.5 * Mov(H - L, period, S), H - L, 1.5 * Mov(H - L, period, S));
   Href:=iff(L <= Ref(H, -1), H - Ref(C, -1), (h - ref(C, -1)) - (L - Ref(H, -1)) / 2);
   Lref:=iff(H >= Ref(L, -1), Ref(C, -1) - L, (Ref(C, -1) - L) - (Ref(L, -1) - H) / 2);

   diff1:=Max(HiLo, Href);
   diff2:=Max(diff1, Lref);

   atrmod:=EMA(diff2,period);
   loss:=atrfact*atrmod;

   support := iff(L >= Ref(L, -2) and Ref(L, -1) >= Ref(L, -2) and Ref(L, -3) >= Ref(L, -2) and Ref(L, -4) >= Ref(L, -2),
              Ref(L, -2), iff(L >Ref(H, -1) * 1.0013, Ref(H, -1) * 0.9945, iff(L > this\1\ * 1.1, this\1\ * 1.05, this\1\)));

if HISTORYSIZE <= period then result := C;
else
 begin
   if C > this\1\ AND C\1\ > this\1\  then result := Max(this\1\,support);
   else
   begin
      if C < this\1\ then result := Min(this\1\,C+loss);
      else
      begin
         if C > this\1\ then result := support;
               else result := C+loss;
      end;
   end;
 end;
return result;
Then you specify the strategy rules in Tradecision’s Strategy Builder:
Entry Long:
if Date() = 080102 then return true;
return false;

Exit Long:
return CrossBelow(SVE_TRENDS_Trail(5,3.5),C);
Entry Short:
if Date() = 081201 then return true;
return false;

Exit Short:
return CrossAbove(SVE_TRENDS_Trail(5,3.5),C);
As in Vervoort’s article, you need to enter the starting date manually. To define Date(), use a numeric value in the Yymmdd format. For example, Date would return “080102” if the day were January 2, 2008.
A sample chart is shown in Figure 14.
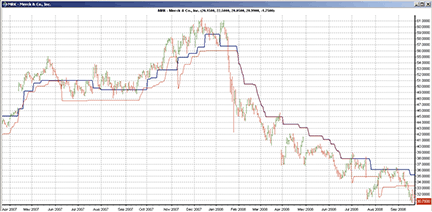
Figure 14: TRADECISION, COMPARISON OF DIFFERENT TRAILING STOPS. Here are the TR&NDS trailing stop (blue) and ATR trailing stop (red) plotted on a chart of Merck & Co.
To import this strategy into Tradecision, visit the area “Traders’ Tips from Tasc Magazine” at www.tradecision.com/support/tasc_tips/tasc_traders_tips.htm or copy the code from the Stocks & Commodities website at www.traders.com.
![]() NINJATRADER: TRAILING RESISTANCE &ND SUPPORT STOPS (TR&NDS)
NINJATRADER: TRAILING RESISTANCE &ND SUPPORT STOPS (TR&NDS)
We have implemented Sylvain Vervoort’s trailing resistance & support stop (Tr&nds) described in his article in this issue, “Trailing Resistance &nd Support Stops,” as a sample indicator (Figure 15) , available for download at www.ninjatrader.com/SC/July2009SC.zip.
Once it has been downloaded, from within the NinjaTrader Control Center window, select File > Utilities > Import NinjaScript and select the downloaded file. This indicator is for NinjaTrader Version 6.5 or greater.
You can review the indicator’s source code by selecting the menu Tools > Edit NinjaScript > Indicator from within the NinjaTrader Control Center window and then selecting “TrendsTrailingStop.”
NinjaScript indicators are compiled Dlls that run native, not interpreted, which provides you with the highest possible performance.
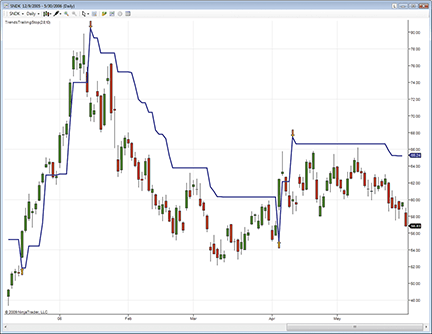
Figure 15: NINJATRADER, TR&ndS. This screenshot shows Sylvain Vervoort’s trailing resistance & support stop (TR&NDS) indicator running on a daily chart of SNDK.
![]() WAVE59: TRAILING RESISTANCE &ND SUPPORT STOPS (TR&NDS)
WAVE59: TRAILING RESISTANCE &ND SUPPORT STOPS (TR&NDS)
In his article in this issue, “Trailing Resistance &nd Support Stops,” Sylvain Vervoort demonstrates a trailing stop method based on detecting pivots and gaps.
The following script implements his method in Wave59 as both an indicator and a mechanical trading system (Figure 16). Wave59 users can import the following code into their charts from the QScript Library by clicking “Scripts - Online QScript Library - Browse.”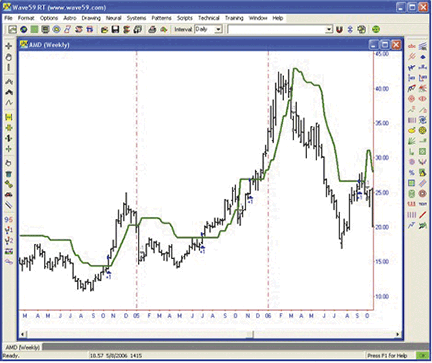
Figure 16: WAVE59, Trailing Resistance &nd Support Stops. Over the period 2001–09, Sylvain Vervoort’s TR&NDS method cranked out a 100% gain on AMD, which is about four times better than buy & hold.
#From Sylvain Vervoort's July 2009 Article in S&C Magazine
#Computes and plots his Tr&nds trailing stop
#if apply_system is true, vervoort's entry system will be applied
input:atrfact(2.8),period(10),apply_system(false),color(red),thickness(2);
#initialize key variables
if (barnum==barsback)
    trends,resistance,support=close;
#compute resistance
avg1=average(h-l,period);
if (h-l<1.5*avg1)
   hilo=h-l;
else
   hilo=1.5*avg1;
if (l<=h[1])
   href=h-c[1];
else
href=(h-c[1])-(l-h[1])/2;
if (h>=l[1])
   lref=c[1]-l;
else
    lref=(c[1]-l)-(l[1]-h)/2;
diff=max(hilo,href,lref);
atrmod=wilder_average(diff,period);
loss=atrfact*atrmod;
resistance=c+loss;
#compute support
if ((l>=l[2]) and (l[1]>=l[2]) and (l[3]>=l[2]) and (l[4]>=l[2]))
   support=l[2];
else {
   if (l>h[1]*1.0013)
      support=h[1]*0.9945;
   else {
      if (l>trends[1]*1.1)
         support=trends[1]*1.05;
       else
         support=trends[1];
    }
}

#determine tr&nds line
if (h>trends[1] and h[1]>trends[1])
    trends=max(trends[1],support);
 else {
   if ((h<trends[1]) and (h[1]<trends[1]))
       trends=min(trends[1],resistance);
    else {
       if (h>=trends[1])
          trends=support;
       else
          trends=resistance;
    }
}
#Vervoort's trading system - use high as trigger over/under tr&nds line
if (apply_system==true) {
   if ((marketposition<=0) and (high>trends))
      buy(1,close,"market","onebar");
   else if ((marketposition>0) and (high<trends))
      exitlong(0,close,"market","onebar");
}
#plot it
plot1=trends;
color1=color;
thickness1=thickness;
![]() VT TRADER: TRAILING RESISTANCE &ND SUPPORT STOPS (TR&NDS)
VT TRADER: TRAILING RESISTANCE &ND SUPPORT STOPS (TR&NDS)
Our Traders’ Tip this month is based on “Trailing Resistance &nd Support Stops” by Sylvain Vervoort in this issue. We’ll be offering the Tr&nds indicator for download in our online forums. The VT Trader code and instructions for recreating the indicator are as follows:
- Navigator Window>Tools>Indicator Builder> [New] button
- In the Indicator Bookmark, type the following
text for each field:
Name: TASC - 07/2009 – Trailing Resistance and Support Stops
Short Name: tasc_TRANDS
Label Mask: TASC - 07/2009 - Trailing Resistance and Support
Stops (%period%,%atrfact%) | %Trends%
Placement: Price Frame
Inspect Alias: tasc_TRANDS
- In the Input Bookmark, create the following variables:
[New] button... Name: period , Display Name: ATR Periods ,
Type: integer , Default: 10
[New] button... Name: atrfact , Display Name: ATR Multiplication ,
Type: float , Default: 2.8000
- In the Output Bookmark, create the following
variables:
[New] button...
Var Name: Trends
Name: (Trends)
Line Color: blue
Line Width: thin
Line Type: dashed
- In the Formula Bookmark, copy and paste the
following formula:
{Provided By: Capital Market Services, LLC & Visual Trading
Systems, LLC}
{Copyright: 2009}
{Description: TASC, July 2009 - "Trailing Resistance &nd Support Stops" by Sylvian Vervoort}
{File: tasc_TRANDS.vtsrc - Version 1.0}

HiLo:= if(H-L<1.5*mov(H-L,period,S),H-L,1.5*mov(H-L,period,S));

Href:= if(L<=ref(H,-1),H-ref(C,-1),(H-ref(C,-1))-(L-ref(H,-1))/2);
Lref:= if(H>=ref(L,-1),ref(C,-1)-L,(ref(C,-1)-L)-(ref(L,-1)-H)/2);

Diff1:= max(HiLo,Href);
Diff2:= min(Diff1,Lref);

ATRmod:= wilders(Diff2,period);
Loss:= atrfact*ATRmod;

Resistance:= C+Loss;

Support:= if(L>ref(L,-2) AND
             ref(L,-1)>=ref(L,-2) AND
             ref(L,-3)>=ref(L,-2) AND
             ref(L,-4)>=ref(L,-2),
             ref(L,-2),
          if(L>ref(H,-1)*1.0013,ref(H,-1)*0.9945,
          if(L>PREV*1.1,PREV*1.05,PREV)));

Trends:= if(BarCount()>=period,
         if(H>PREV(0) AND ref(H,-
1)>PREV(0),max(PREV(0),Support),
         if(H<PREV(0) AND ref(H,-
1)<PREV(0),min(PREV(0),Resistance),
         if(Cross(H,PREV(0)),Support,
         if(Cross(PREV(0),H),Resistance,
         if(H=PREV(0),PREV(0),PREV(0)))))),
         NULL);
- Click the “Save” icon to finish building the Tr&nds indicator.
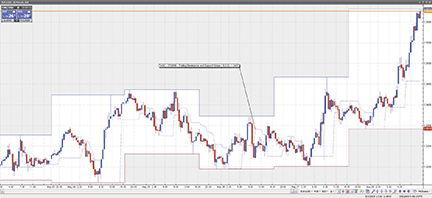
Figure 17: VT TRADER, Trailing Resistance &nd Support Stops. Here is the TR&NDS indicator on a EUR/USD 30-minute candlestick chart.
To attach this indicator to a chart (Figure 17), click the right mouse button within the chart window and select “Add Indicator” -> “Tasc - 07/2009 - Trailing Resistance and Support Stops” from the indicator list.
To learn more about VT Trader, visit www.cmsfx.com.
Risk disclaimer: Forex trading involves a substantial risk of loss and may not be suitable for all investors.
![]() TRADE-IDEAS: TRAILING RESISTANCE &ND SUPPORT STOPS (TR&NDS)
TRADE-IDEAS: TRAILING RESISTANCE &ND SUPPORT STOPS (TR&NDS)
“Eventually, luck runs out; skill does not.”—Scalper68 (AlexD)
In “Trailing Resistance &nd Support Stops” in this issue, Sylvain Vervoort offers a third installment in his series on trailing stop methods. He calls this stop method the trailing resistance & support stop, which evaluates price movements or turning points.
This trailing stop method most closely resembles the Trade-Ideas technique of automating the creation of a custom trailing stop based on a stock’s natural 15-minute volatility. Thus, our strategy this month retains all of the settings from our June 2009 Traders’ Tip and adds an updated set of backtested results. Only a few additional filters are applied to make sure the strategy trades with good volume. Subscribers to Trade-Ideas Pro who use our event-based backtesting tool, The OddsMaker, already understand the different premise these tools use to find high-probability winning trades. To recap briefly, The OddsMaker doesn’t just look at 25 stocks, à priori, to generate backtest results, it considers any stock that matched a desired pattern in the market, finds that stock, and applies the backtest’s rule set before summing up the results into a detailed set of totals: win rate, average winner, average loser, net winnings, and confidence factor.
Description: “Modified ATR Volatility Stop Part 2 (July 2009 version)”
Provided by:
Trade-Ideas (copyright © Trade-Ideas, LLC 2009). All rights reserved. For educational purposes only.
Remember these are sketches meant to give an idea how to model a trading plan. Trade-Ideas.com and all
individuals affiliated with this site assume no responsibilities for trading and investment results.
Type or copy/paste this shortened string directly into a browser, then copy/paste the full-length link into Trade-Ideas Pro using the “collaborate” feature (right-click in any strategy window):
https://bit.ly/19DiKt (case sensitive).
This strategy also appears on the Trade-Ideas blog at https://marketmovers.blogspot.com/, or you can build the strategy from Figure 18.
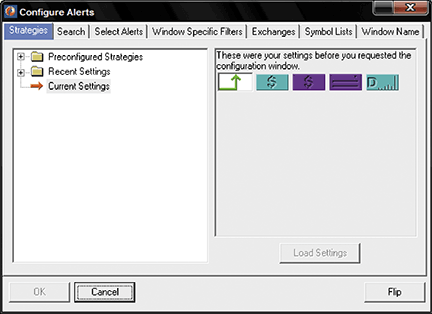
Figure 18: TRADE-IDEAS, ALERTS AND FILTERS. Here is the combination of alerts and filters that was used in the June 2009 Traders’ Tip based on part 2 of Sylvain Vervoort’s series on trailing stops. This was called the “modified ATR volatility stop” strategy.
Trade-Ideas approached the average true range stop-loss using a modified Atr, called “Trailing stop, volatility down,” based on the average 15-minute volatility of a stock. The modified Atr is similar to the “wiggle” strategy that we discussed in the June 2009 Traders’ Tips.
Entry signals were created that went short any time a stock between $5 and $50 moved up 75 cents or more in one minute or less.
Figure 18 shows the configuration of this strategy, where one alert and nine filters are used with the following settings:
- Running up now (in 1 minute or less), $0.75
- Min price filter = 5 ($)
- Max price filter = 50 ($)
- Max distance from inside market filter = 0.15 (%)
- Min daily volume filter = 300,000 (shares/day)
The definitions of these indicators appear here: https://www.trade-ideas.com/Help.html.
That’s the strategy, but what about the trading rules? How should the opportunities that the strategy finds be traded? For the stop-loss we used one of the more advanced options available in the OddsMaker. Instead of using a traditional stop-loss, we selected “Another Alert” as the exit condition called “Trailing stop, volatility down.” This alert is triggered when a stock moves down an amount equal to the average 15-minute volatility multiplied by the number of 15-minute bars we decide — in this case, 2. For example, if the average 15-minute volatility is 10 cents, this alert would not trigger until a stock moves down at least 20 cents.
Here is what The OddsMaker tested for the past three weeks ended 5/8/2009, given the following trade rules:
- On each alert, sell short the symbol (price moves down to be a successful trade)
- Schedule an exit for the stocks 30 minutes after entry
- Start trading from the open and stop trading 30 minutes later
- Set a stop using the alert “Trailing stop, volatility down,” with a setting of two bars.
The OddsMaker summary provides the evidence of how well this strategy and our trading rules did. The settings used are shown in Figure 19.
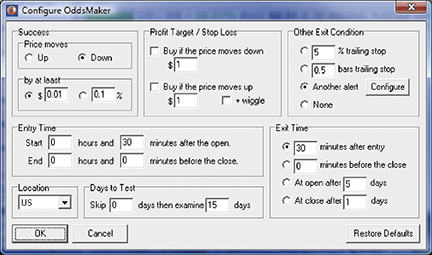
Figure 19:TRADE-IDEAS, BACKTESTING CONFIG. This shows the OddsMaker backtesting configuration for the strategy “modified ATR volatility stop” from last month.
The results (last backtested for the three-week period ended 5/8/2009) are shown in Figure 20. Summary: This strategy generated 228 trades, of which 137 were profitable, for a win rate of 60%. The average winning trade generated $0.24 in profit and the average loser lost $0.14. The net winnings of using this strategy for 15 trading days generated $21.70 points. If you normally trade in 100-share lots, this strategy would have generated $2,170. The z-score or confidence factor that the next set of results will fall within this strategy’s average winner and loser is 99%.
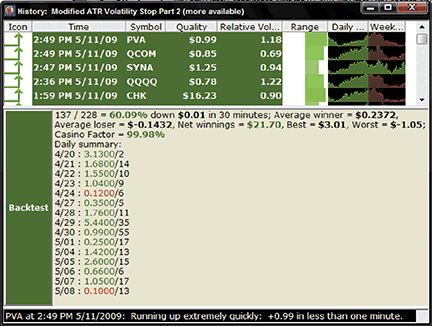
Figure 20: TRADE-IDEAS, ODDSMAKER RESULTS. Here are sample OddsMaker results for the modified ATR volatility stop strategy.
See the user manual at https://www.trade-ideas.com/OddsMaker/Help.html to understand these backtest results from The OddsMaker in more detail.
![]() METASTOCK: TRAILING RESISTANCE &ND SUPPORT STOPS (TR&NDS) (VERVOORT ARTICLE CODE)
METASTOCK: TRAILING RESISTANCE &ND SUPPORT STOPS (TR&NDS) (VERVOORT ARTICLE CODE)
From Sylvain Vervoort’s article in this issue, “Trailing Resistance &nd Support Stops”.
SVE TRENDS TRAIL DATE BY METASTOCK
{TR&NDS trailing stop from start date: SVE_Trends_Trail_Date}
InpMonth:=Input("Month",1,12,8);
InpDay:=Input("Day",1,31,16);
InpYear:=Input("Year",1800,2050,2004);
InitStop:=Input("Initial Stop Price",0.1,10000,9);
Support:=If(L>=Ref(L,-2) AND Ref(L,-1)>=Ref(L,-2) AND Ref(L,-3)>=Ref(L,-2) AND Ref(L,-4)>= Ref(L,-2),Ref(L,-2), If(L>Ref(H,-1)*1.0013,Ref(H,-1)*0.9945,
If(L>PREV*1.1,PREV*1.05, PREV)));
Entry:= InpYear=Year() AND InpMonth=Month() AND InpDay=DayOfMonth();
StopLong:=ExtFml("AdvancedStop.StopLong", Entry,InitStop,0,
Support-(H-L),0,0,0,0);
StopLong