INDICATORS
Applying Levine’s Topfinder/Bottomfinder
Market Trend And Midas
Here’s an in-depth look at an indicator that is part of Midas, the well-known market data analysis system. In this, the first of a three-part series, we will look at the formula used to calculate it.
The innovative work of the late technical analyst Paul Levine into the application of volume-weighted average price (Vwap) principles to the financial markets has drawn attention in recent years. One result of this work is an indicator many readers will by now be familiar with. Levine called it Midas, an acronym for the market interpretation/data analysis system. The other result of this work is an indicator Levine called the “topfinder/bottomfinder,” the subject of this article.
Outside of Levine’s work, a standard Vwap calculation (the total value of shares traded in a particular stock on a given day divided by the total volume of shares traded in that stock on that same day) is typically used as a benchmark to measure the efficiency of institutional trading. It is also a standard tool in the brokerage industry in that a Vwap execution is a way of earning a trader’s commission. Beyond this, rudimentary Vwap calculations have played a limited role in trading decisions, as in technician Kevin Haggerty’s methodology of establishing whether a stock price has closed above its daily Vwap.

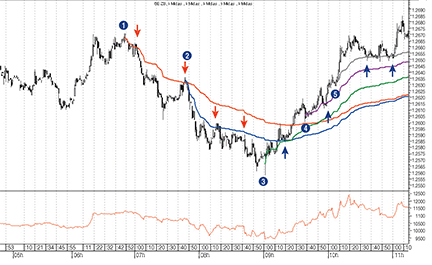
Figure 1: ONE-minute chart of euro globex december 2008 futures. Here you see two resistance curves in the downtrend and three support curves in the uptrend of a V-shaped bottom. MIDAS is performing its first role as the locator of the end of temporary trend exhaustion points (pullbacks).
A radical extension of this standard Vwap calculation, however, has resulted in a technical charting indicator capable of fractal market analysis across multiple chart time frames. As George Reyna showed in his article in the May 2001 issue of Stocks & Commodities (see “Suggested reading” at the end of this article), the Midas indicator on the daily charts generates robust nonlinear support and resistance curves that indicate major trend reversals.
Midas has gained a reputation as a powerful indicator of trend exhaustion points in the primary (nine months to two years) and intermediate (six weeks to nine months) trends. However, recent articles have revealed that Levine’s fractal philosophy applies not only to different segments of the daily trend but also to smaller components that can be analyzed on intraday time frames.