Forex Focus
Intermarket System Down Under
Trading The Aussie
This system exploits the traditionally strong correlation between the Australian dollar and commodities.
The Australian dollar, along with the Canadian dollar, the New Zealand dollar, and the South African rand, is regarded as a “commodity currency,” owing to the sizable role of commodity production in the Australian economy. In 2008—09, iron ore is forecast to be Australia’s largest export commodity (in value terms), followed by coal, gold, and crude oil. The country’s largest agricultural export commodity is wheat, ranked 10th overall in commodity export earnings. In addition, Australia is the world’s biggest exporter of metallurgical coal, which is used by steelmakers.
Although trading the Australian dollar is not as popular as trading the euro or the yen, it is a fascinating currency because of its strong historical correlation to gold and the whole commodity complex. The direction of commodity prices, interest rate differentials with the US, Japan, and other countries, commodity prices, and the Aud/Jpy carry trade are all key variables moving the Aussie dollar.

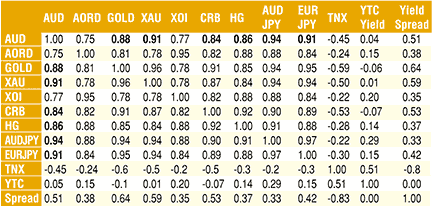
FIGURE 1: nonparametric correlation between Australian dollar and other related commodity, equity Indexes, and forex. The correlations were calculated using 10 years of data from 10/24/98 until 10/24/08. The XAU is the Philadelphia Gold & Silver Sector Index, the XOI is the AMEX Oil Index, the HG is COMEX Copper futures, the TNX is the 10-year US Treasury yield, the YTC is the yield extracted from Australian 10-year Treasury bond futures trading in the SFE, and yield spread is the spread between the Australian and US 10-year Treasury yield.
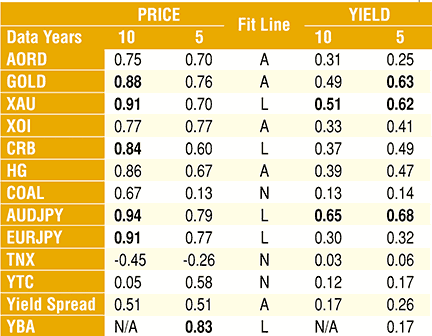
For the last 10 years, the aussie had a strong correlation coefficient with gold and other commodities (see Figures 1 and 2). In fact, gold correlated better with the aussie (p = 0.88) than with silver (p = 0.84).

FIGURE 2: nonparametric correlation between Australian dollar (AUD/USD) and other related commodity, forex, and equity Indexes. The correlations were calculated using five and 10 years of data until 10/24/08. In the first two columns, the correlations were calculated using price data and in the last two columns using 10-day (two-week) percentage yields. In the middle column is a description of the regression fit line (N = nonlinear, A = approx. linear, and L = linear). YBA is the 90-day yield extracted from Australian bank bill futures trading in the SFE. Unfortunately, data for the YBA was only available since 4/3/03.
The carry trade strategy, which exploits interest rate differences between currencies, turned the Australian dollar into the favorite currency of global traders as speculators borrowed yen at 1% or lower in order to invest them in Australian dollar bonds or mining stocks.