TRADING TECHNIQUES
Visualize And Identify
Trading The Electronic Futures Market
Using this technique, you can visualize market direction and identify supply and demand zones so you can enter trades with a high probability of success.
Data available to futures traders for analysis is price, time, volume, and open interest. All analytic methods use this information to display price action and to create technical indicators derived from these four datasets:
- Price is available as open, high, low, close for a finite time period such a daily, weekly, monthly, or segments of a trading day such as portions of an hour or day.
- Volume for any given period can be broken down for any given time segment and displayed as an indicator or used to construct volume-based bars.
- Open interest is largely ignored in technical analysis because the fluctuation of open interest is thought to play a minor role in trading decisions and rarely triggers a trade.
- Time segments during a 24-hour electronic trading day are of interest because of spikes in volume related to news events, volume during the open outcry pit sessions, and volume from various parts of the world as trading progresses from East to West, continent to continent, as the 24-hour electronic trading day progresses.
Most traders use charts that are time-segmented, but modern charting software allows tick, volume, or time charting. Tick charts show the number of trades, but not volume. Finite time bars can be misleading because they fail to show heavy volume activity during the period of the price bar. The price bar displayed could represent only a few contracts or 1,000 contracts, and it is a distraction to look at a volume indicator to decide if any given price bar is more relevant because it represents unusually high volume, reaction to a news event, or attainment of a resistance or support level. In addition, irrelevant, low-volume time bars can trigger stops, which benefit only the stop-runners.
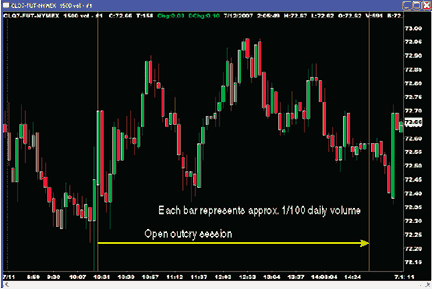
FIGURE 1: charting VOLUME. Each bar represents 1/100 of electronic daily volume. Approximately 70% of the electronic trades take place during the open outcry NYMEX pit session.
Since it takes volume to move price, it is more informative to display equal volume bars to show the activity and price level at any given point in time. Figure 1 displays one day of trading in crude oil, each bar representing approximately 1/100 of the daily volume. Of the electronic trades, 70% occur during the open outcry session and 30% occur outside of the pit session. Figure 2 is a 15-minute chart of the same day showing price action before, during, and after the open outcry session.
As a trader using only your usual analysis methods, which chart do you think is more informative and easier to interpret?
Many professional traders eschew indicators because most indicators such as moving averages are lagging. During periods of price acceleration, bars or candlesticks are long, and during periods of consolidation or distribution, bars tend to have a narrow range.